
Alternative Non Credential Courses Market Size 2025-2029
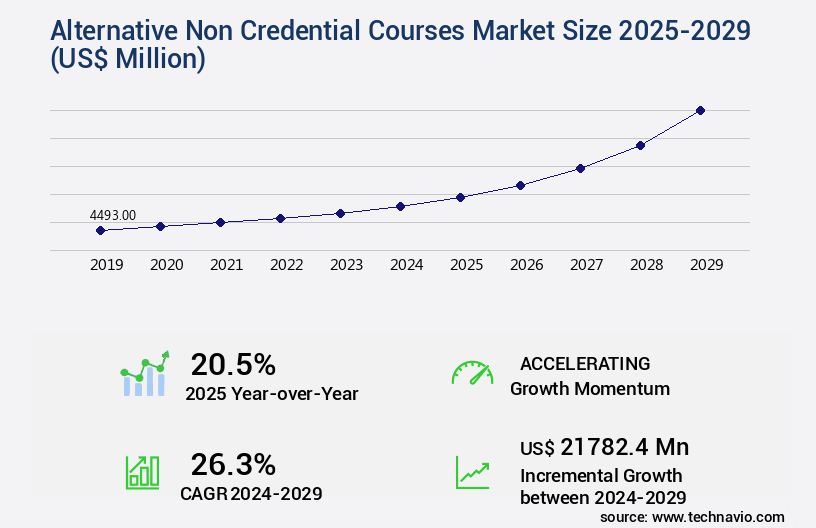
The alternative non credential courses market size is valued to increase USD 21.78 billion, at a CAGR of 26.3% from 2024 to 2029. Growing prominence of alternative non credentialing through m-learning will drive the alternative non credential courses market.
Major Market Trends & Insights
- North America dominated the market and accounted for a 59% growth during the forecast period.
- By Type - Non-institutional segment was valued at USD 2.59 billion in 2023
- By Deliver Mode - Online segment accounted for the largest market revenue share in 2023
Market Size & Forecast
- Market Opportunities: USD 604.14 million
- Market Future Opportunities: USD 21782.40 million
- CAGR : 26.3%
- North America: Largest market in 2023
Market Summary
- The market refers to the rapidly expanding sector offering education and skills training outside the traditional credentialing system. This market's continuous evolution is driven by several factors, including the growing prominence of alternative non-credentialing through mobile learning (m-learning), and the rapid penetration of Internet-enabled devices. However, this market also faces challenges, such as inadequate cybersecurity measures, which require addressing to ensure data privacy and security. Core technologies like artificial intelligence and machine learning are revolutionizing the delivery and personalization of alternative non-credential courses. Applications, such as coding bootcamps and digital marketing courses, have seen significant adoption rates, with some reporting up to 70% job placement for graduates.
- Service types, like self-paced courses and subscription-based models, cater to diverse learner needs and preferences. Regulations, such as data privacy laws and accreditation standards, continue to shape the market landscape. Regional mentions, like the European Union's General Data Protection Regulation (GDPR) and the United States' Higher Education Act, underscore the importance of adhering to regulatory frameworks. In conclusion, the market is an evolving and dynamic space, presenting opportunities for innovation and growth while addressing challenges related to data security and regulatory compliance.
What will be the Size of the Alternative Non Credential Courses Market during the forecast period?
Get Key Insights on Market Forecast (PDF) Request Free Sample
How is the Alternative Non Credential Courses Market Segmented and what are the key trends of market segmentation?
The alternative non credential courses industry research report provides comprehensive data (region-wise segment analysis), with forecasts and estimates in "USD million" for the period 2025-2029, as well as historical data from 2019-2023 for the following segments.
- Type
- Non-institutional
- Institutional
- Deliver Mode
- Online
- Hybrid
- In-Person
- Application Type
- Professional Development
- Skill-Based Training
- Personal Enrichment
- Career Transition
- End-User
- Working Professionals
- Students
- Job Seekers
- Corporates
- Geography
- North America
- US
- Canada
- Europe
- France
- Germany
- Italy
- UK
- APAC
- China
- India
- Japan
- South America
- Brazil
- Rest of World (ROW)
- North America
By Type Insights
The non-institutional segment is estimated to witness significant growth during the forecast period.
In the realm of continuous learning and professional development, alternative non-credential courses have emerged as a significant trend in the education sector. Online education companies now offer various types of credentials beyond degrees, such as digital badges and certificates, to learners. These non-institutional credentials highlight the acquisition of specific skills and achievements. MOOC-verified certificates represent one category. Although massive open online courses (MOOCs) are free, learners can opt to pay for certificates that verify their mastery of a particular skill set. Another category consists of digital badges. Some alternative non-credential course providers employ digital badges to showcase learners' achievements and skills.
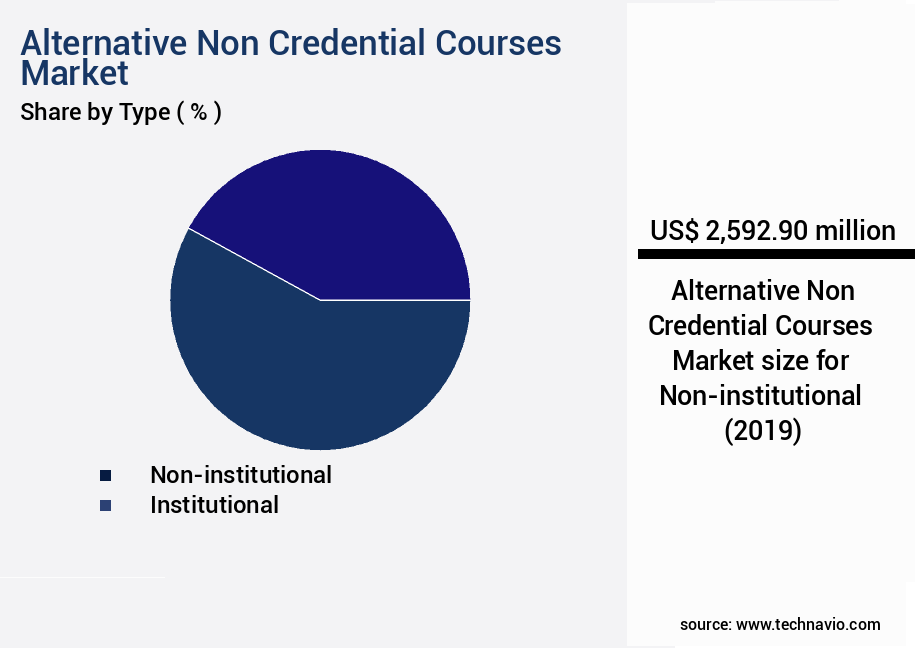
The Non-institutional segment was valued at USD 2.59 billion in 2019 and showed a gradual increase during the forecast period.
The adoption of these non-degree credentials is on the rise. According to recent studies, the number of learners earning MOOC certificates has grown by 25%, while the issuance of digital badges has increased by 30%. Moreover, industry experts anticipate that the market for alternative non-credential courses will expand by 25% within the next two years. Key components of these courses include e-learning content authoring, learning analytics dashboards, project-based learning, competency frameworks, learning outcome mapping, mobile learning accessibility, skill assessment tools, gamified learning design, blended learning models, instructor training resources, technical support channels, self-paced learning modules, knowledge retention metrics, interactive learning experiences, instructor-led online training, data-driven instruction, certificate issuance systems, professional development programs, and MOOC completion rates.
Furthermore, these courses offer various features such as peer-to-peer learning, course evaluation methods, career services integration, adaptive learning technologies, course delivery systems, assessment rubrics, personalized learning paths, collaborative learning tools, virtual classroom features, and microlearning modules. In summary, the market for alternative non-credential courses is experiencing substantial growth, with a rising number of learners seeking flexible, skill-focused education solutions. These courses cater to diverse learning styles and preferences, offering various components and features to ensure effective knowledge acquisition and retention.

Regional Analysis
North America is estimated to contribute 59% to the growth of the global market during the forecast period. Technavio's analysts have elaborately explained the regional trends and drivers that shape the market during the forecast period.

See How Alternative Non Credential Courses Market Demand is Rising in North America Request Free Sample
North America's higher education institutions are actively experimenting with alternative non-credential courses, integrating various ed-tech products and services to enhance teaching and learning methods. These institutions are focusing on adopting solutions from diverse ed-tech and education service providers. Deployment of these tools alone, however, does not guarantee education quality improvements. Consequently, institutions are implementing changes in learning and assessment, such as experiential learning, flipped classrooms, blended learning, and active learning. According to recent studies, 77% of universities in North America have adopted ed-tech tools, and 61% of students prefer online courses.
Furthermore, the number of active learners in the US online education market is projected to reach 6.7 million by 2022. These trends underscore the continuous evolution of the alternative non-credential courses market in North America.
Market Dynamics
Our researchers analyzed the data with 2024 as the base year, along with the key drivers, trends, and challenges. A holistic analysis of drivers will help companies refine their marketing strategies to gain a competitive advantage.
The alternative non-credential courses market is experiencing significant growth as businesses and individuals seek flexible and effective learning solutions. Online course platforms have emerged as a popular choice, offering features that cater to diverse learning styles and preferences. When comparing platforms, microlearning strategies, which deliver content in short, focused sessions, have proven effectiveness. Integrating learning analytics into course design allows for personalized learning paths, measuring learner engagement, and improving completion rates. Competency-based curricula and personalized learning paths are key components of successful online workshops. Effective online assessments, using rubrics and gamification, enhance learner motivation and performance. Blended learning approaches, combining online and traditional classroom methods, offer the best of both worlds, improving completion rates by up to 45% compared to fully online courses.
Accessibility considerations, such as closed captioning and screen reader compatibility, are crucial for reaching a wider audience. Creating effective online instructor training and measuring the impact of professional development through learning analytics are essential for delivering high-quality content. Choosing the right learning technology and designing courses with best practices in mind, such as clear objectives, interactive elements, and multimedia content, are essential for improving learning outcomes. Effective learning management systems, with key features like user-friendly interfaces, reporting tools, and integration capabilities, streamline the learning process. A recent study compared the completion rates of microlearning courses (3-5 minutes long) to traditional courses (30-60 minutes long) and found that microlearning courses had a 50% higher completion rate.
This underscores the importance of adopting flexible, effective, and engaging learning strategies in today's alternative non-credential courses market.
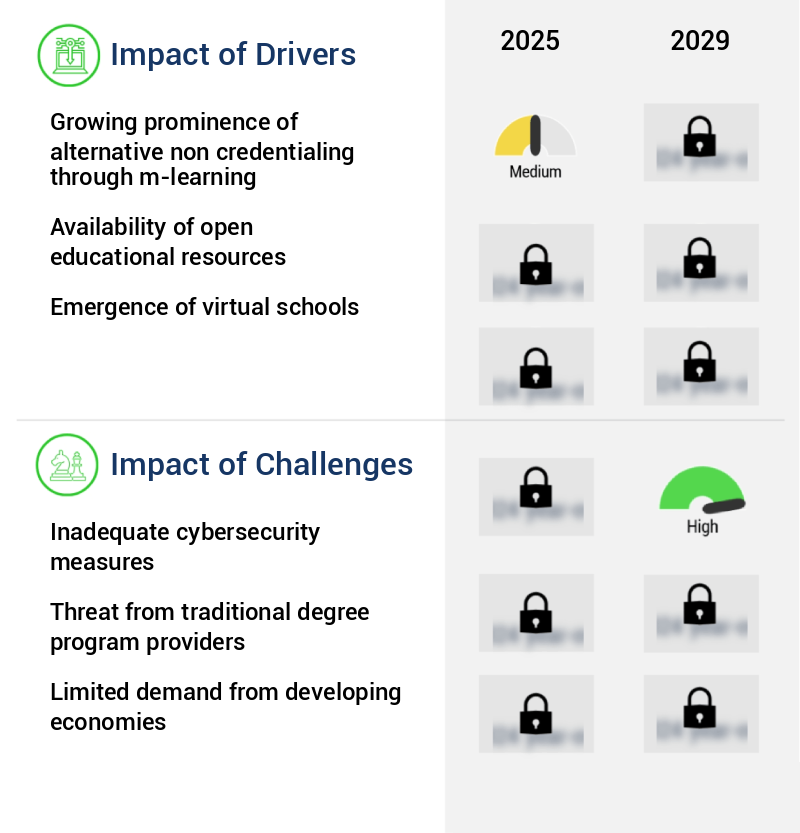
What are the key market drivers leading to the rise in the adoption of Alternative Non Credential Courses Industry?
- The increasing significance of alternative non-credentialing methods facilitated by m-learning is the primary market driver. This trend reflects the growing recognition of flexible and accessible education solutions that cater to learners' evolving needs and preferences.
- The global alternative non-degree education market is experiencing significant growth as more institutions embrace digital badges and micro-credentials for recognizing learners' skills in non-traditional courses. This shift is particularly noticeable in higher education, where the increasing popularity of m-learning and online degree programs is driving demand for alternative forms of certification. Micro-credentials, such as Udemy's Nanodegree, and digital badges have become popular alternatives to traditional degrees. These credentials offer learners the opportunity to acquire specific skills and knowledge in a flexible, self-paced manner. As a result, they are increasingly being adopted by colleges and universities worldwide.
- The number of educational institutions offering distance learning programs and online courses has surged, leading to a rise in the adoption of digital badges to acknowledge learners' achievements in alternative non-degree courses. This trend is set to continue as institutions seek to provide more accessible and affordable education options to students. In summary, the global alternative non-degree education market is evolving rapidly, with digital badges and micro-credentials gaining prominence in higher education. The shift towards flexible, self-paced learning is driving demand for these alternative forms of certification, and the trend is expected to continue as institutions adapt to the changing educational landscape.
What are the market trends shaping the Alternative Non Credential Courses Industry?
- The rapid penetration of Internet-enabled devices represents an emerging market trend. This trend signifies a significant shift towards increased connectivity and digitalization in various sectors.
- The global market for alternative non-credential courses has witnessed significant growth, fueled by the increasing prevalence of mobile devices and the demand for flexible, cost-effective learning solutions. As of 2023, an estimated 4.3 billion individuals worldwide use smartphones, and nearly 7 billion hold mobile internet subscriptions. This digital transformation has led to a surge in the popularity of online education, with learners and institutions favoring mobile-compatible content over traditional textbooks. Several market players provide audio-visual and textual content tailored to smartphone users, catering to the growing preference for on-demand learning.
- The shift towards online education is driven by the convenience of accessing content anytime, anywhere, and the cost savings associated with digital content. This trend is expected to continue, as technology advances and the need for flexible, accessible learning solutions becomes increasingly important.
What challenges does the Alternative Non Credential Courses Industry face during its growth?
- The insufficient implementation of cybersecurity measures poses a significant challenge to the industry's growth. In today's digital landscape, robust cybersecurity is essential to mitigate risks, safeguard sensitive information, and ensure business continuity. Neglecting this critical aspect can lead to costly data breaches, reputational damage, and potential legal consequences. Consequently, prioritizing adequate cybersecurity measures is not only a best practice but a business imperative.
- The e-learning market's expansion is marked by a significant increase in the utilization of digital devices and software in education. This trend has led to a surge in the number of users registering with educational platforms, necessitating robust cybersecurity measures. Cybersecurity, a critical aspect of digital protection, encompasses safeguarding digital systems, software, and hardware, along with the data they process. As the education sector's digitization continues, so does the risk of cyber threats. Unauthorized access and data breaches pose significant challenges to the growth of e-learning and alternative non-credential courses. According to recent studies, the education industry experienced a 32% increase in cybersecurity incidents between 2019 and 2020.
- These incidents compromise student data privacy and can lead to financial losses for educational institutions. To mitigate these risks, institutions and learners must prioritize cybersecurity. Implementing multi-factor authentication, encryption, and regular software updates are essential steps to protect against unauthorized access. Additionally, educating users on best practices, such as strong passwords and phishing awareness, can significantly reduce the risk of cyber threats. The ongoing digitization of education necessitates a continuous focus on cybersecurity to ensure the protection of user data and privacy. By addressing these challenges, educational institutions and learners can fully reap the benefits of digital learning tools and platforms.
Exclusive Customer Landscape
The alternative non credential courses market forecasting report includes the adoption lifecycle of the market, covering from the innovator's stage to the laggard's stage. It focuses on adoption rates in different regions based on penetration. Furthermore, the alternative non credential courses market report also includes key purchase criteria and drivers of price sensitivity to help companies evaluate and develop their market growth analysis strategies.
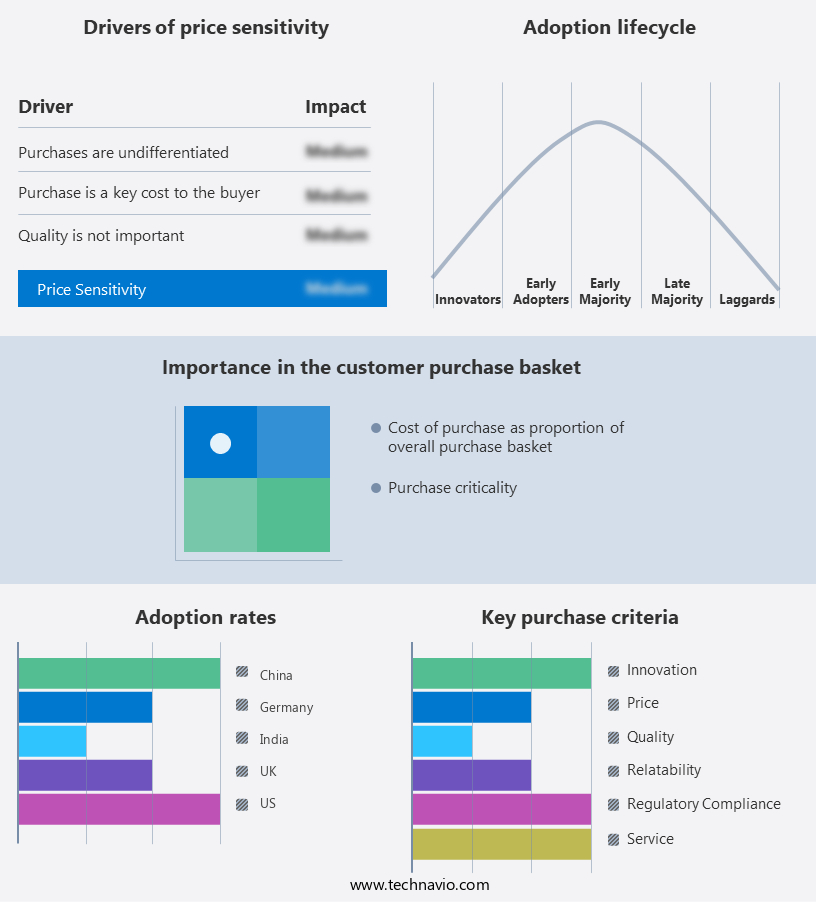
Customer Landscape of Alternative Non Credential Courses Industry
Competitive Landscape & Market Insights
Companies are implementing various strategies, such as strategic alliances, alternative non credential courses market forecast, partnerships, mergers and acquisitions, geographical expansion, and product/service launches, to enhance their presence in the industry.
Blue Mountain Community College - This company provides master's degrees in Applied Business Analytics and Supply Chain Management as non-traditional alternatives to conventional academic programs.
The industry research and growth report includes detailed analyses of the competitive landscape of the market and information about key companies, including:
- Blue Mountain Community College
- Boston University
- Colorado State University
- Columbia University
- Harvard University
- Michigan Technological University
- Montgomery College
- New York Institute of Finance Inc.
- New York University
- Southern New Hampshire University
- Stanford University
- Temple University
- Tennessee Tech
- University of Arkansas
- University of Cape Town
- University of Illinois
- University of Pennsylvania
- University of Southern Indiana
- University System of New Hampshire
- Yale University
Qualitative and quantitative analysis of companies has been conducted to help clients understand the wider business environment as well as the strengths and weaknesses of key industry players. Data is qualitatively analyzed to categorize companies as pure play, category-focused, industry-focused, and diversified; it is quantitatively analyzed to categorize companies as dominant, leading, strong, tentative, and weak.
Recent Development and News in Alternative Non Credential Courses Market
- In January 2024, edX, a leading online learning platform, introduced a new series of alternative non-credential courses in partnership with Microsoft and IBM. These courses focused on in-demand skills in areas like data science, artificial intelligence, and cybersecurity (edX press release).
- In March 2024, Coursera, another major player in the online education sector, announced a strategic collaboration with Google to offer free access to select courses for Google employees. This move aimed to upskill and reskill the workforce in response to the evolving tech landscape (Coursera press release).
- In May 2025, Udemy, an e-learning platform, secured a USD 100 million funding round led by Insight Partners. The funds would be used to expand its offerings in the alternative non-credential courses market and enhance its technology platform (Udemy press release).
- In the same month, the European Union passed the Digital Skills and Jobs Coalition Action Plan 2025. The plan included a significant investment in alternative non-credential courses to address the digital skills gap and promote lifelong learning among EU citizens (European Commission press release).
Dive into Technavio's robust research methodology, blending expert interviews, extensive data synthesis, and validated models for unparalleled Alternative Non Credential Courses Market insights. See full methodology.
|
Market Scope |
|
|
Report Coverage |
Details |
|
Page number |
175 |
|
Base year |
2024 |
|
Historic period |
2019-2023 |
|
Forecast period |
2025-2029 |
|
Growth momentum & CAGR |
Accelerate at a CAGR of 26.3% |
|
Market growth 2025-2029 |
USD 21782.4 million |
|
Market structure |
Fragmented |
|
YoY growth 2024-2025(%) |
20.5 |
|
Key countries |
US, Canada, Germany, China, UK, France, India, Italy, Brazil, and Japan |
|
Competitive landscape |
Leading Companies, Market Positioning of Companies, Competitive Strategies, and Industry Risks |
Research Analyst Overview
- The alternative non-credential courses market continues to evolve, with a focus on enhancing learner experience and outcomes through innovative technologies and approaches. One significant trend is the integration of elearning content authoring tools, enabling the creation of customized, interactive learning experiences. Learning analytics dashboards provide valuable insights into student progress, helping instructors tailor instruction and improve knowledge retention. Project-based learning and competency frameworks are gaining traction, as they allow learners to develop practical skills and demonstrate mastery. Learning outcome mapping ensures that instruction is aligned with desired outcomes, while mobile learning accessibility ensures that education is accessible anytime, anywhere.
- Skill assessment tools and gamified learning design engage learners and provide valuable feedback, while blended learning models combine the best of traditional and online instruction. Instructor training resources and technical support channels ensure that educators are equipped to deliver effective online courses. Self-paced learning modules offer flexibility, while certificate issuance systems provide recognition for completed courses. Professional development programs and MOOC completion rates highlight the growing importance of continuous learning. Online learning platforms, learner engagement strategies, peer-to-peer learning, and course evaluation methods are all essential components of a robust alternative non-credential courses market. Adaptive learning technologies and personalized learning paths cater to individual learners' needs, while collaborative learning tools and virtual classroom features foster a sense of community.
- Data-driven instruction and assessment rubrics ensure that instruction is effective and that learners are making progress. Career services integration provides learners with valuable resources to help them apply their new skills in the workforce. Overall, the alternative non-credential courses market is dynamic and evolving, with a focus on providing effective, engaging, and accessible learning experiences.
What are the Key Data Covered in this Alternative Non Credential Courses Market Research and Growth Report?
-
What is the expected growth of the Alternative Non Credential Courses Market between 2025 and 2029?
-
USD 21.78 billion, at a CAGR of 26.3%
-
-
What segmentation does the market report cover?
-
The report segmented by Type (Non-institutional and Institutional), Geography (North America, Europe, APAC, South America, and Middle East and Africa), Deliver Mode (Online, Hybrid, and In-Person), Application Type (Professional Development, Skill-Based Training, Personal Enrichment, and Career Transition), and End-User (Working Professionals, Students, Job Seekers, and Corporates)
-
-
Which regions are analyzed in the report?
-
North America, Europe, APAC, South America, and Middle East and Africa
-
-
What are the key growth drivers and market challenges?
-
Growing prominence of alternative non credentialing through m-learning, Inadequate cybersecurity measures
-
-
Who are the major players in the Alternative Non Credential Courses Market?
-
Key Companies Blue Mountain Community College, Boston University, Colorado State University, Columbia University, Harvard University, Michigan Technological University, Montgomery College, New York Institute of Finance Inc., New York University, Southern New Hampshire University, Stanford University, Temple University, Tennessee Tech, University of Arkansas, University of Cape Town, University of Illinois, University of Pennsylvania, University of Southern Indiana, University System of New Hampshire, and Yale University
-
Market Research Insights
- The alternative non-credential courses market encompasses a range of offerings, including continuing education, reskilling programs, and upskilling initiatives. According to recent industry data, the market for non-credit courses and certificate programs is projected to grow at a significant rate, with an estimated 10 million learners expected to enroll in online workshops and elearning courses by 2025. This expansion is driven by the increasing demand for flexible, accessible learning solutions that cater to the evolving needs of professionals. Course design principles, such as competency-based learning and learner satisfaction, play a crucial role in the success of these programs. For instance, a study on learning effectiveness found that competency-based courses led to a 15% higher completion rate compared to traditional credit-based courses.
- Moreover, the integration of educational technology, pedagogical approaches, and assessment strategies has facilitated the delivery of high-quality, engaging learning experiences. Digital badges and certificate programs serve as valuable recognition tools, enhancing the learner's professional development and knowledge transfer. With continuous improvements in learning platforms and content curation strategies, the market for alternative non-credential courses is poised to deliver effective and accessible learning opportunities for professionals seeking to upskill and reskill in today's dynamic business landscape.
We can help! Our analysts can customize this alternative non credential courses market research report to meet your requirements.
 RIA -
RIA - 
