
Alumni Management Software Market Size 2025-2029
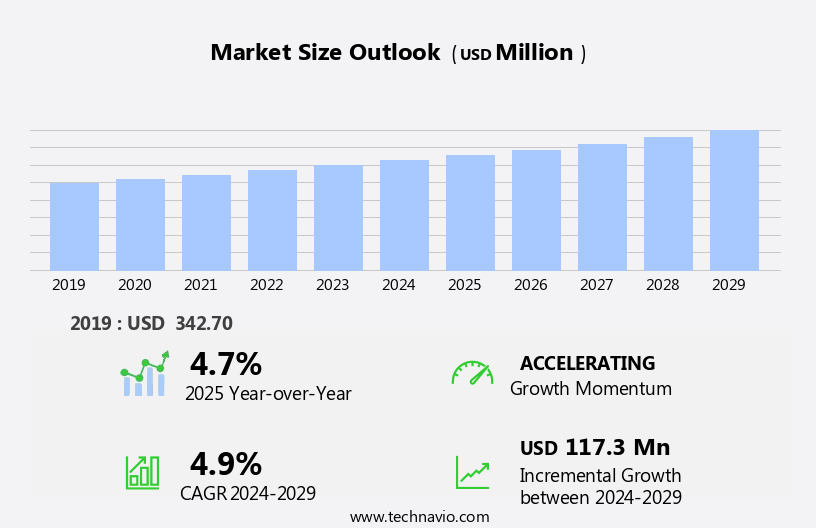
The alumni management software market size is forecast to increase by USD 117.3 million at a CAGR of 4.9% between 2024 and 2029.
- The market is witnessing significant growth due to the increasing demand for efficient alumni network programs. This trend is driven by the need for universities and educational institutions to maintain strong relationships with their alumni base. Additionally, the integration of alumni management software with Customer Relationship Management (CRM) systems is becoming increasingly popular, enabling institutions to manage alumni data and engagement more effectively. Furthermore, the availability of open-source alumni software is providing cost-effective solutions for institutions with limited budgets. These factors are expected to drive market growth In the coming years. The market analysis report provides a comprehensive study of these trends and other key factors shaping the growth of the market.
- Analytics tools provide insights into alumni preferences and trends, enhancing overall engagement. With mobility and mobile accessibility, alumni can connect via cellphones and mobile apps, expanding reach and convenience. Overall, the market for alumni management software continues to grow, driven by the need for effective communication, strong alumni networks, and data-driven strategies.
What will be the Size of the Market During the Forecast Period?
- The market caters to educational institutions seeking to streamline alumni engagement and fundraising initiatives. These systems offer networking opportunities and foster a sense of community among alumni. Integration of technology expedites procedures, enabling reliable records management and real-time updates. Alumni management systems serve as essential tools for donor administration, donor relations management, donation tracking, analytics management, and event planning. Universities benefit from data management capabilities, ensuring accurate and accessible alumni information.
How is this Alumni Management Software Industry segmented and which is the largest segment?
The alumni management software industry research report provides comprehensive data (region-wise segment analysis), with forecasts and estimates in "USD million" for the period 2025-2029, as well as historical data from 2019-2023 for the following segments.
- Deployment
- Cloud-based
- On-premises
- End-user
- Universities
- Schools and colleges
- Educational foundations
- Geography
- North America
- Canada
- US
- Europe
- Germany
- UK
- France
- Italy
- APAC
- China
- India
- Japan
- South America
- Brazil
- Middle East and Africa
- North America
By Deployment Insights
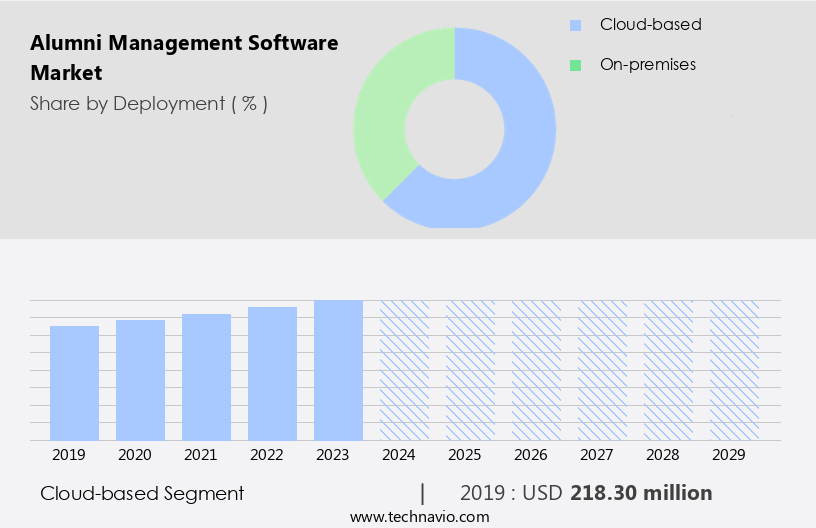
- The cloud-based segment is estimated to witness significant growth during the forecast period.
The market is experiencing significant growth due to the increasing adoption of cloud-based solutions. Cloud deployment offers several advantages, including cost savings from reduced hardware and software requirements, easy accessibility from remote locations, and decreased upgrading and maintenance costs compared to traditional on-premises systems. Institutions and end-users worldwide recognize the benefits of on-demand deployment models, leading to increased demand for cloud-based alumni management systems. Key features of these systems include networking opportunities, fundraising initiatives, data management, donor administration, analytics management, and mobility. Cloud-based solutions enable stronger alumni networks through event management, updates, and personalization. Integration of technology expedites procedures and provides analytics tools for alumni involvement and preferences.
Get a glance at the market report of share of various segments Request Free Sample
The cloud-based segment was valued at USD 218.30 million in 2019 and showed a gradual increase during the forecast period.
Regional Analysis
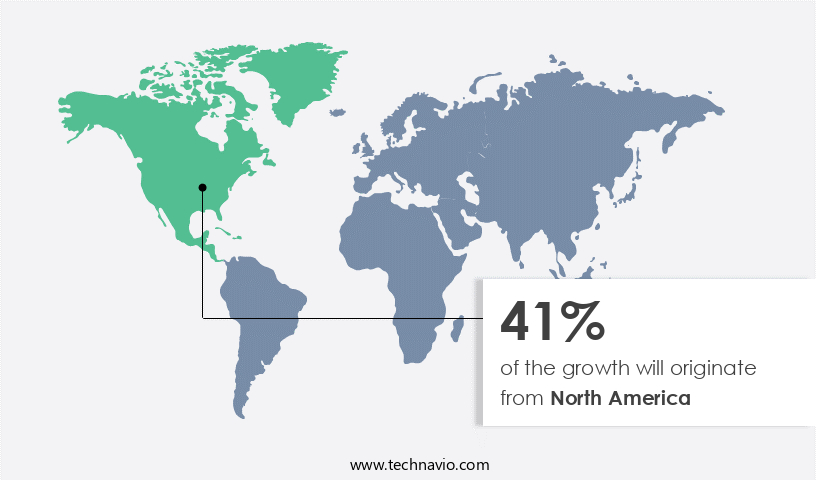
- North America is estimated to contribute 41% to the growth of the global market during the forecast period.
Technavio's analysts have elaborately explained the regional trends and drivers that shape the market during the forecast period.
For more insights on the market size of various regions, Request Free Sample
Alumni management software is a crucial solution for educational institutions to effectively engage, manage, and maintain strong relationships with their alumni networks. These systems offer various functionalities such as donor administration, fundraising, donor relations management, donation tracking, analytics management, and event management. The integration of technology expedites procedures, enabling personalized communication, mobility, and social media integration. A strong alumni network provides numerous benefits, including networking opportunities, feeling of community, and favorable reputation. However, challenges exist, including customization, licensing fees, training, continuing maintenance expenses, opposition to change, and integration difficulties. Despite these restraints, the adoption of alumni management software offers a competitive advantage through reliable records, data management, analytics tools, and alumni involvement preferences.
Market Dynamics
Our researchers analyzed the data with 2024 as the base year, along with the key drivers, trends, and challenges. A holistic analysis of drivers will help companies refine their marketing strategies to gain a competitive advantage.
What are the key market drivers leading to the rise In the adoption of Alumni Management Software Industry?
Rise in demand for efficient alumni network program is the key driver of the market.
- Alumni management software plays a vital role in facilitating events for large alumni groups in educational institutions. Efficiently managing alumni meetings is crucial for institutions to foster a strong network and maintain reliable records of alumni information. The collection of accurate and comprehensive alumni data is essential for building and expanding the network, which is vital for student success and future philanthropy initiatives. The integration of technology into alumni management systems offers numerous advantages, such as expediting procedures, personalisation, mobility, and social media integration. Alumni management software solutions enable the administration of donor relations management, donation tracking, analytics management, and fundraising, providing institutions with valuable insights and tools for engagement.
- However, implementing alumni management software comes with challenges. Customisation, licensing fees, training, and continuing maintenance expenses can pose restraints for smaller organisations with limited IT infrastructure and technical resources. Additionally, opposition to change, slow adoption rates, integration difficulties, and data security concerns can hinder the implementation process. Despite these challenges, the advantages of competitive advantage, favourable reputation, and improved alumni involvement through personalised communication and mobile accessibility make alumni management software a valuable investment for educational institutions.
What are the market trends shaping the Alumni Management Software Industry?
Rise in the integration of alumni management software with CRM is the upcoming market trend.
- Alumni management software plays a crucial role in enabling educational institutions to effectively manage and engage with their alumni networks. The integration of CRM software into alumni management systems has become increasingly popular, offering numerous benefits. This integration streamlines procedures, providing a comprehensive view of student interactions from recruitment to alumni relations. Notifications for alumni events are disseminated via emails and text messages, allowing for personalized communication and increased engagement. Moreover, the integration of CRM enhances donor administration and donor relations management, facilitating long-term cultivation of relationships with supporters. Personalized recruiting campaigns and advanced fundraising strategies are made possible through the integration, resulting in increased alumni involvement and improved data management.
- Alumni management software solutions offer analytics tools to help educational institutions gain valuable insights from their alumni data, ensuring reliable records and privacy law compliance. The advantages of this technology include mobility, with mobile apps and social media integration, enabling easy access to information and promotion of events. However, challenges such as customization, licensing fees, training, and continuing maintenance expenses, as well as opposition to change and integration difficulties, may hinder the adoption of these systems. Despite these challenges, the benefits of a strong alumni network and favorable reputation make the investment in alumni management software a valuable one.
What challenges does the Alumni Management Software Industry face during its growth?
Availability of open-source alumni software is a key challenge affecting the industry growth.
- The market faces challenges from open-source solutions, which are gaining popularity among small-scale educational institutions and alumni associations. These solutions offer several advantages, including mobility, customization possibilities, and lower costs. They can be easily integrated with social media platforms, enabling the sharing of information and promotion of events. Open-source solutions also allow for personalization, scalability, and data security, ensuring compliance with privacy laws.
- However, these systems may lack the advanced analytics tools and donor administration features found in commercial software. Additionally, they may require significant technical resources for implementation and maintenance. Despite these challenges, open-source solutions are becoming increasingly attractive to organizations with limited budgets and expertise. This trend is reducing revenue growth In the market.
Exclusive Customer Landscape
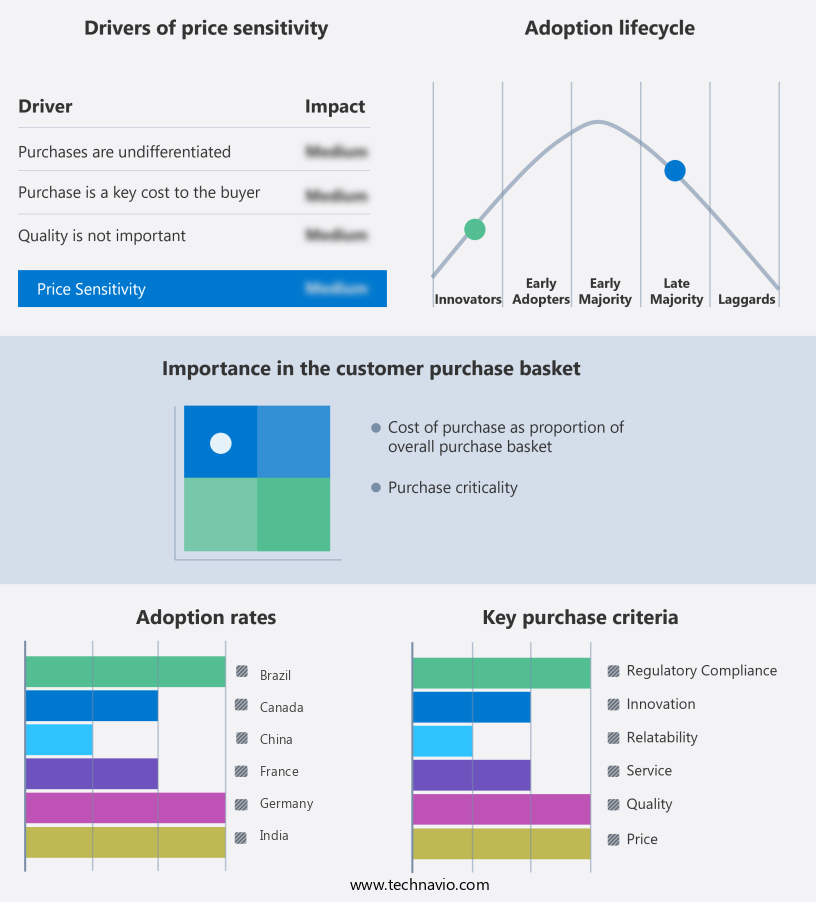
The market forecasting report includes the adoption lifecycle of the market, covering from the innovator's stage to the laggard's stage. It focuses on adoption rates in different regions based on penetration. Furthermore, the market report also includes key purchase criteria and drivers of price sensitivity to help companies evaluate and develop their market growth analysis strategies.
Customer Landscape
Key Companies & Market Insights
Companies are implementing various strategies, such as strategic alliances, market forecast, partnerships, mergers and acquisitions, geographical expansion, and product/service launches, to enhance their presence In the industry.
Almabase Inc. - The company offers alumni management software namely Almabase.
The industry research and growth report includes detailed analyses of the competitive landscape of the market and information about key companies, including:
- 360Alumni
- Almashines Technologies Pvt. Ltd.
- Anthology Inc.
- Anubavam Technologies Pvt. Ltd.
- Blackbaud Inc.
- Coherendz India Pvt. Ltd.
- Ellucian Co.
- EverTrue Inc.
- Fonteva LLC
- Hivebrite
- Insala Inc.
- OmniMagnet LLC
- PeopleGrove Inc.
- PeoplePath GmbH
- Raklet Inc.
- Regpack Inc.
- Saviance
- TrueDialog Inc.
- WildApricot Inc.
Qualitative and quantitative analysis of companies has been conducted to help clients understand the wider business environment as well as the strengths and weaknesses of key industry players. Data is qualitatively analyzed to categorize companies as pure play, category-focused, industry-focused, and diversified; it is quantitatively analyzed to categorize companies as dominant, leading, strong, tentative, and weak.
Research Analyst Overview
The market caters to the needs of educational institutions in effectively managing and engaging with their alumni communities. These software solutions offer numerous benefits, including expediting procedures, facilitating fundraising initiatives, and providing networking opportunities that foster a sense of community. The integration of technology into alumni management systems has revolutionized the way educational institutions manage alumni data and communication. With analytics management tools, universities can gain valuable insights into alumni preferences and trends, enabling them to tailor their engagement strategies and improve overall alumni involvement. The mobility aspect of these software solutions is a significant advantage, with mobile accessibility through cellphones and mobile apps becoming increasingly popular.
In addition, social media integration is another essential feature, allowing for the sharing of information and promotion of events on various social media platforms. Personalization is a crucial element of successful alumni management. Software solutions offer customization possibilities, enabling educational institutions to cater to the unique needs and preferences of their alumni communities. Scalability is also essential, allowing institutions to expand their alumni networks and accommodate growing data requirements. Data security and privacy law compliance are essential considerations In the market. Ensuring the security and protection of private alumni data is vital for maintaining a favorable reputation and avoiding potential legal issues.
Despite the advantages of these software solutions, there are challenges and restraints to their widespread adoption. Customization can be complex, requiring significant technological knowledge and resources. Licensing fees and continuing maintenance expenses can also be prohibitive for smaller organizations with limited IT infrastructure and budgets. Opposition to change and slow adoption rates can also pose challenges. Integration difficulties with current systems and databases, software compatibility issues, and data migration concerns can make the implementation process lengthy and complex. Privacy issues, including data protection laws and communication protocols, must also be addressed to ensure the smooth functioning of these systems.
Therefore, the market offers educational institutions a powerful tool for managing and engaging with their alumni communities. With features such as analytics management, mobility, social media integration, and personalization, these software solutions enable institutions to build strong alumni networks, facilitate fundraising initiatives, and foster a sense of community. However, challenges such as customization complexities, licensing fees, and privacy concerns must be addressed to ensure successful implementation and adoption.
|
Market Scope |
|
|
Report Coverage |
Details |
|
Page number |
192 |
|
Base year |
2024 |
|
Historic period |
2019-2023 |
|
Forecast period |
2025-2029 |
|
Growth momentum & CAGR |
Accelerate at a CAGR of 4.9% |
|
Market growth 2025-2029 |
USD 117.3 million |
|
Market structure |
Fragmented |
|
YoY growth 2024-2025(%) |
4.7 |
|
Key countries |
US, China, Germany, UK, Canada, Japan, France, India, Italy, and Brazil |
|
Competitive landscape |
Leading Companies, market growth and forecasting, Market Positioning of Companies, Competitive Strategies, and Industry Risks |
What are the Key Data Covered in this Market Research and Growth Report?
- CAGR of the Alumni Management Software industry during the forecast period
- Detailed information on factors that will drive the growth and forecasting between 2025 and 2029
- Precise estimation of the size of the market and its contribution of the industry in focus to the parent market
- Accurate predictions about upcoming growth and trends and changes in consumer behaviour
- Growth of the market across North America, Europe, APAC, South America, and Middle East and Africa
- Thorough analysis of the market's competitive landscape and detailed information about companies
- Comprehensive analysis of factors that will challenge the market growth of industry companies
We can help! Our analysts can customize this market research report to meet your requirements.
 RIA -
RIA - 
