Analytics As A Service (AAAS) Market Analysis, Size, and Forecast 2025-2029: North America (US and Canada), Europe (France, Germany, Italy, UK), APAC (China, India, Japan, South Korea), Middle East and Africa , and South America

Analytics As A Service (AAAS) Market Analysis, Size, and Forecast 2025-2029:
North America (US and Canada), Europe (France, Germany, Italy, UK), APAC (China, India, Japan, South Korea), Middle East and Africa , and South America

Published: Mar 2025 223 Pages SKU: IRTNTR76066

Market Overview at a Glance

$59.36 B
Market Opportunity
25.9%
CAGR
22.9
YoY growth 2024-2025(%)

Analytics As A Service (AAAS) Market Size 2025-2029

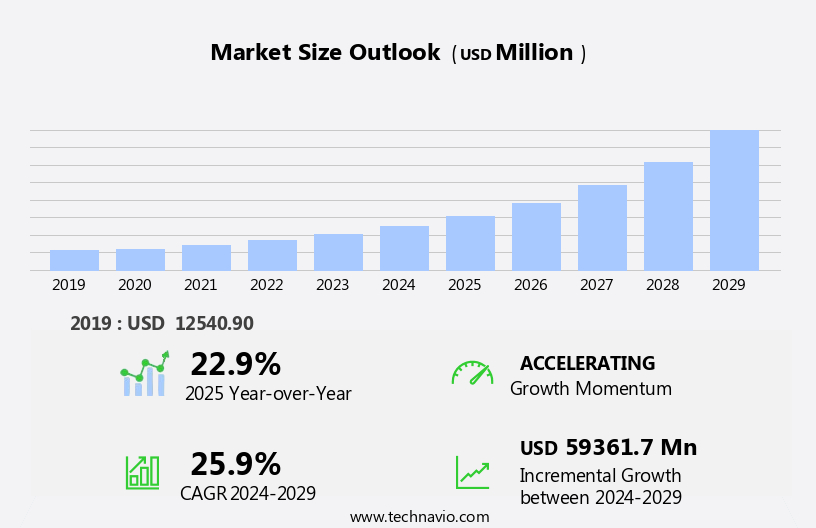
The analytics as a service (AAAS) market size is forecast to increase by USD 59.36 billion at a CAGR of 25.9% between 2024 and 2029.

  • The market is experiencing significant growth, driven by the increasing availability and complexity of data. With the proliferation of Internet of Things (IoT) devices in enterprises, there is a wave in the need for real-time data analysis and insights. However, this trend comes with challenges, particularly around data privacy and security. As businesses continue to collect and store vast amounts of sensitive information, ensuring its protection becomes a top priority. Despite these concerns, the market presents substantial opportunities for companies that can provide strong, secure, and scalable analytics solutions. Additionally, the rising use of Internet of Things (IoT) analytics in enterprises is contributing to market expansion. However, data privacy and security concerns remain a challenge for AaaS providers, necessitating strong security measures to protect sensitive information.
  • By offering actionable insights and enabling data-driven decision-making, AAAS providers can help organizations optimize their operations, improve customer experiences, and gain a competitive edge. To capitalize on this market potential, businesses must navigate the evolving regulatory landscape and invest in advanced analytics technologies to meet the growing demands for data security and privacy.

What will be the Size of the Analytics As A Service (AAAS) Market during the forecast period?

Analytics As A Service (AAAS) Market Size

 Request Free Sample

  • The market continues to experience strong growth, fueled by the increasing demand for advanced analytic techniques to derive insights from vast volumes of data generated by IoT devices and digital transformation initiatives. Big data and real-time analytics are key drivers, enabling businesses to make data-driven decisions in an agile and efficient manner. SAS analytics, artificial intelligence, and machine learning are integral components of AAAS offerings, providing advanced capabilities for data connectivity, data integration, and data reporting. Multi-cloud environments and data democratization are shaping the market, allowing organizations to leverage various cloud platforms and making data accessible to a broader user base.
  • Generative AI and data privacy are emerging trends, offering new opportunities for enhanced data accuracy, reporting, and compliance capabilities. Despite these advancements, data integration complexities remain a challenge, requiring strong encryption and compliance capabilities to ensure data security. Overall, the AAAS market is poised for continued expansion, driven by the need for advanced analytics to make sense of the ever-growing data landscape. Big data from IoT devices and artificial intelligence (AI) and machine learning (ML) technologies are key drivers, requiring advanced query accelerators and data connectivity to multi-cloud environments

How is this Analytics As A Service (AAAS) Industry segmented?

The analytics as a service (AAAS) industry research report provides comprehensive data (region-wise segment analysis), with forecasts and estimates in "USD million" for the period 2025-2029, as well as historical data from 2019-2023 for the following segments.

  • Type
    • Predictive analytics
    • Prescriptive analytics
    • Diagnostic analytics
    • Descriptive analytics
  • End-user
    • BSFI
    • Manufacturing
    • Retail
    • Healthcare
    • Others
  • Consumer
    • Large enterprise
    • SMEs
  • Geography
    • North America
      • US
      • Canada
    • Europe
      • France
      • Germany
      • Italy
      • UK
    • APAC
      • China
      • India
      • Japan
      • South Korea
    • Middle East and Africa
    • South America

By Type Insights

The predictive analytics segment is estimated to witness significant growth during the forecast period. Predictive analytics is a specialized field of analytics that utilizes advanced artificial intelligence (AI) and machine learning techniques to make future predictions and assessments based on historical data. The adoption of predictive analytics is expanding across various industries, including finance, retail, healthcare, and manufacturing, leading to a growing demand for these solutions. Enterprises worldwide are implementing advanced analytics to enhance operational efficiency, mitigate risks, improve customer engagement, and optimize processes. The proliferation of cloud computing and AI technologies is further fueling the growth of predictive analytics. With the increasing volumes of data from multiple sources such as IoT devices, social media, and transactional systems, the need for scalable and real-time analytics solutions is becoming crucial for businesses to generate valuable insights and make data-driven decisions.

Predictive analytics capabilities, including advanced query accelerator, predictive tools, and data integration, are essential for businesses to gain a competitive edge and identify new opportunities. Additionally, data security, system integration, and performance metrics are critical considerations for organizations implementing predictive analytics solutions.

Analytics As A Service (AAAS) Market Size

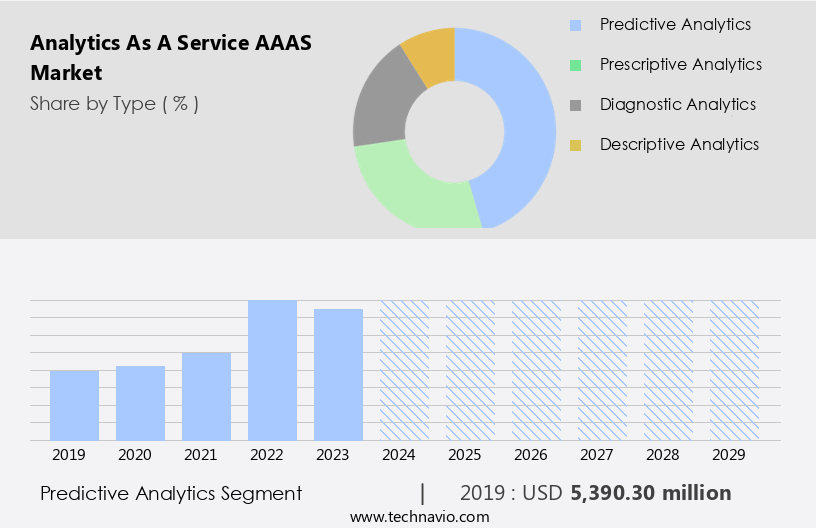
Get a glance at the market report of share of various segments Request Free Sample

The Predictive analytics segment was valued at USD 5.39 billion in 2019 and showed a gradual increase during the forecast period.

Regional Analysis

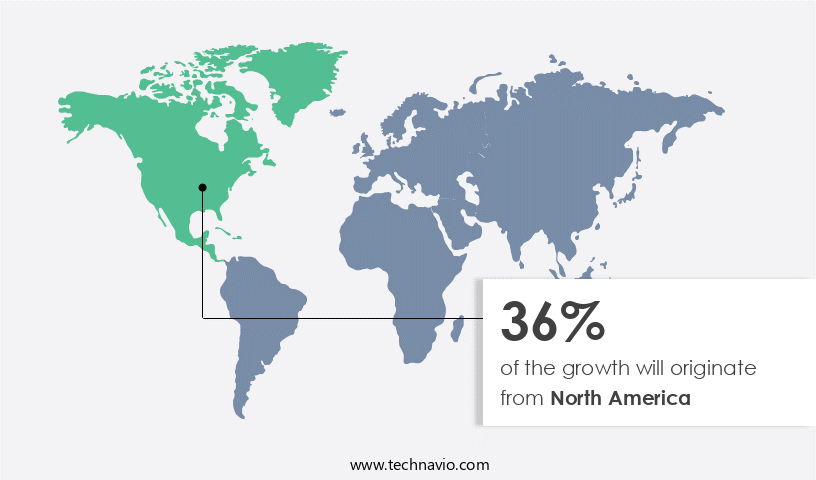
North America is estimated to contribute 36% to the growth of the global market during the forecast period. Technavio's analysts have elaborately explained the regional trends and drivers that shape the market during the forecast period.

Analytics As A Service (AAAS) Market Share by Geography

For more insights on the market size of various regions, Request Free Sample

Advanced Analytics as a Service (AAAS) is a cloud-based business solution that enables organizations to process and analyze large volumes of data in real time, using advanced query accelerator, AI, ML, and other advanced analytic techniques. The North American market, known for its high adoption rate of advanced technologies, is a significant contributor to the AAAS industry's growth. The retail sector's flourishing condition, the healthcare sector's expansion, and increasing manufacturing output are driving the adoption of AAAS solutions in the region. The healthcare sector is poised for strong growth due to the adoption of advanced medical devices by healthcare systems and compliance with regulations like the Affordable Care Act (ACA).

Market Dynamics

Our researchers analyzed the data with 2024 as the base year, along with the key drivers, trends, and challenges. A holistic analysis of drivers will help companies refine their marketing strategies to gain a competitive advantage.

What are the key market drivers leading to the rise in the adoption of Analytics As A Service (AAAS) Industry?

  • Growing availability and complexity of data is the key driver of the market. The increasing volume and complexity of data in organizations are primary drivers fueling the adoption of analytics as a service (AAAS). Advanced techniques, such as machine learning (ML) and artificial intelligence (AI), enable companies to extract valuable insights from vast amounts of data, enhancing their services and business processes. From an enterprise standpoint, a significant amount of data remains untapped in their repositories due to the challenge of locating and utilizing it effectively. AAAS addresses this issue by providing intelligent data analysis solutions, unlocking valuable insights hidden within the data, and enabling businesses to make informed decisions.
  • AAAS solutions offer benefits such as data democratization, data quality, decision making, operational efficiency, and business opportunities across various industries, including life sciences and retail. These solutions provide scalable, upfront investment-friendly, multi-cloud, and real-time analytics capabilities, addressing the challenges of data integration complexities and exponential increasing data from multiple sources, such as IoT devices, social media, transactional systems, and advanced analytics capabilities. Additionally, AAAS solutions offer data security, system integration, performance metrics, and digital services, making them an essential tool for large enterprises, financial institutions, and other organizations seeking to optimize processes, reduce risk, and generate business insights.

What are the market trends shaping the Analytics As A Service (AAAS) Industry?

  • Rising use of IoT analytics in enterprises is the upcoming market trend.  IoT analytics is a technology-driven solution that utilizes RFID, sensors, barcodes, GPS, and other technologies to monitor and manage an organization's physical assets. RFID tags, for instance, enable efficient tracking in the supply chain, particularly in the retail industry, and aid in inventory management. IoT analytics interconnects every device or asset within an organization, leading to improved business processes. Enterprises have experienced significant enhancements in their operations due to IoT analytics, as it facilitates real-time monitoring and decision-making, ensuring more effective control over business processes.
  • The life sciences industry, for instance, generates vast amounts of complex data, requiring advanced analytics capabilities to ensure data quality and enable data democratization. The retail sector, on the other hand, benefits from predictive analytics to optimize inventory management, personalize customer experiences, and improve operational efficiency. The financial services industry leverages AAAS to manage credit and operational risk, while the manufacturing sector uses predictive tools to optimize production processes and improve overall performance. The adoption of cloud platforms has been a significant factor in the growth of the AAAS market. Multi-cloud solutions offer scalability, flexibility, and cost savings, making it easier for organizations to deploy analytics capabilities and generate business insights in real-time.

What challenges does the Analytics As A Service (AAAS) Industry face during its growth?

  • Data privacy and security concerns is a key challenge affecting the industry growth. Data privacy and security concerns represent significant challenges for organizations as the number of connected devices and data-sharing increases. The Internet of Things (IoT) and cloud networks, in particular, necessitate a highly secure environment to prevent unauthorized access and data breaches. With the rise of IoT, the number of devices involved poses unique challenges, as inadequate security can lead to data theft. The transfer of critical data through these networks necessitates strong security measures to ensure data confidentiality, integrity, and availability. The increasing interconnectedness and data-sharing have resulted in a growing number of cybersecurity issues and data breaches. Historically, cybersecurity focused on securing a limited number of connected devices; however, the current landscape requires a more comprehensive approach to address these challenges.
  • The market is also witnessing the emergence of generative AI and automation tools, which can further enhance the capabilities of AAAS platforms and enable more accurate and actionable insights. AAAS market offers significant opportunities for businesses to gain a competitive edge by leveraging advanced analytics capabilities to derive valuable insights from their data. The challenges of data integration complexities, data security, and upfront investment can be addressed through strategic planning and the adoption of scalable, cloud-based solutions. The future of AAAS lies in the continued innovation of AI and ML technologies and the ability to provide real-time insights to support data-driven decision-making.

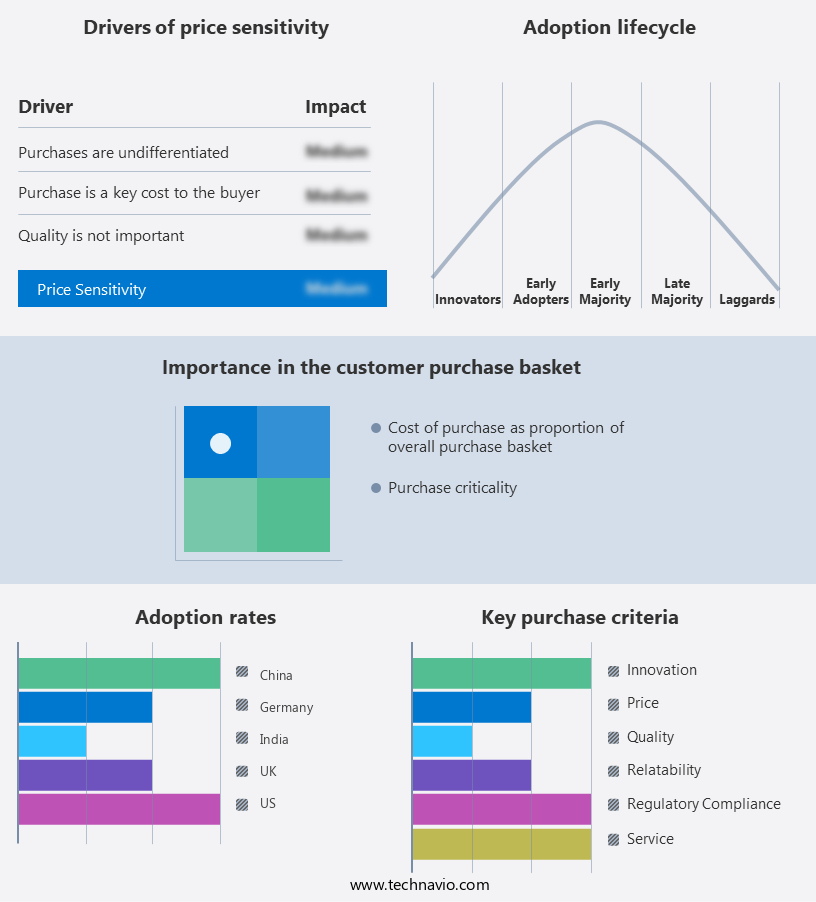
Exclusive Customer Landscape

The analytics as a service (AAAS) market forecasting report includes the adoption lifecycle of the market, covering from the innovator's stage to the laggard's stage. It focuses on adoption rates in different regions based on penetration. Furthermore, the analytics as a service (AAAS) market report also includes key purchase criteria and drivers of price sensitivity to help companies evaluate and develop their market growth analysis strategies.

Analytics As A Service (AAAS) Market Share by Geography

 Customer Landscape

Key Companies & Market Insights

Companies are implementing various strategies, such as strategic alliances, analytics as a service (AAAS) market forecast, partnerships, mergers and acquisitions, geographical expansion, and product/service launches, to enhance their presence in the industry.

Accenture PLC - This company delivers analytics-as-a-service, including customized managed analytics, to enable businesses in upgrading antiquated systems and reaping the rewards of data-driven models.

The industry research and growth report includes detailed analyses of the competitive landscape of the market and information about key companies, including:

  • Accenture PLC
  • Alteryx Inc.
  • Amazon.com Inc.
  • Atos SE
  • Cloudera Inc.
  • Google LLC
  • Hewlett Packard Enterprise Co.
  • Hitachi Ltd.
  • Infor Inc.
  • International Business Machines Corp.
  • Microsoft Corp.
  • MicroStrategy Inc.
  • Oracle Corp.
  • QlikTech international AB
  • Salesforce Inc.
  • SAP SE
  • SAS Institute Inc.
  • Sisense Ltd.
  • Thales Group
  • TIBCO Software Inc.

Qualitative and quantitative analysis of companies has been conducted to help clients understand the wider business environment as well as the strengths and weaknesses of key industry players. Data is qualitatively analyzed to categorize companies as pure play, category-focused, industry-focused, and diversified; it is quantitatively analyzed to categorize companies as dominant, leading, strong, tentative, and weak.

Research Analyst Overview

The market continues to experience significant growth as businesses increasingly rely on data-driven insights to optimize operations, identify business opportunities, and make informed decisions. This trend is driven by the exponential increase in data volumes from various sources, including IoT devices, transactional systems, social media, and big data. Advanced analytic techniques, such as machine learning (ML) and artificial intelligence (AI), play a crucial role in deriving valuable insights from this data. These technologies enable real-time analytics, data accuracy, and data reporting, allowing organizations to respond quickly to market trends and customer needs. The AAAS market caters to various industries, including healthcare and retail, where specialized expertise and strong encryption and compliance capabilities are essential.

Despite the benefits, the integration of data from multiple sources and the complexity of data volumes pose challenges for organizations. Data integration complexities require advanced tools and expertise to ensure data accuracy and consistency. Moreover, data security and compliance capabilities are essential to protect sensitive data and maintain regulatory compliance. The upfront investment required for IT infrastructure and software delivery can be a barrier to entry for some organizations. However, the strategic planning and optimization of processes enabled by AAAS can lead to significant cost savings and operational efficiency in the long run. The AAAS market is expected to grow at a compound annual rate, driven by the increasing demand for data-driven decisions and the need for scalable solutions to manage the growing data volumes.

Market Scope

Report Coverage

Details

Page number

223

Base year

2024

Historic period

2019-2023

Forecast period

2025-2029

Growth momentum & CAGR

Accelerate at a CAGR of 25.9%

Market growth 2025-2029

USD 59.36 billion

Market structure

Fragmented

YoY growth 2024-2025(%)

22.9

Key countries

US, Canada, China, UK, Japan, Germany, India, France, Italy, and South Korea

Competitive landscape

Leading Companies, Market Positioning of Companies, Competitive Strategies, and Industry Risks

Request Free Sample

What are the Key Data Covered in this Analytics As A Service (AAAS) Market Research and Growth Report?

  • CAGR of the Analytics As A Service (AAAS) industry during the forecast period
  • Detailed information on factors that will drive the growth and forecasting between 2025 and 2029
  • Precise estimation of the size of the market and its contribution of the industry in focus to the parent market
  • Accurate predictions about upcoming growth and trends and changes in consumer behaviour
  • Growth of the market across North America, Europe, APAC, Middle East and Africa, and South America
  • Thorough analysis of the market's competitive landscape and detailed information about companies
  • Comprehensive analysis of factors that will challenge the analytics as a service (AAAS) market growth of industry companies

We can help! Our analysts can customize this analytics as a service (AAAS) market research report to meet your requirements.

Get in touch

1 Executive Summary

  • 1.1 Market overview
    • Executive Summary - Chart on Market Overview
    • Executive Summary - Data Table on Market Overview
    • Executive Summary - Chart on Global Market Characteristics
    • Executive Summary - Chart on Market by Geography
    • Executive Summary - Chart on Market Segmentation by Type
    • Executive Summary - Chart on Market Segmentation by End-user
    • Executive Summary - Chart on Market Segmentation by Consumer
    • Executive Summary - Chart on Incremental Growth
    • Executive Summary - Data Table on Incremental Growth
    • Executive Summary - Chart on Company Market Positioning

2 Technavio Analysis

  • 2.1 Analysis of price sensitivity, lifecycle, customer purchase basket, adoption rates, and purchase criteria
    • Analysis of price sensitivity, lifecycle, customer purchase basket, adoption rates, and purchase criteria
  • 2.2 Criticality of inputs and Factors of differentiation
    • Overview on criticality of inputs and factors of differentiation
  • 2.3 Factors of disruption
    • Overview on factors of disruption
  • 2.4 Impact of drivers and challenges
    • Impact of drivers and challenges in 2024 and 2029

3 Market Landscape

  • 3.1 Market ecosystem
    • Parent Market
    • Data Table on - Parent Market
  • 3.2 Market characteristics
    • Market characteristics analysis
  • 3.3 Value chain analysis
    • Value chain analysis

4 Market Sizing

  • 4.1 Market definition
    • Offerings of companies included in the market definition
  • 4.2 Market segment analysis
    • Market segments
  • 4.3 Market size 2024
    • 4.4 Market outlook: Forecast for 2024-2029
      • Chart on Global - Market size and forecast 2024-2029 ($ million)
      • Data Table on Global - Market size and forecast 2024-2029 ($ million)
      • Chart on Global Market: Year-over-year growth 2024-2029 (%)
      • Data Table on Global Market: Year-over-year growth 2024-2029 (%)

    5 Historic Market Size

    • 5.1 Global Analytics As A Service (AaaS) Market 2019 - 2023
      • Historic Market Size - Data Table on Global Analytics As A Service (AaaS) Market 2019 - 2023 ($ million)
    • 5.2 Type segment analysis 2019 - 2023
      • Historic Market Size - Type Segment 2019 - 2023 ($ million)
    • 5.3 End-user segment analysis 2019 - 2023
      • Historic Market Size - End-user Segment 2019 - 2023 ($ million)
    • 5.4 Consumer segment analysis 2019 - 2023
      • Historic Market Size - Consumer Segment 2019 - 2023 ($ million)
    • 5.5 Geography segment analysis 2019 - 2023
      • Historic Market Size - Geography Segment 2019 - 2023 ($ million)
    • 5.6 Country segment analysis 2019 - 2023
      • Historic Market Size - Country Segment 2019 - 2023 ($ million)

    6 Qualitative Analysis

    • 6.1 Impact of AI on global analytics as a service (AaaS) market

      7 Five Forces Analysis

      • 7.1 Five forces summary
        • Five forces analysis - Comparison between 2024 and 2029
      • 7.2 Bargaining power of buyers
        • Bargaining power of buyers - Impact of key factors 2024 and 2029
      • 7.3 Bargaining power of suppliers
        • Bargaining power of suppliers - Impact of key factors in 2024 and 2029
      • 7.4 Threat of new entrants
        • Threat of new entrants - Impact of key factors in 2024 and 2029
      • 7.5 Threat of substitutes
        • Threat of substitutes - Impact of key factors in 2024 and 2029
      • 7.6 Threat of rivalry
        • Threat of rivalry - Impact of key factors in 2024 and 2029
      • 7.7 Market condition
        • Chart on Market condition - Five forces 2024 and 2029

      8 Market Segmentation by Type

      • 8.1 Market segments
        • Chart on Type - Market share 2024-2029 (%)
        • Data Table on Type - Market share 2024-2029 (%)
      • 8.2 Comparison by Type
        • Chart on Comparison by Type
        • Data Table on Comparison by Type
      • 8.3 Predictive analytics - Market size and forecast 2024-2029
        • Chart on Predictive analytics - Market size and forecast 2024-2029 ($ million)
        • Data Table on Predictive analytics - Market size and forecast 2024-2029 ($ million)
        • Chart on Predictive analytics - Year-over-year growth 2024-2029 (%)
        • Data Table on Predictive analytics - Year-over-year growth 2024-2029 (%)
      • 8.4 Prescriptive analytics - Market size and forecast 2024-2029
        • Chart on Prescriptive analytics - Market size and forecast 2024-2029 ($ million)
        • Data Table on Prescriptive analytics - Market size and forecast 2024-2029 ($ million)
        • Chart on Prescriptive analytics - Year-over-year growth 2024-2029 (%)
        • Data Table on Prescriptive analytics - Year-over-year growth 2024-2029 (%)
      • 8.5 Diagnostic analytics - Market size and forecast 2024-2029
        • Chart on Diagnostic analytics - Market size and forecast 2024-2029 ($ million)
        • Data Table on Diagnostic analytics - Market size and forecast 2024-2029 ($ million)
        • Chart on Diagnostic analytics - Year-over-year growth 2024-2029 (%)
        • Data Table on Diagnostic analytics - Year-over-year growth 2024-2029 (%)
      • 8.6 Descriptive analytics - Market size and forecast 2024-2029
        • Chart on Descriptive analytics - Market size and forecast 2024-2029 ($ million)
        • Data Table on Descriptive analytics - Market size and forecast 2024-2029 ($ million)
        • Chart on Descriptive analytics - Year-over-year growth 2024-2029 (%)
        • Data Table on Descriptive analytics - Year-over-year growth 2024-2029 (%)
      • 8.7 Market opportunity by Type
        • Market opportunity by Type ($ million)
        • Data Table on Market opportunity by Type ($ million)

      9 Market Segmentation by End-user

      • 9.1 Market segments
        • Chart on End-user - Market share 2024-2029 (%)
        • Data Table on End-user - Market share 2024-2029 (%)
      • 9.2 Comparison by End-user
        • Chart on Comparison by End-user
        • Data Table on Comparison by End-user
      • 9.3 BSFI - Market size and forecast 2024-2029
        • Chart on BSFI - Market size and forecast 2024-2029 ($ million)
        • Data Table on BSFI - Market size and forecast 2024-2029 ($ million)
        • Chart on BSFI - Year-over-year growth 2024-2029 (%)
        • Data Table on BSFI - Year-over-year growth 2024-2029 (%)
      • 9.4 Manufacturing - Market size and forecast 2024-2029
        • Chart on Manufacturing - Market size and forecast 2024-2029 ($ million)
        • Data Table on Manufacturing - Market size and forecast 2024-2029 ($ million)
        • Chart on Manufacturing - Year-over-year growth 2024-2029 (%)
        • Data Table on Manufacturing - Year-over-year growth 2024-2029 (%)
      • 9.5 Retail - Market size and forecast 2024-2029
        • Chart on Retail - Market size and forecast 2024-2029 ($ million)
        • Data Table on Retail - Market size and forecast 2024-2029 ($ million)
        • Chart on Retail - Year-over-year growth 2024-2029 (%)
        • Data Table on Retail - Year-over-year growth 2024-2029 (%)
      • 9.6 Healthcare - Market size and forecast 2024-2029
        • Chart on Healthcare - Market size and forecast 2024-2029 ($ million)
        • Data Table on Healthcare - Market size and forecast 2024-2029 ($ million)
        • Chart on Healthcare - Year-over-year growth 2024-2029 (%)
        • Data Table on Healthcare - Year-over-year growth 2024-2029 (%)
      • 9.7 Others - Market size and forecast 2024-2029
        • Chart on Others - Market size and forecast 2024-2029 ($ million)
        • Data Table on Others - Market size and forecast 2024-2029 ($ million)
        • Chart on Others - Year-over-year growth 2024-2029 (%)
        • Data Table on Others - Year-over-year growth 2024-2029 (%)
      • 9.8 Market opportunity by End-user
        • Market opportunity by End-user ($ million)
        • Data Table on Market opportunity by End-user ($ million)

      10 Market Segmentation by Consumer

      • 10.1 Market segments
        • Chart on Consumer - Market share 2024-2029 (%)
        • Data Table on Consumer - Market share 2024-2029 (%)
      • 10.2 Comparison by Consumer
        • Chart on Comparison by Consumer
        • Data Table on Comparison by Consumer
      • 10.3 Large enterprise - Market size and forecast 2024-2029
        • Chart on Large enterprise - Market size and forecast 2024-2029 ($ million)
        • Data Table on Large enterprise - Market size and forecast 2024-2029 ($ million)
        • Chart on Large enterprise - Year-over-year growth 2024-2029 (%)
        • Data Table on Large enterprise - Year-over-year growth 2024-2029 (%)
      • 10.4 SMEs - Market size and forecast 2024-2029
        • Chart on SMEs - Market size and forecast 2024-2029 ($ million)
        • Data Table on SMEs - Market size and forecast 2024-2029 ($ million)
        • Chart on SMEs - Year-over-year growth 2024-2029 (%)
        • Data Table on SMEs - Year-over-year growth 2024-2029 (%)
      • 10.5 Market opportunity by Consumer
        • Market opportunity by Consumer ($ million)
        • Data Table on Market opportunity by Consumer ($ million)

      11 Customer Landscape

      • 11.1 Customer landscape overview
        • Analysis of price sensitivity, lifecycle, customer purchase basket, adoption rates, and purchase criteria

      12 Geographic Landscape

      • 12.1 Geographic segmentation
        • Chart on Market share by geography 2024-2029 (%)
        • Data Table on Market share by geography 2024-2029 (%)
      • 12.2 Geographic comparison
        • Chart on Geographic comparison
        • Data Table on Geographic comparison
      • 12.3 North America - Market size and forecast 2024-2029
        • Chart on North America - Market size and forecast 2024-2029 ($ million)
        • Data Table on North America - Market size and forecast 2024-2029 ($ million)
        • Chart on North America - Year-over-year growth 2024-2029 (%)
        • Data Table on North America - Year-over-year growth 2024-2029 (%)
      • 12.4 Europe - Market size and forecast 2024-2029
        • Chart on Europe - Market size and forecast 2024-2029 ($ million)
        • Data Table on Europe - Market size and forecast 2024-2029 ($ million)
        • Chart on Europe - Year-over-year growth 2024-2029 (%)
        • Data Table on Europe - Year-over-year growth 2024-2029 (%)
      • 12.5 APAC - Market size and forecast 2024-2029
        • Chart on APAC - Market size and forecast 2024-2029 ($ million)
        • Data Table on APAC - Market size and forecast 2024-2029 ($ million)
        • Chart on APAC - Year-over-year growth 2024-2029 (%)
        • Data Table on APAC - Year-over-year growth 2024-2029 (%)
      • 12.6 Middle East and Africa - Market size and forecast 2024-2029
        • Chart on Middle East and Africa - Market size and forecast 2024-2029 ($ million)
        • Data Table on Middle East and Africa - Market size and forecast 2024-2029 ($ million)
        • Chart on Middle East and Africa - Year-over-year growth 2024-2029 (%)
        • Data Table on Middle East and Africa - Year-over-year growth 2024-2029 (%)
      • 12.7 South America - Market size and forecast 2024-2029
        • Chart on South America - Market size and forecast 2024-2029 ($ million)
        • Data Table on South America - Market size and forecast 2024-2029 ($ million)
        • Chart on South America - Year-over-year growth 2024-2029 (%)
        • Data Table on South America - Year-over-year growth 2024-2029 (%)
      • 12.8 US - Market size and forecast 2024-2029
        • Chart on US - Market size and forecast 2024-2029 ($ million)
        • Data Table on US - Market size and forecast 2024-2029 ($ million)
        • Chart on US - Year-over-year growth 2024-2029 (%)
        • Data Table on US - Year-over-year growth 2024-2029 (%)
      • 12.9 China - Market size and forecast 2024-2029
        • Chart on China - Market size and forecast 2024-2029 ($ million)
        • Data Table on China - Market size and forecast 2024-2029 ($ million)
        • Chart on China - Year-over-year growth 2024-2029 (%)
        • Data Table on China - Year-over-year growth 2024-2029 (%)
      • 12.10 Canada - Market size and forecast 2024-2029
        • Chart on Canada - Market size and forecast 2024-2029 ($ million)
        • Data Table on Canada - Market size and forecast 2024-2029 ($ million)
        • Chart on Canada - Year-over-year growth 2024-2029 (%)
        • Data Table on Canada - Year-over-year growth 2024-2029 (%)
      • 12.11 UK - Market size and forecast 2024-2029
        • Chart on UK - Market size and forecast 2024-2029 ($ million)
        • Data Table on UK - Market size and forecast 2024-2029 ($ million)
        • Chart on UK - Year-over-year growth 2024-2029 (%)
        • Data Table on UK - Year-over-year growth 2024-2029 (%)
      • 12.12 Japan - Market size and forecast 2024-2029
        • Chart on Japan - Market size and forecast 2024-2029 ($ million)
        • Data Table on Japan - Market size and forecast 2024-2029 ($ million)
        • Chart on Japan - Year-over-year growth 2024-2029 (%)
        • Data Table on Japan - Year-over-year growth 2024-2029 (%)
      • 12.13 Germany - Market size and forecast 2024-2029
        • Chart on Germany - Market size and forecast 2024-2029 ($ million)
        • Data Table on Germany - Market size and forecast 2024-2029 ($ million)
        • Chart on Germany - Year-over-year growth 2024-2029 (%)
        • Data Table on Germany - Year-over-year growth 2024-2029 (%)
      • 12.14 India - Market size and forecast 2024-2029
        • Chart on India - Market size and forecast 2024-2029 ($ million)
        • Data Table on India - Market size and forecast 2024-2029 ($ million)
        • Chart on India - Year-over-year growth 2024-2029 (%)
        • Data Table on India - Year-over-year growth 2024-2029 (%)
      • 12.15 France - Market size and forecast 2024-2029
        • Chart on France - Market size and forecast 2024-2029 ($ million)
        • Data Table on France - Market size and forecast 2024-2029 ($ million)
        • Chart on France - Year-over-year growth 2024-2029 (%)
        • Data Table on France - Year-over-year growth 2024-2029 (%)
      • 12.16 Italy - Market size and forecast 2024-2029
        • Chart on Italy - Market size and forecast 2024-2029 ($ million)
        • Data Table on Italy - Market size and forecast 2024-2029 ($ million)
        • Chart on Italy - Year-over-year growth 2024-2029 (%)
        • Data Table on Italy - Year-over-year growth 2024-2029 (%)
      • 12.17 South Korea - Market size and forecast 2024-2029
        • Chart on South Korea - Market size and forecast 2024-2029 ($ million)
        • Data Table on South Korea - Market size and forecast 2024-2029 ($ million)
        • Chart on South Korea - Year-over-year growth 2024-2029 (%)
        • Data Table on South Korea - Year-over-year growth 2024-2029 (%)
      • 12.18 Market opportunity by geography
        • Market opportunity by geography ($ million)
        • Data Tables on Market opportunity by geography ($ million)

      13 Drivers, Challenges, and Opportunity/Restraints

      • 13.1 Market drivers
        • 13.2 Market challenges
          • 13.3 Impact of drivers and challenges
            • Impact of drivers and challenges in 2024 and 2029
          • 13.4 Market opportunities/restraints

            14 Competitive Landscape

            • 14.1 Overview
              • 14.2 Competitive Landscape
                • Overview on criticality of inputs and factors of differentiation
              • 14.3 Landscape disruption
                • Overview on factors of disruption
              • 14.4 Industry risks
                • Impact of key risks on business

              15 Competitive Analysis

              • 15.1 Companies profiled
                • Companies covered
              • 15.2 Company ranking index
                • Company ranking index
              • 15.3 Market positioning of companies
                • Matrix on companies position and classification
              • 15.4 Accenture PLC
                • Accenture PLC - Overview
                • Accenture PLC - Business segments
                • Accenture PLC - Key news
                • Accenture PLC - Key offerings
                • Accenture PLC - Segment focus
                • SWOT
              • 15.5 Alteryx Inc.
                • Alteryx Inc. - Overview
                • Alteryx Inc. - Product / Service
                • Alteryx Inc. - Key news
                • Alteryx Inc. - Key offerings
                • SWOT
              • 15.6 Amazon.com Inc.
                • Amazon.com Inc. - Overview
                • Amazon.com Inc. - Business segments
                • Amazon.com Inc. - Key news
                • Amazon.com Inc. - Key offerings
                • Amazon.com Inc. - Segment focus
                • SWOT
              • 15.7 Atos SE
                • Atos SE - Overview
                • Atos SE - Business segments
                • Atos SE - Key news
                • Atos SE - Key offerings
                • Atos SE - Segment focus
                • SWOT
              • 15.8 Google LLC
                • Google LLC - Overview
                • Google LLC - Product / Service
                • Google LLC - Key news
                • Google LLC - Key offerings
                • SWOT
              • 15.9 Hewlett Packard Enterprise Co.
                • Hewlett Packard Enterprise Co. - Overview
                • Hewlett Packard Enterprise Co. - Business segments
                • Hewlett Packard Enterprise Co. - Key news
                • Hewlett Packard Enterprise Co. - Key offerings
                • Hewlett Packard Enterprise Co. - Segment focus
                • SWOT
              • 15.10 Hitachi Ltd.
                • Hitachi Ltd. - Overview
                • Hitachi Ltd. - Business segments
                • Hitachi Ltd. - Key news
                • Hitachi Ltd. - Key offerings
                • Hitachi Ltd. - Segment focus
                • SWOT
              • 15.11 International Business Machines Corp.
                • International Business Machines Corp. - Overview
                • International Business Machines Corp. - Business segments
                • International Business Machines Corp. - Key news
                • International Business Machines Corp. - Key offerings
                • International Business Machines Corp. - Segment focus
                • SWOT
              • 15.12 Microsoft Corp.
                • Microsoft Corp. - Overview
                • Microsoft Corp. - Business segments
                • Microsoft Corp. - Key news
                • Microsoft Corp. - Key offerings
                • Microsoft Corp. - Segment focus
                • SWOT
              • 15.13 Oracle Corp.
                • Oracle Corp. - Overview
                • Oracle Corp. - Business segments
                • Oracle Corp. - Key news
                • Oracle Corp. - Key offerings
                • Oracle Corp. - Segment focus
                • SWOT
              • 15.14 SAP SE
                • SAP SE - Overview
                • SAP SE - Business segments
                • SAP SE - Key news
                • SAP SE - Key offerings
                • SAP SE - Segment focus
                • SWOT
              • 15.15 SAS Institute Inc.
                • SAS Institute Inc. - Overview
                • SAS Institute Inc. - Product / Service
                • SAS Institute Inc. - Key news
                • SAS Institute Inc. - Key offerings
                • SWOT
              • 15.16 Sisense Ltd.
                • Sisense Ltd. - Overview
                • Sisense Ltd. - Product / Service
                • Sisense Ltd. - Key news
                • Sisense Ltd. - Key offerings
                • SWOT
              • 15.17 Thales Group
                • Thales Group - Overview
                • Thales Group - Business segments
                • Thales Group - Key news
                • Thales Group - Key offerings
                • Thales Group - Segment focus
                • SWOT
              • 15.18 TIBCO Software Inc.
                • TIBCO Software Inc. - Overview
                • TIBCO Software Inc. - Product / Service
                • TIBCO Software Inc. - Key offerings
                • SWOT

              16 Appendix

              • 16.1 Scope of the report
                • 16.2 Inclusions and exclusions checklist
                  • Inclusions checklist
                  • Exclusions checklist
                • 16.3 Currency conversion rates for US$
                  • Currency conversion rates for US$
                • 16.4 Research methodology
                  • Research methodology
                • 16.5 Data procurement
                  • Information sources
                • 16.6 Data validation
                  • Data validation
                • 16.7 Validation techniques employed for market sizing
                  • Validation techniques employed for market sizing
                • 16.8 Data synthesis
                  • Data synthesis
                • 16.9 360 degree market analysis
                  • 360 degree market analysis
                • 16.10 List of abbreviations
                  • List of abbreviations

                Research Methodology

                Technavio presents a detailed picture of the market by way of study, synthesis, and summation of data from multiple sources. The analysts have presented the various facets of the market with a particular focus on identifying the key industry influencers. The data thus presented is comprehensive, reliable, and the result of extensive research, both primary and secondary.

                INFORMATION SOURCES

                Primary sources

                • Manufacturers and suppliers
                • Channel partners
                • Industry experts
                • Strategic decision makers

                Secondary sources

                • Industry journals and periodicals
                • Government data
                • Financial reports of key industry players
                • Historical data
                • Press releases

                DATA ANALYSIS

                Data Synthesis

                • Collation of data
                • Estimation of key figures
                • Analysis of derived insights

                Data Validation

                • Triangulation with data models
                • Reference against proprietary databases
                • Corroboration with industry experts

                REPORT WRITING

                Qualitative

                • Market drivers
                • Market challenges
                • Market trends
                • Five forces analysis

                Quantitative

                • Market size and forecast
                • Market segmentation
                • Geographical insights
                • Competitive landscape

                Interested in this report?

                Get your sample now to see our research methodology and insights!

                Download Now

                Frequently Asked Questions

                Analytics As A Service (Aaas) market growth will increase by $ 59361.7 mn during 2025-2029.

                The Analytics As A Service (Aaas) market is expected to grow at a CAGR of 25.9% during 2025-2029.

                Analytics As A Service (Aaas) market is segmented by Type( Predictive analytics, Prescriptive analytics, Diagnostic analytics, Descriptive analytics) End-user( BSFI, Manufacturing, Retail, Healthcare, Others) Consumer( Large enterprise, SMEs, APAC, Middle East and Africa, South America)

                Accenture PLC, Alteryx Inc., Amazon.com Inc., Atos SE, Cloudera Inc., Google LLC, Hewlett Packard Enterprise Co., Hitachi Ltd., Infor Inc., International Business Machines Corp., Microsoft Corp., MicroStrategy Inc., Oracle Corp., QlikTech international AB, Salesforce Inc., SAP SE, SAS Institute Inc., Sisense Ltd., Thales Group, TIBCO Software Inc. are a few of the key vendors in the Analytics As A Service (Aaas) market.

                North America will register the highest growth rate of 36% among the other regions. Therefore, the Analytics As A Service (Aaas) market in North America is expected to garner significant business opportunities for the vendors during the forecast period.

                US, Canada, China, UK, Japan, Germany, India, France, Italy, South Korea

                • Growing availability and complexity of dataThe availability of a large volume of data and the growing data complexity in organizations are the major drivers for the development of various intelligence-based data analysis techniques. Intelligent techniques involving technologies such as ML and AI can help companies retrieve a huge amount of complex data and beneficially use that data to enhance their services and business processes. This is the driving factor this market.
                • in turn is the driving factor this market.
                • is expected to drive the demand for analytics as a service.From the enterprises perspective is the driving factor this market.
                • a huge amount of data is available in companies vast trove of documents and knowledge base. Answers to many business and customer questions exist in the pool of data but are not utilized due to many reasons is the driving factor this market.
                • including the lack of knowledge of where and how to look for the information. One of the major reasons is that enterprise data is generally stored in silos. Moreover is the driving factor this market.
                • data formats are complicated as the type of data can range from product support is the driving factor this market.
                • bills is the driving factor this market.
                • the latest regulations relating to contracts is the driving factor this market.
                • and the implications of other events discovered. The analysis of such data is tedious as well as a complex task for a simple computer program or human being. Hence is the driving factor this market.
                • companies rely on analytics for performing such tasks. In addition is the driving factor this market.
                • the increasing volume of data is the driving factor this market.
                • unlike legacy data types is the driving factor this market.
                • is not well-structured is the driving factor this market.
                • especially written data that includes customer reviews is the driving factor this market.
                • feedback is the driving factor this market.
                • and social posts. Customer data that is available outside the enterprises platforms is the driving factor this market.
                • which includes customer preferences and buying patterns is the driving factor this market.
                • is also equally important for companies. Moreover is the driving factor this market.
                • audio or video clips in human language and pictures are a few sources of information available in organizations. Hence is the driving factor this market.
                • the growth of global analytics as a service (AaaS) market is expected to increase during the forecast period. is the driving factor this market.

                The Analytics As A Service (Aaas) market vendors should focus on grabbing business opportunities from the Predictive analytics segment as it accounted for the largest market share in the base year.
                RIA - Research AI Assistant
                Ask RIA