Track And Trace Solutions Market Size 2024-2028
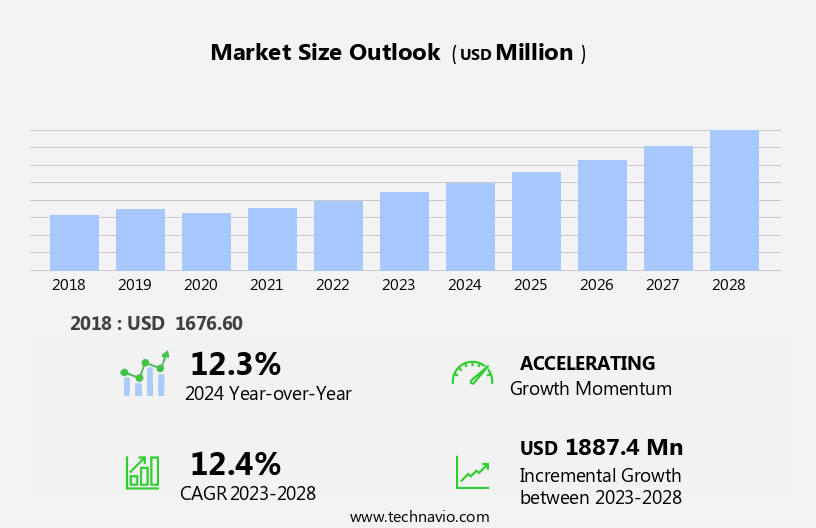
The track and trace solutions market size is forecast to increase by USD 1.89 billion at a CAGR of 12.4% between 2023 and 2028.
The market is experiencing significant growth due to several key factors. Stringent regulations are being enforced to ensure product safety, traceability, and authenticity, driving market demand. companies are responding by launching new solutions to meet these requirements. However, data security and privacy concerns associated with software solutions pose a challenge. Compliance with these regulations and addressing these concerns will be crucial for market success. Companies must prioritize these factors to remain competitive and meet the evolving needs of consumers and regulatory bodies. The market is expected to continue its growth trajectory as these trends and challenges shape its development.
What will be the Size of the Track And Trace Solutions Market During the Forecast Period?

Request Free Sample
The market is experiencing significant growth due to increasing demands for supply chain transparency and product authentication in various industries, including medical devices and pharmaceuticals. Serialization practices and packaging-related product recalls are driving the adoption of track and trace solutions to ensure product integrity and consumer safety. Counterfeit drugs, a major concern In the biopharmaceutical sector, are being combated through the implementation of advanced hardware technologies such as 2D barcodes, radiofrequency identification (RFID), and Internet of Things (IoT) devices. These technologies enable unique identifying barcodes and real-time monitoring of the supply chain, reducing the risk of drug counterfeiting and ensuring the authenticity of medications.Software solutions and hardware systems are essential components of track and trace solutions, providing aggregation capabilities to enable efficient tracking and tracing of products throughout the supply chain. The consumer packaged goods industry also benefits from track and trace solutions, enhancing product recalls and ensuring timely resolution of any supply chain disruptions.
How is this Track And Trace Solutions Industry segmented and which is the largest segment?
The track and trace solutions industry research report provides comprehensive data (region-wise segment analysis), with forecasts and estimates in "USD million" for the period 2024-2028, as well as historical data from 2018-2022 for the following segments.
- Component
- Geography
- North America
- Europe
- APAC
- South America
- Middle East and Africa
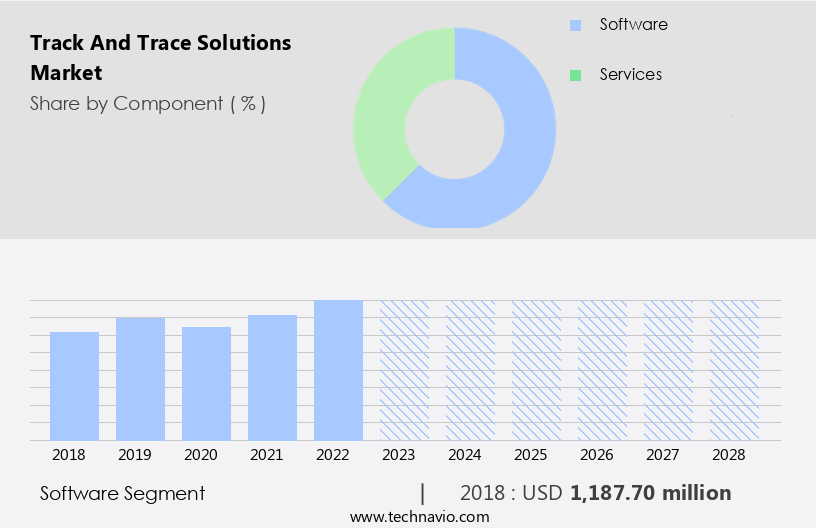
By Component Insights
- The software segment is estimated to witness significant growth during the forecast period.
The market encompasses software applications that manage and analyze data to ensure product integrity and regulatory compliance throughout the supply chain. The software segment is a crucial component, offering solutions for monitoring product journeys, managing recalls, and maintaining regulatory standards. Key offerings within this segment include track and trace software, data analytics tools, and compliance management software. These solutions facilitate real-time tracking, enhance visibility, and improve efficiency by integrating data from various sources. Track and trace software is essential for managing product recalls and ensuring the authenticity of medical devices, pharmaceuticals, and consumer packaged goods. Data analytics tools enable advanced analytics and reporting, while compliance management software ensures adherence to regulations such as the Falsified Medicines Directive and Serialization Mandates.
The Internet of Things (IoT) and RFID technologies are increasingly integrated into these solutions, providing continuous data flow and unique identifying barcodes for real-time tracking and monitoring. Additionally, software solutions offer advanced analytics and serialization programs to combat counterfeit drugs, substandard medications, and product recalls in various industries, including medical devices, biopharmaceuticals, and food & beverages.

Get a glance at the Track And Trace Solutions Industry report of share of various segments Request Free Sample
The Software segment was valued at USD 1.19 billion in 2018 and showed a gradual increase during the forecast period.
Regional Analysis
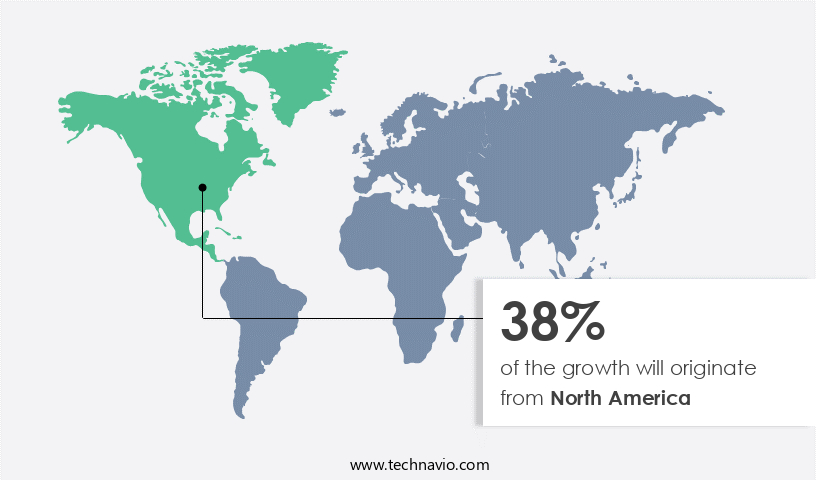
- North America is estimated to contribute 38% to the growth of the global market during the forecast period.
Technavio’s analysts have elaborately explained the regional trends and drivers that shape the market during the forecast period.

For more insights on the market share of various regions, Request Free Sample
The North American the market is propelled by technological advancements and stringent regulatory requirements, primarily In the pharmaceutical, healthcare, and logistics sectors. In the pharmaceutical industry, companies are mandated to implement comprehensive track and trace systems to ensure drug safety and prevent counterfeit products. The U.S. Drug Supply Chain Security Act (DSCSA) enforces detailed tracking information for prescription drugs among manufacturers, repackagers, and wholesale distributors. This regulatory landscape has catalyzed the adoption of advanced technologies, including RFID, barcoding, and IoT devices, which offer real-time visibility and traceability throughout the supply chain. In addition, the Falsified Medicines Directive in Europe and serialization practices In the biopharmaceutical sector further fuel the market's growth.
Serialization solutions, aggregation solutions, and software and hardware systems are integral components of these advanced tracking systems. The market also caters to consumer packaged goods, e-commerce, medical devices, food & beverages, and product recalls.
Market Dynamics
Our researchers analyzed the data with 2023 as the base year, along with the key drivers, trends, and challenges. A holistic analysis of drivers will help companies refine their marketing strategies to gain a competitive advantage.
What are the key market drivers leading to the rise In the adoption of Track And Trace Solutions Industry?
Stringent laws to ensure product safety, traceability, and authenticity is the key driver of the market.
In the global market for track and trace solutions, regulatory compliance plays a crucial role, particularly in sectors with stringent regulations such as pharmaceuticals, food and beverages, and cosmetics. Governments and regulatory bodies worldwide are enforcing stricter laws to ensure product safety, traceability, and authenticity, safeguarding consumers from counterfeit products, unsafe food, and potential health risks. In the pharmaceutical industry, the Drug Supply Chain Security Act (DSCSA) In the US mandates the implementation of serialization and tracking measures for prescription drugs. This legislation requires each drug package to carry a unique serial number, enabling comprehensive tracking throughout the supply chain.Serialization practices, such as 2D barcode technology and RFID, are essential components of track and trace solutions. These technologies provide continuous data flow, ensuring real-time tracking and monitoring of products, from manufacturing to distribution and consumption. Advanced hardware and software solutions, including IoT and unique identifying barcodes, facilitate aggregation and serialization programs. Serialization mandates, like the Falsified Medicines Directive in Europe, are driving the adoption of track and trace solutions In the pharmaceutical industry. In addition, product recalls, whether in medical devices, pharmaceuticals, or consumer packaged goods, necessitate the use of effective track and trace systems to minimize the impact on consumers and businesses.Counterfeit drugs and substandard medications pose significant threats to public health and safety, making the need for robust track and trace solutions increasingly urgent. The market for track and trace solutions is expected to grow significantly due to these regulatory requirements and the increasing demand for product safety and authenticity.
What are the market trends shaping the Track And Trace Solutions Industry?
New product launches by vendors is the upcoming market trend.
The market is witnessing significant growth due to the increasing demand for advanced technologies that ensure supply chain transparency and compliance in various industries, including Medical Devices and Pharmaceuticals. Serialization practices, such as the use of unique identifying barcodes and RFID technology, are becoming increasingly popular for product recalls and combating counterfeit drugs. New product launches, like ACG's cloud-based Verification Router Service (VRS, launched on December 15, 2023), are addressing the evolving needs of the market by incorporating features like real-time tracking, continuous data flow, and advanced analytics. These solutions enable industries to monitor their supply chains for substandard medications and counterfeit drugs, ensuring consumer safety and regulatory compliance.The Internet of Things (IoT) and 2D barcode technology are also gaining traction In the market, enhancing the capabilities of serialization and aggregation solutions. The Falsified Medicines Directive and Serialization Mandates are driving the adoption of these technologies, making it crucial for companies to invest in software solutions and hardware systems to remain competitive. The market for Track and Trace Solutions is expected to continue growing, with applications extending to Consumer Packaged Goods, E-commerce, and Food & Beverages, among others.
What challenges does the Track And Trace Solutions Industry face during its growth?
Data security and privacy concerns with software solutions is a key challenge affecting the industry growth.
In the dynamic world of business, ensuring the security and authenticity of medical devices and pharmaceutical products is paramount. Track and trace solutions have emerged as a critical tool to address the challenges of serialization practices, product recalls, and counterfeit drugs. These systems employ advanced hardware technologies such as Radiofrequency Identification (RFID) and Internet of Things (IoT) to enable real-time tracking and monitoring of the supply chain. Unique identifying barcodes, continuous data flow, and 2D barcode technology are essential components of serialization solutions and aggregation solutions that facilitate the traceability of products from the manufacturer to the end consumer. However, data security and privacy concerns pose significant challenges In the market.The increasing reliance on digital technologies heightens the risks of data breaches, which can lead to substantial financial losses and reputational damage. For instance, the August 27, 2024, ransomware attack on JAS Worldwide, an international cargo freight forwarder, caused significant disruptions, impacting various business functions and data integrations with customers and companies. These incidents underscore the importance of robust data security measures and the need for continuous improvement in supply chain management systems. Serialization mandates, such as the Falsified Medicines Directive, require companies to adopt track and trace solutions to ensure the authenticity and safety of medical devices and pharmaceutical products.The implementation of these regulations has led to the adoption of software solutions and hardware systems to manage product coding, track & trace solutions, and product recalls. The consumer packaged goods, e-commerce, biopharmaceutical, and food & beverage industries also leverage these solutions to enhance their supply chain monitoring capabilities and mitigate risks associated with substandard medications and counterfeit medications. Advanced analytics and serialization programs enable businesses to gain valuable insights into their supply chain operations, optimize inventory management, and improve overall operational efficiency. As the market for track and trace solutions continues to evolve, businesses must stay abreast of the latest trends and technologies to maintain a competitive edge and protect their reputation In the marketplace.
Exclusive Customer Landscape
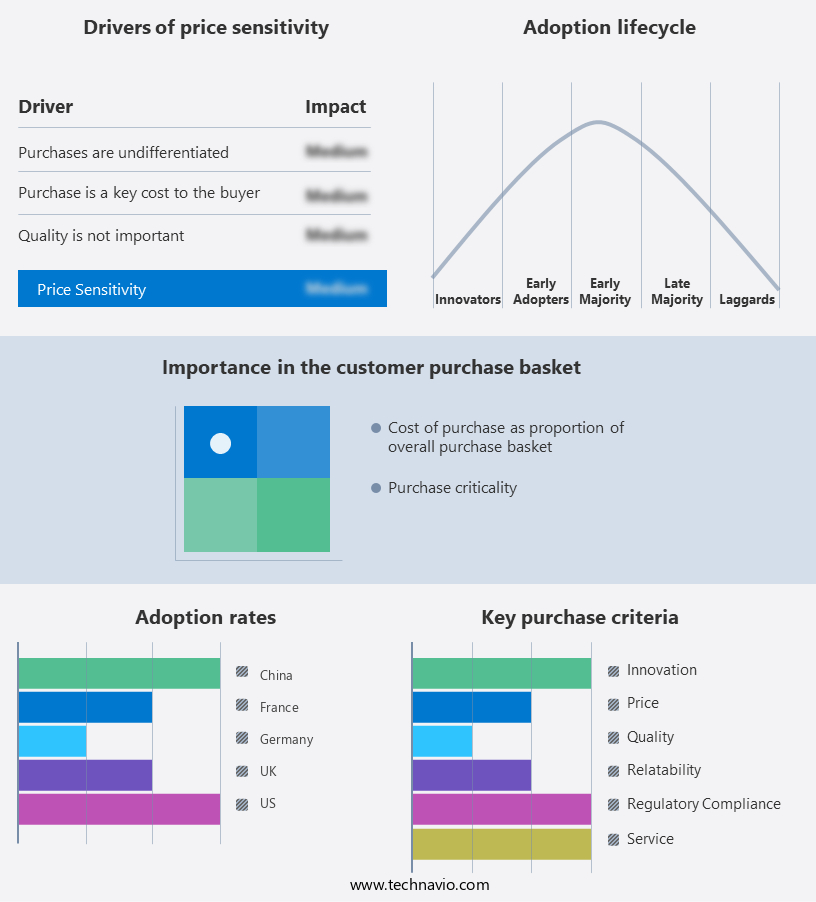
The track and trace solutions market forecasting report includes the adoption lifecycle of the market, covering from the innovator’s stage to the laggard’s stage. It focuses on adoption rates in different regions based on penetration. Furthermore, the track and trace solutions market report also includes key purchase criteria and drivers of price sensitivity to help companies evaluate and develop their market growth analysis strategies.

Customer Landscape
Key Companies & Market Insights
Companies are implementing various strategies, such as strategic alliances, track and trace solutions market forecast, partnerships, mergers and acquisitions, geographical expansion, and product/service launches, to enhance their presence In the industry.
ACG - The company offers sophisticated track and trace solutions, encompassing advanced serialization, aggregation, and anti-counterfeiting technologies. These solutions safeguard pharmaceutical products throughout the entire supply chain, ensuring transparency and security. By employing cutting-edge technologies, these offerings facilitate comprehensive monitoring and protection against counterfeit goods.
The industry research and growth report includes detailed analyses of the competitive landscape of the market and information about key companies, including:
- ACG
- Accenture PLC
- Antares Vision S.p.A
- Avery Dennison Corp.
- Axway Software SA
- Honeywell International Inc.
- Jekson Vision
- Laetus GmbH
- Marchesini Group Spa
- Mettler Toledo International Inc.
- Optel Group
- Oracle Corp.
- Robert Bosch GmbH
- SAP SE
- SATO Holdings Corp.
- Sea Vision
- Siemens AG
- Syntegon Technology GmbH
- TraceLink Inc.
- Uhlmann Pac Systeme GmbH and Co. KGA
- Zebra Technologies Corp.
Qualitative and quantitative analysis of companies has been conducted to help clients understand the wider business environment as well as the strengths and weaknesses of key industry players. Data is qualitatively analyzed to categorize companies as pure play, category-focused, industry-focused, and diversified; it is quantitatively analyzed to categorize companies as dominant, leading, strong, tentative, and weak.
Research Analyst Overview
The market encompasses a range of technologies and applications designed to enhance supply chain visibility and product authentication in various industries. These solutions enable real-time monitoring of products, ensuring the integrity and authenticity of goods as they move through the supply chain. Serialization practices play a crucial role In the implementation of track and trace systems. By assigning unique identifiers to individual units or batches of products, these practices facilitate accurate tracking and enable effective recall processes in case of product issues. Packaging-related product recalls can significantly impact businesses and consumers alike. Track and trace solutions help mitigate the risks associated with these events by enabling swift identification and isolation of affected products.
Counterfeit drugs pose a serious threat to public health, and the implementation of track and trace systems is essential for combating this issue. Supply chain management has evolved significantly with the advent of advanced hardware and software solutions. Technologies such as radiofrequency identification (RFID) and the Internet of Things (IoT) enable continuous data flow, allowing businesses to monitor their supply chains in real-time and respond quickly to any disruptions. Unique identifying barcodes, such as 2D barcode technology, are a key component of track and trace solutions. These barcodes provide a quick and efficient method for capturing and transmitting product information, ensuring that accurate data is available at every stage of the supply chain.
Serialization solutions and aggregation solutions are two essential components of track and trace systems. Serialization solutions assign unique identifiers to individual units, while aggregation solutions group these units into larger batches or pallets for easier tracking and management. The Falsified Medicines Directive (FMD) is an EU regulation aimed at enhancing the security of the pharmaceutical supply chain. It mandates the implementation of track and trace systems for all prescription medicines, ensuring that each unit can be verified at the point of dispensing. Track and trace solutions are not limited to the pharmaceutical industry. They are increasingly being adopted by consumer packaged goods, e-commerce, and other sectors to improve supply chain efficiency, reduce costs, and enhance product safety.
Product coding is another critical aspect of track and trace systems. Effective coding ensures that products can be easily identified and tracked throughout the supply chain, enabling businesses to maintain accurate inventory levels and respond quickly to any issues. Software solutions and hardware systems are the two primary components of track and trace systems. Software solutions provide the intelligence and analytics capabilities needed to manage and interpret the data generated by the system, while hardware systems, such as RFID readers and scanners, enable the capture and transmission of product information. The adoption of track and trace solutions is driven by a range of factors, including increasing regulatory requirements, growing consumer demand for product safety and authenticity, and the need to improve supply chain efficiency and reduce costs.
As the market continues to evolve, we can expect to see further innovation and the integration of advanced analytics and artificial intelligence to enhance the capabilities of these systems.
Market Scope
|
Report Coverage
|
Details
|
Page number
|
217
|
Base year
|
2023
|
Historic period
|
2018-2022 |
Forecast period
|
2024-2028
|
Growth momentum & CAGR
|
Accelerate at a CAGR of 12.4%
|
Market growth 2024-2028
|
USD 1887.4 million
|
Market structure
|
Fragmented
|
YoY growth 2023-2024(%)
|
12.3
|
Key countries
|
US, UK, China, Germany, France, Japan, The Netherlands, Italy, India, and Canada
|
Competitive landscape
|
Leading Companies, Market Positioning of Companies, Competitive Strategies, and Industry Risks
|
Request Free Sample
What are the Key Data Covered in this Track And Trace Solutions Market Research and Growth Report?
- CAGR of the Track And Trace Solutions industry during the forecast period
- Detailed information on factors that will drive the growth and forecasting between 2024 and 2028
- Precise estimation of the size of the market and its contribution of the industry in focus to the parent market
- Accurate predictions about upcoming growth and trends and changes in consumer behaviour
- Growth of the market across North America, Europe, APAC, South America, and Middle East and Africa
- Thorough analysis of the market’s competitive landscape and detailed information about companies
- Comprehensive analysis of factors that will challenge the track and trace solutions market growth of industry companies
We can help! Our analysts can customize this track and trace solutions market research report to meet your requirements.
Get in touch
1 Executive Summary
- 1.1 Market overview
- Executive Summary - Chart on Market Overview
- Executive Summary - Data Table on Market Overview
- Executive Summary - Chart on Global Market Characteristics
- Executive Summary - Chart on Market by Geography
- Executive Summary - Chart on Market Segmentation by Component
- Executive Summary - Chart on Market Segmentation by End-user
- Executive Summary - Chart on Incremental Growth
- Executive Summary - Data Table on Incremental Growth
- Executive Summary - Chart on Company Market Positioning
2 Technavio Analysis
- 2.1 Analysis of price sensitivity, lifecycle, customer purchase basket, adoption rates, and purchase criteria
- Analysis of price sensitivity, lifecycle, customer purchase basket, adoption rates, and purchase criteria
- 2.2 Criticality of inputs and Factors of differentiation
- Overview on criticality of inputs and factors of differentiation
- 2.3 Factors of disruption
- Overview on factors of disruption
- 2.4 Impact of drivers and challenges
- Impact of drivers and challenges in 2023 and 2028
3 Market Landscape
- 3.1 Market ecosystem
- Parent Market
- Data Table on - Parent Market
- 3.2 Market characteristics
- Market characteristics analysis
4 Market Sizing
- 4.1 Market definition
- Offerings of companies included in the market definition
- 4.2 Market segment analysis
- 4.4 Market outlook: Forecast for 2023-2028
- Chart on Global - Market size and forecast 2023-2028 ($ million)
- Data Table on Global - Market size and forecast 2023-2028 ($ million)
- Chart on Global Market: Year-over-year growth 2023-2028 (%)
- Data Table on Global Market: Year-over-year growth 2023-2028 (%)
5 Historic Market Size
- 5.1 Global Track And Trace Solutions Market 2018 - 2022
- Historic Market Size - Data Table on Global Track And Trace Solutions Market 2018 - 2022 ($ million)
- 5.2 Component segment analysis 2018 - 2022
- Historic Market Size - Component Segment 2018 - 2022 ($ million)
- 5.3 End-user segment analysis 2018 - 2022
- Historic Market Size - End-user Segment 2018 - 2022 ($ million)
- 5.4 Geography segment analysis 2018 - 2022
- Historic Market Size - Geography Segment 2018 - 2022 ($ million)
- 5.5 Country segment analysis 2018 - 2022
- Historic Market Size - Country Segment 2018 - 2022 ($ million)
6 Qualitative Analysis
- 6.1 Impact of AI in the Global Track and Trace Solutions Market
7 Five Forces Analysis
- 7.1 Five forces summary
- Five forces analysis - Comparison between 2023 and 2028
- 7.2 Bargaining power of buyers
- Bargaining power of buyers - Impact of key factors 2023 and 2028
- 7.3 Bargaining power of suppliers
- Bargaining power of suppliers - Impact of key factors in 2023 and 2028
- 7.4 Threat of new entrants
- Threat of new entrants - Impact of key factors in 2023 and 2028
- 7.5 Threat of substitutes
- Threat of substitutes - Impact of key factors in 2023 and 2028
- 7.6 Threat of rivalry
- Threat of rivalry - Impact of key factors in 2023 and 2028
- 7.7 Market condition
- Chart on Market condition - Five forces 2023 and 2028
8 Market Segmentation by Component
- 8.1 Market segments
- Chart on Component - Market share 2023-2028 (%)
- Data Table on Component - Market share 2023-2028 (%)
- 8.2 Comparison by Component
- Chart on Comparison by Component
- Data Table on Comparison by Component
- 8.3 Software - Market size and forecast 2023-2028
- Chart on Software - Market size and forecast 2023-2028 ($ million)
- Data Table on Software - Market size and forecast 2023-2028 ($ million)
- Chart on Software - Year-over-year growth 2023-2028 (%)
- Data Table on Software - Year-over-year growth 2023-2028 (%)
- 8.4 Services - Market size and forecast 2023-2028
- Chart on Services - Market size and forecast 2023-2028 ($ million)
- Data Table on Services - Market size and forecast 2023-2028 ($ million)
- Chart on Services - Year-over-year growth 2023-2028 (%)
- Data Table on Services - Year-over-year growth 2023-2028 (%)
- 8.5 Market opportunity by Component
- Market opportunity by Component ($ million)
- Data Table on Market opportunity by Component ($ million)
9 Market Segmentation by End-user
- 9.1 Market segments
- Chart on End-user - Market share 2023-2028 (%)
- Data Table on End-user - Market share 2023-2028 (%)
- 9.2 Comparison by End-user
- Chart on Comparison by End-user
- Data Table on Comparison by End-user
- 9.3 Pharmaceuticals and healthcare - Market size and forecast 2023-2028
- Chart on Pharmaceuticals and healthcare - Market size and forecast 2023-2028 ($ million)
- Data Table on Pharmaceuticals and healthcare - Market size and forecast 2023-2028 ($ million)
- Chart on Pharmaceuticals and healthcare - Year-over-year growth 2023-2028 (%)
- Data Table on Pharmaceuticals and healthcare - Year-over-year growth 2023-2028 (%)
- 9.4 Food and beverage - Market size and forecast 2023-2028
- Chart on Food and beverage - Market size and forecast 2023-2028 ($ million)
- Data Table on Food and beverage - Market size and forecast 2023-2028 ($ million)
- Chart on Food and beverage - Year-over-year growth 2023-2028 (%)
- Data Table on Food and beverage - Year-over-year growth 2023-2028 (%)
- 9.5 Retail - Market size and forecast 2023-2028
- Chart on Retail - Market size and forecast 2023-2028 ($ million)
- Data Table on Retail - Market size and forecast 2023-2028 ($ million)
- Chart on Retail - Year-over-year growth 2023-2028 (%)
- Data Table on Retail - Year-over-year growth 2023-2028 (%)
- 9.6 Manufacturing - Market size and forecast 2023-2028
- Chart on Manufacturing - Market size and forecast 2023-2028 ($ million)
- Data Table on Manufacturing - Market size and forecast 2023-2028 ($ million)
- Chart on Manufacturing - Year-over-year growth 2023-2028 (%)
- Data Table on Manufacturing - Year-over-year growth 2023-2028 (%)
- 9.7 Others - Market size and forecast 2023-2028
- Chart on Others - Market size and forecast 2023-2028 ($ million)
- Data Table on Others - Market size and forecast 2023-2028 ($ million)
- Chart on Others - Year-over-year growth 2023-2028 (%)
- Data Table on Others - Year-over-year growth 2023-2028 (%)
- 9.8 Market opportunity by End-user
- Market opportunity by End-user ($ million)
- Data Table on Market opportunity by End-user ($ million)
10 Customer Landscape
- 10.1 Customer landscape overview
- Analysis of price sensitivity, lifecycle, customer purchase basket, adoption rates, and purchase criteria
11 Geographic Landscape
- 11.1 Geographic segmentation
- Chart on Market share by geography 2023-2028 (%)
- Data Table on Market share by geography 2023-2028 (%)
- 11.2 Geographic comparison
- Chart on Geographic comparison
- Data Table on Geographic comparison
- 11.3 North America - Market size and forecast 2023-2028
- Chart on North America - Market size and forecast 2023-2028 ($ million)
- Data Table on North America - Market size and forecast 2023-2028 ($ million)
- Chart on North America - Year-over-year growth 2023-2028 (%)
- Data Table on North America - Year-over-year growth 2023-2028 (%)
- 11.4 Europe - Market size and forecast 2023-2028
- Chart on Europe - Market size and forecast 2023-2028 ($ million)
- Data Table on Europe - Market size and forecast 2023-2028 ($ million)
- Chart on Europe - Year-over-year growth 2023-2028 (%)
- Data Table on Europe - Year-over-year growth 2023-2028 (%)
- 11.5 APAC - Market size and forecast 2023-2028
- Chart on APAC - Market size and forecast 2023-2028 ($ million)
- Data Table on APAC - Market size and forecast 2023-2028 ($ million)
- Chart on APAC - Year-over-year growth 2023-2028 (%)
- Data Table on APAC - Year-over-year growth 2023-2028 (%)
- 11.6 South America - Market size and forecast 2023-2028
- Chart on South America - Market size and forecast 2023-2028 ($ million)
- Data Table on South America - Market size and forecast 2023-2028 ($ million)
- Chart on South America - Year-over-year growth 2023-2028 (%)
- Data Table on South America - Year-over-year growth 2023-2028 (%)
- 11.7 Middle East and Africa - Market size and forecast 2023-2028
- Chart on Middle East and Africa - Market size and forecast 2023-2028 ($ million)
- Data Table on Middle East and Africa - Market size and forecast 2023-2028 ($ million)
- Chart on Middle East and Africa - Year-over-year growth 2023-2028 (%)
- Data Table on Middle East and Africa - Year-over-year growth 2023-2028 (%)
- 11.8 US - Market size and forecast 2023-2028
- Chart on US - Market size and forecast 2023-2028 ($ million)
- Data Table on US - Market size and forecast 2023-2028 ($ million)
- Chart on US - Year-over-year growth 2023-2028 (%)
- Data Table on US - Year-over-year growth 2023-2028 (%)
- 11.9 China - Market size and forecast 2023-2028
- Chart on China - Market size and forecast 2023-2028 ($ million)
- Data Table on China - Market size and forecast 2023-2028 ($ million)
- Chart on China - Year-over-year growth 2023-2028 (%)
- Data Table on China - Year-over-year growth 2023-2028 (%)
- 11.10 UK - Market size and forecast 2023-2028
- Chart on UK - Market size and forecast 2023-2028 ($ million)
- Data Table on UK - Market size and forecast 2023-2028 ($ million)
- Chart on UK - Year-over-year growth 2023-2028 (%)
- Data Table on UK - Year-over-year growth 2023-2028 (%)
- 11.11 Japan - Market size and forecast 2023-2028
- Chart on Japan - Market size and forecast 2023-2028 ($ million)
- Data Table on Japan - Market size and forecast 2023-2028 ($ million)
- Chart on Japan - Year-over-year growth 2023-2028 (%)
- Data Table on Japan - Year-over-year growth 2023-2028 (%)
- 11.12 Germany - Market size and forecast 2023-2028
- Chart on Germany - Market size and forecast 2023-2028 ($ million)
- Data Table on Germany - Market size and forecast 2023-2028 ($ million)
- Chart on Germany - Year-over-year growth 2023-2028 (%)
- Data Table on Germany - Year-over-year growth 2023-2028 (%)
- 11.13 India - Market size and forecast 2023-2028
- Chart on India - Market size and forecast 2023-2028 ($ million)
- Data Table on India - Market size and forecast 2023-2028 ($ million)
- Chart on India - Year-over-year growth 2023-2028 (%)
- Data Table on India - Year-over-year growth 2023-2028 (%)
- 11.14 Canada - Market size and forecast 2023-2028
- Chart on Canada - Market size and forecast 2023-2028 ($ million)
- Data Table on Canada - Market size and forecast 2023-2028 ($ million)
- Chart on Canada - Year-over-year growth 2023-2028 (%)
- Data Table on Canada - Year-over-year growth 2023-2028 (%)
- 11.15 France - Market size and forecast 2023-2028
- Chart on France - Market size and forecast 2023-2028 ($ million)
- Data Table on France - Market size and forecast 2023-2028 ($ million)
- Chart on France - Year-over-year growth 2023-2028 (%)
- Data Table on France - Year-over-year growth 2023-2028 (%)
- 11.16 Italy - Market size and forecast 2023-2028
- Chart on Italy - Market size and forecast 2023-2028 ($ million)
- Data Table on Italy - Market size and forecast 2023-2028 ($ million)
- Chart on Italy - Year-over-year growth 2023-2028 (%)
- Data Table on Italy - Year-over-year growth 2023-2028 (%)
- 11.17 The Netherlands - Market size and forecast 2023-2028
- Chart on The Netherlands - Market size and forecast 2023-2028 ($ million)
- Data Table on The Netherlands - Market size and forecast 2023-2028 ($ million)
- Chart on The Netherlands - Year-over-year growth 2023-2028 (%)
- Data Table on The Netherlands - Year-over-year growth 2023-2028 (%)
- 11.18 Market opportunity by geography
- Market opportunity by geography ($ million)
- Data Tables on Market opportunity by geography ($ million)
12 Drivers, Challenges, and Opportunity/Restraints
- 12.3 Impact of drivers and challenges
- Impact of drivers and challenges in 2023 and 2028
- 12.4 Market opportunities/restraints
13 Competitive Landscape
- 13.2 Competitive Landscape
- Overview on criticality of inputs and factors of differentiation
- 13.3 Landscape disruption
- Overview on factors of disruption
- 13.4 Industry risks
- Impact of key risks on business
14 Competitive Analysis
- 14.2 Company ranking index
- 14.3 Market positioning of companies
- Matrix on companies position and classification
- 14.4 ACG
- ACG - Overview
- ACG - Product / Service
- ACG - Key offerings
- SWOT
- 14.5 Antares Vision S.p.A
- Antares Vision S.p.A - Overview
- Antares Vision S.p.A - Product / Service
- Antares Vision S.p.A - Key offerings
- SWOT
- 14.6 Avery Dennison Corp.
- Avery Dennison Corp. - Overview
- Avery Dennison Corp. - Business segments
- Avery Dennison Corp. - Key news
- Avery Dennison Corp. - Key offerings
- Avery Dennison Corp. - Segment focus
- SWOT
- 14.7 Axway Software SA
- Axway Software SA - Overview
- Axway Software SA - Business segments
- Axway Software SA - Key news
- Axway Software SA - Key offerings
- Axway Software SA - Segment focus
- SWOT
- 14.8 Honeywell International Inc.
- Honeywell International Inc. - Overview
- Honeywell International Inc. - Product / Service
- Honeywell International Inc. - Key offerings
- SWOT
- 14.9 Mettler Toledo International Inc.
- Mettler Toledo International Inc. - Overview
- Mettler Toledo International Inc. - Business segments
- Mettler Toledo International Inc. - Key news
- Mettler Toledo International Inc. - Key offerings
- Mettler Toledo International Inc. - Segment focus
- SWOT
- 14.10 Optel Group
- Optel Group - Overview
- Optel Group - Product / Service
- Optel Group - Key offerings
- SWOT
- 14.11 Oracle Corp.
- Oracle Corp. - Overview
- Oracle Corp. - Business segments
- Oracle Corp. - Key news
- Oracle Corp. - Key offerings
- Oracle Corp. - Segment focus
- SWOT
- 14.12 SAP SE
- SAP SE - Overview
- SAP SE - Business segments
- SAP SE - Key news
- SAP SE - Key offerings
- SAP SE - Segment focus
- SWOT
- 14.13 SATO Holdings Corp.
- SATO Holdings Corp. - Overview
- SATO Holdings Corp. - Product / Service
- SATO Holdings Corp. - Key offerings
- SWOT
- 14.14 Sea Vision
- Sea Vision - Overview
- Sea Vision - Product / Service
- Sea Vision - Key offerings
- SWOT
- 14.15 Siemens AG
- Siemens AG - Overview
- Siemens AG - Business segments
- Siemens AG - Key news
- Siemens AG - Key offerings
- Siemens AG - Segment focus
- SWOT
- 14.16 Syntegon Technology GmbH
- Syntegon Technology GmbH - Overview
- Syntegon Technology GmbH - Product / Service
- Syntegon Technology GmbH - Key offerings
- SWOT
- 14.17 TraceLink Inc.
- TraceLink Inc. - Overview
- TraceLink Inc. - Product / Service
- TraceLink Inc. - Key offerings
- SWOT
- 14.18 Zebra Technologies Corp.
- Zebra Technologies Corp. - Overview
- Zebra Technologies Corp. - Business segments
- Zebra Technologies Corp. - Key news
- Zebra Technologies Corp. - Key offerings
- Zebra Technologies Corp. - Segment focus
- SWOT
15 Appendix
- 15.2 Inclusions and exclusions checklist
- Inclusions checklist
- Exclusions checklist
- 15.3 Currency conversion rates for US$
- Currency conversion rates for US$
- 15.4 Research methodology
- 15.7 Validation techniques employed for market sizing
- Validation techniques employed for market sizing
- 15.9 360 degree market analysis
- 360 degree market analysis
- 15.10 List of abbreviations
- List of abbreviations
- o Strong geographic presence
- o Expansion of market through acquisitions
- o Diversified portfolio
- o Higher growth prospects
- o Strong infrastructure base
- o Expansion of market through acquisitions
- o Diversified portfolio
- o Stable customer base
- o Strong infrastructure base
- o Stable customer base
- o Diversified portfolio
- o Higher growth prospects
- o Strong geographic presence
- o Strong infrastructure base
- o Strong focus on sustainability
- o Stable customer base
- o Strong geographic presence
- o Strong infrastructure base
- o Diversified portfolio
- o Strong operational management
- o Higher growth prospects