Anesthesia Monitoring Devices Market Analysis, Size, and Forecast 2024-2028: North America (US and Mexico), Europe (France, Germany, Italy, Spain, and UK), Middle East and Africa (UAE), APAC (Australia, China, India, Japan, and South Korea), South America (Brazil), and Rest of World (ROW)

Anesthesia Monitoring Devices Market Analysis, Size, and Forecast 2024-2028:
North America (US and Mexico), Europe (France, Germany, Italy, Spain, and UK), Middle East and Africa (UAE), APAC (Australia, China, India, Japan, and South Korea), South America (Brazil), and Rest of World (ROW)

Published: Jul 2024 173 Pages SKU: IRTNTR74927

Market Overview at a Glance

$1.24 B
Market Opportunity
10.87%
CAGR
9.53
YoY growth 2023-2024(%)

Anesthesia Monitoring Devices Market Size 2024-2028

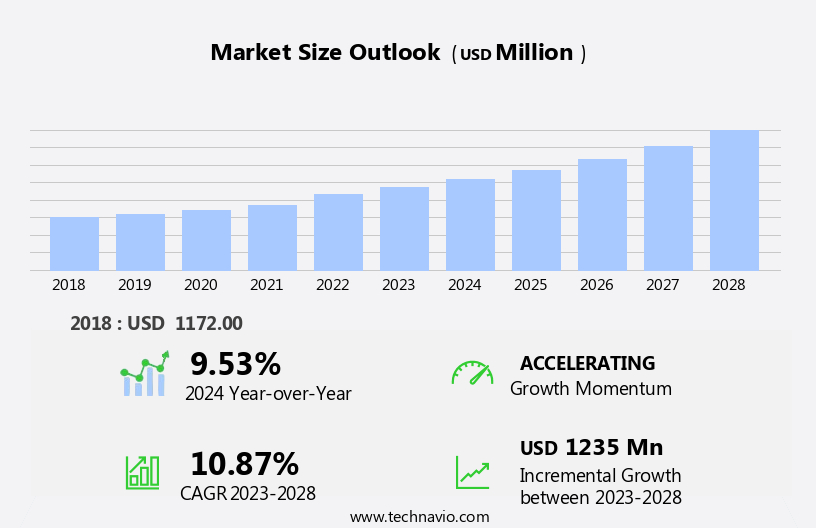
The anesthesia monitoring devices market size is forecast to increase by USD 1.24 billion at a CAGR of 10.87% between 2023 and 2028.

  • The market is experiencing significant growth due to the increasing number of surgeries that necessitate general anesthesia. The global surgery rate is projected to reach over 310 million procedures annually by 2027. This trend is driving the demand for advanced anesthesia monitoring devices that ensure patient safety and improve clinical trails outcomes. Another key driver in the market is the integration of anesthesia machines with hospital and medical technologies information management systems. This integration enables seamless data exchange and analysis, leading to improved patient care and operational efficiency. However, the high cost of anesthesia monitoring devices remains a significant challenge for market growth.
  • Despite the benefits, the high upfront investment required for purchasing these devices can be a barrier for smaller healthcare facilities and budget-conscious hospitals. The market is poised for growth due to the increasing number of surgeries requiring anesthesia and the integration of anesthesia machines with hospital information management systems. However, the high cost of these devices remains a significant challenge that market players must address to capitalize on the market opportunities and navigate the competitive landscape effectively. Companies can explore cost-effective solutions, such as leasing or rental models, to make these devices more accessible to a broader customer base.Additionally, collaborations and partnerships with hospitals and healthcare providers can help reduce the upfront investment required for purchasing these devices and facilitate market penetration.

What will be the Size of the Anesthesia Monitoring Devices Market during the forecast period?

Anesthesia Monitoring Devices Market Size

 Request Free Sample

  • The market is characterized by continuous evolution and dynamic market activities. Healthcare providers in various sectors, including emergency departments (ED), rely on advanced technologies to ensure patient safety during critical procedures. Anesthesia delivery systems integrated with temperature monitoring, pulse oximetry, and blood pressure monitoring devices are becoming increasingly common. Vital signs monitoring, intraoperative monitoring, and event logging are essential components of perioperative care. Trend analysis and data security are paramount in the development of anesthesia monitoring devices. Regulatory standards mandate the use of artificial intelligence (AI) and machine learning (ML) in patient monitoring, leading to the emergence of clinical decision support systems.
  • Cloud-based platforms and wireless technology facilitate remote monitoring, enabling real-time data access and analysis. Critical care settings, such as operating rooms (OR), require advanced monitoring capabilities, including electrocardiogram (ECG) and neurological monitoring. Patient comfort is a critical consideration, with mobile monitoring and non-invasive monitoring gaining popularity. Data analytics and clinical outcomes research are essential in optimizing anesthesia delivery and improving patient safety. Alarm management remains a significant challenge, with ongoing efforts to minimize false alarms and ensure timely intervention.

How is this Anesthesia Monitoring Devices Industry segmented?

The anesthesia monitoring devices industry research report provides comprehensive data (region-wise segment analysis), with forecasts and estimates in "USD million" for the period 2024-2028, as well as historical data from 2018-2022 for the following segments.

  • Type
    • Standalone
    • Integrated
  • End-user
    • Hospitals
    • Ambulatory service centers
    • Clinics
  • Application
    • Operating Rooms
    • Intensive Care Units
    • Emergency Rooms
  • Product Types
    • Basic Anesthesia Monitors
    • Advanced Anesthesia Monitors
    • Integrated Anesthesia Workstations
  • Geography
    • North America
      • US
      • Mexico
    • Europe
      • France
      • Germany
      • Italy
      • Spain
      • UK
    • Middle East and Africa
      • UAE
    • APAC
      • Australia
      • China
      • India
      • Japan
      • South Korea
    • South America
      • Brazil
    • Rest of World (ROW)

By Type Insights

The standalone segment is estimated to witness significant growth during the forecast period.

Anesthesia monitoring devices have gained significant traction in the healthcare industry due to advancements in technology, enabling the development of compact, standalone devices. These devices offer numerous benefits, including ease of use, portability, and cost-effectiveness, making them increasingly popular in various settings, such as emergency departments, operating rooms, and critical care units. Temperature monitoring, pulse oximetry, blood pressure monitoring, and vital signs monitoring are integral components of anesthesia delivery systems, ensuring patient safety and optimizing clinical outcomes. Intraoperative monitoring, trend analysis, event logging, and alarm management are essential features that enhance patient care and clinical decision-making.

Artificial intelligence, machine learning, and data analytics are revolutionizing anesthesia monitoring, providing real-time trend analysis and predictive capabilities. Cloud-based platforms and wireless technology enable remote monitoring and data sharing, improving collaboration among healthcare providers and streamlining workflows. Regulatory standards and data security are critical considerations in the market. The bispectral index, electroencephalogram, and neurological monitoring are essential for assessing patient depth of anesthesia and neurological status during surgery. Perioperative care, clinical decision support, and patient comfort are key priorities in the development of anesthesia monitoring devices. Mobile monitoring and non-invasive monitoring technologies offer added flexibility and convenience for healthcare providers and patients alike.

The market is expected to grow significantly, driven by the increasing demand for portable, user-friendly devices and the expanding home healthcare market. Standalone anesthesia monitoring devices are expected to grow at a faster pace due to their versatility and applicability in various healthcare settings.

Anesthesia Monitoring Devices Market Size

Request Free Sample

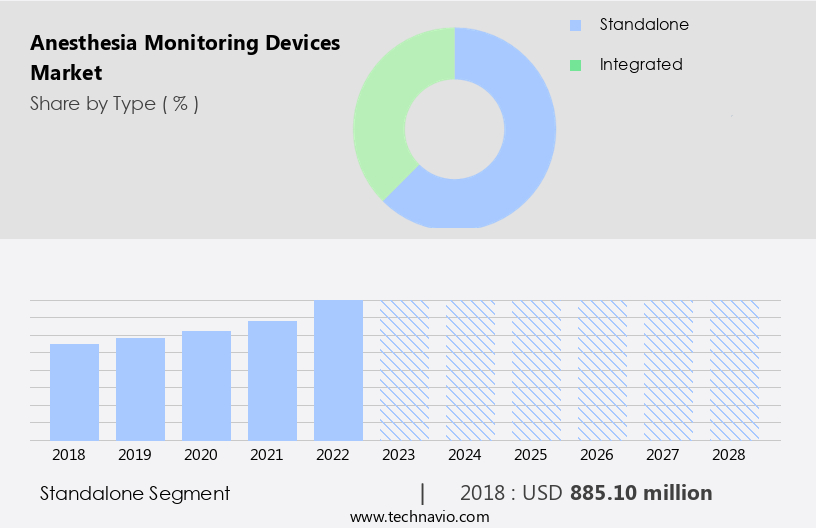
The Standalone segment was valued at USD 885.10 billion in 2018 and showed a gradual increase during the forecast period.
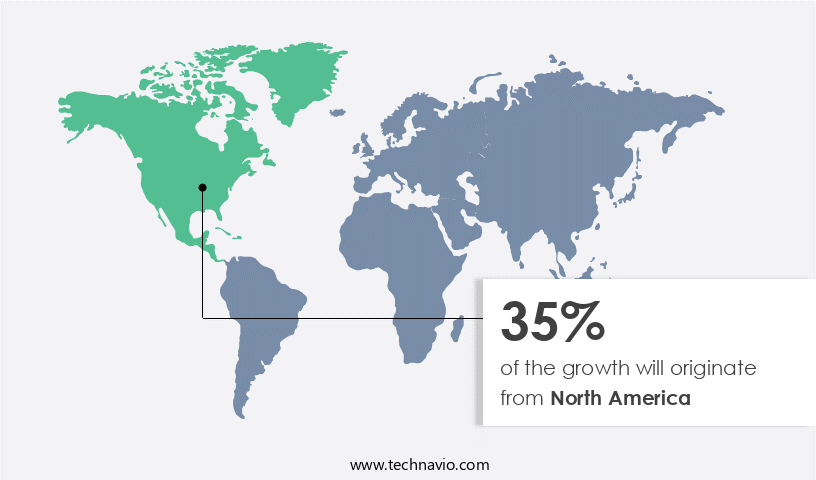
Regional Analysis

North America is estimated to contribute 35% to the growth of the global market during the forecast period.Technavio's analysts have elaborately explained the regional trends and drivers that shape the market during the forecast period.

Anesthesia Monitoring Devices Market Share by Geography

 Request Free Sample

The market in North America is experiencing significant growth, with the US and Canada being the major revenue contributors. This expansion is driven by several factors, including the enhancement of healthcare infrastructure, the rising number of surgeries conducted under general anesthesia, and the increasing prevalence of chronic diseases and their associated risk factors. The growing number of hospitals and ambulatory surgery centers (ASCs) in the region is also contributing to the market's growth. In particular, the US has seen a surge in the number of ASCs, leading to an increase in the number of surgeries performed in developed countries.

Advancements in technology have significantly impacted the market. Patient safety is a top priority, leading to the adoption of devices that offer real-time monitoring of vital signs, including temperature, blood pressure, and pulse oximetry. Intraoperative monitoring, neurological monitoring, and electrocardiogram (ECG) are essential for ensuring patient safety during surgeries. Moreover, cloud-based platforms, wireless technology, and machine learning (ML) algorithms are transforming patient monitoring, enabling trend analysis, event logging, and clinical decision support. Data security and regulatory standards are critical considerations in the market. With the increasing adoption of digital technologies, data security has become a significant concern. Regulatory bodies are implementing stringent regulations to ensure patient safety and data privacy.

The Bispectral Index (BIS) is a widely used tool for monitoring anesthesia depth, ensuring optimal patient comfort and reducing the risk of complications. Perioperative care is a crucial aspect of patient safety, and anesthesia monitoring devices play a vital role in this process. Clinical outcomes are improved through the use of these devices, which provide accurate and timely information to healthcare providers. Remote monitoring and mobile monitoring are also gaining popularity, allowing for continuous monitoring of patients even after they leave the operating room (OR). In summary, the market in North America is witnessing robust growth, driven by factors such as improved healthcare infrastructure, an increasing number of surgeries, and advancements in technology. Patient safety, data security, and regulatory standards are critical considerations, and the market is expected to continue its growth trajectory in the coming years.

Market Dynamics

Our researchers analyzed the data with 2023 as the base year, along with the key drivers, trends, and challenges. A holistic analysis of drivers will help companies refine their marketing strategies to gain a competitive advantage.

The anesthesia monitoring devices market is advancing with smart technologies that improve patient outcomes across clinical environments. AI-powered anesthesia monitoring combines AI-powered monitoring with predictive algorithms to enhance surgical precision and patient safety. Devices now include wireless sensors for pediatric anesthesia, non-invasive monitors for ambulatory surgery, and portable devices for emergency procedures. These innovations use cloud data integration and cloud-based analytics for anesthesia for seamless data flow. Real-time analytics and real-time monitoring for cardiac surgery ensure continuous assessment. With IoT connectivity,electronic health records (EHR),  remote access systems, and digital interfaces, clinicians gain greater flexibility and control. Secure data encryption protects sensitive patient information. Standard solutions like anesthesia depth monitors for surgery, capnography systems for critical care, and pulse oximetry for veterinary applications remain vital. Enhanced efficiency is supported by integrated workstations for hospitals, built for streamlined operation and clinical reliability.

What are the key market drivers leading to the rise in the adoption of Anesthesia Monitoring Devices Industry?

  • The significant rise in the quantity of surgeries necessitating general anesthesia serves as the primary market driver. 
  • Anesthesia monitoring devices play a crucial role in ensuring patient safety during surgical procedures by continuously tracking vital signs such as temperature, pulse oximetry, and blood pressure. In healthcare settings, including emergency departments (EDs), anesthesia delivery systems are employed to administer general anesthesia for major surgeries, such as knee and hip replacements, heart surgeries, cancer treatments, brain surgeries, lung surgeries, and surgeries of major arteries. The US is a significant market for anesthesia monitoring devices due to the high number of surgical procedures performed annually. For instance, approximately 350,000 pacemakers and 120,000 implantable cardioverter-defibrillators (ICDs) are implanted in the US each year.
  • European countries, particularly Western Europe, also have a substantial demand for anesthesia monitoring devices, with around 14 new ICDs and 74 pacemakers implanted per 100,000 population in 2015. Effective alarm management is essential for anesthesia monitoring devices to ensure timely intervention in case of any abnormalities, thereby enhancing patient safety.

What are the market trends shaping the Anesthesia Monitoring Devices Industry?

  • Anesthesia machine integration with hospital information management systems is a significant trend in the healthcare industry. This technological advancement enhances operational efficiency and data accuracy by seamlessly merging anesthesia machine data with a centralized hospital database.
  • Anesthesia monitoring devices play a crucial role in ensuring patient safety during surgical procedures by continuously tracking vital signs and providing real-time data for intraoperative monitoring. New-age anesthesia machines offer advanced features, such as integrated trend analysis, event logging, and artificial intelligence (AI) capabilities, which enhance the accuracy and efficiency of patient monitoring in the operating room (OR). Anesthesia Information Management Systems (AIMS) are electronic health record (EHR) systems that seamlessly integrate with anesthesia machines and hospital information management systems (HIMS). These systems automatically collect and transmit data from the anesthesia machine to the patient's EHR, providing healthcare professionals with valuable insights for informed decision-making.
  • Moreover, some AIMS are integrated with Clinical Decision Support Systems (CDSS), which can alert healthcare providers of any potential issues or improper diagnoses, thereby improving patient care. Ensuring data security is paramount in these systems, making it essential for manufacturers to adhere to stringent data protection regulations.

What challenges does the Anesthesia Monitoring Devices Industry face during its growth?

  • The high cost of anesthesia monitoring devices poses a significant challenge to the growth of the industry. These devices are essential for ensuring patient safety during surgical procedures, but their exorbitant prices can limit access and affordability for healthcare providers. This issue, in turn, may hinder the expansion and advancement of the industry as a whole. 
  • Anesthesia monitoring devices play a crucial role in perioperative care by ensuring the safety and well-being of patients undergoing surgery. These devices provide real-time information on vital signs, including electrocardiogram (ECG), blood pressure, and oxygen saturation levels. Regulatory standards mandate the use of advanced monitoring technologies to maintain optimal patient care during critical care procedures. Clinical decision support systems integrated with cloud-based platforms and wireless technology enable remote monitoring and real-time data analysis, enhancing the efficiency and accuracy of anesthesia care. The bispectral index (BIS) is a widely used monitoring parameter that assesses the depth of anesthesia and facilitates optimal patient care.
  • Despite the benefits, the high cost of anesthesia monitoring devices and associated expenses on maintenance and consumables limit their adoption among end-users. The cost of anesthesia machines ranges from USD5,000 to USD100,000, and the typical product shelf life is 8 to 10 years. Only healthcare facilities with high patient volumes can afford the investment in advanced anesthesia machines. While anesthesia monitoring devices significantly contribute to improved patient outcomes and safety, their high cost and maintenance expenses remain a challenge for widespread adoption.

Exclusive Customer Landscape

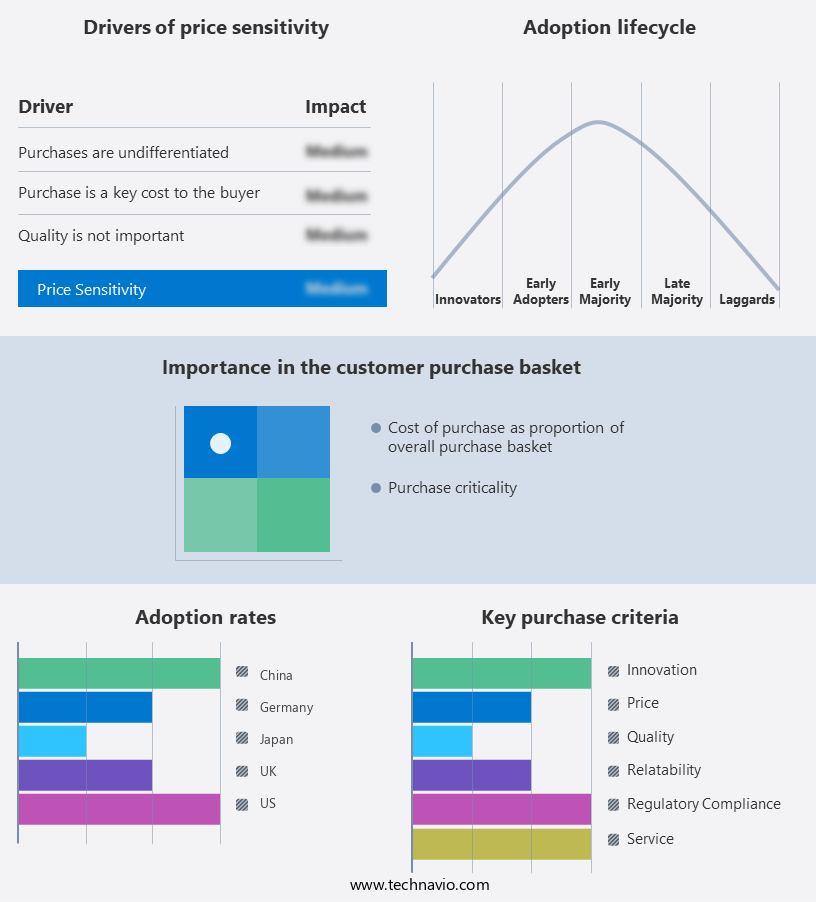
The anesthesia monitoring devices market forecasting report includes the adoption lifecycle of the market, covering from the innovator's stage to the laggard's stage. It focuses on adoption rates in different regions based on penetration. Furthermore, the anesthesia monitoring devices market report also includes key purchase criteria and drivers of price sensitivity to help companies evaluate and develop their market growth analysis strategies.

Anesthesia Monitoring Devices Market Share by Geography

 Customer Landscape

Key Companies & Market Insights

Companies are implementing various strategies, such as strategic alliances, anesthesia monitoring devices market forecast, partnerships, mergers and acquisitions, geographical expansion, and product/service launches, to enhance their presence in the industry.

B. Braun Melsungen AG - The company specializes in advanced anesthesia monitoring solutions, including the B-Smart Injection Pressure Monitor and Stimuplex HNS12 Nerve Stimulator. These devices utilize innovative technology to ensure optimal patient safety and comfort during medical procedures. 

The industry research and growth report includes detailed analyses of the competitive landscape of the market and information about key companies, including:

  • B. Braun Melsungen AG
  • Becton Dickinson
  • Drägerwerk AG
  • Fisher & Paykel Healthcare
  • GE Healthcare
  • Getinge AB
  • Heyer Medical
  • Koninklijke Philips
  • Masimo Corporation
  • Medtronic PLC
  • Mindray Medical
  • Nihon Kohden
  • Nonin Medical
  • Omron Healthcare
  • Penlon Limited
  • Schiller AG
  • Shenzhen Comen
  • Smiths Medical
  • Spacelabs Healthcare

Qualitative and quantitative analysis of companies has been conducted to help clients understand the wider business environment as well as the strengths and weaknesses of key industry players. Data is qualitatively analyzed to categorize companies as pure play, category-focused, industry-focused, and diversified; it is quantitatively analyzed to categorize companies as dominant, leading, strong, tentative, and weak.

Recent Development and News in Anesthesia Monitoring Devices Market

  • In February 2024, Medtronic, a leading medical technology company, announced the launch of the SenSight Anesthesia System, an advanced anesthesia monitoring device that utilizes evoked potential monitoring technology to assess the depth of anesthesia and improve patient safety during surgeries (Medtronic Press Release, 2024).
  • In May 2025, GE Healthcare and Philips signed a strategic collaboration agreement to co-develop and commercialize integrated anesthesia monitoring solutions, combining GE Healthcare's anesthesia workstations with Philips' patient monitoring systems to offer enhanced functionality and improved patient care (GE Healthcare Press Release, 2025).
  • In October 2024, Masimo Corporation, a global leader in noninvasive monitoring technologies, secured a strategic investment of USD150 million from TPG Growth, a leading private equity firm, to expand its product portfolio and accelerate growth in the market (Masimo Press Release, 2024).
  • In January 2025, the U.S. Food and Drug Administration (FDA) granted clearance for the use of Nexus-2 Anesthesia Workstation by Smiths Medical, enabling the company to offer a more comprehensive solution for anesthesia providers, featuring advanced gas monitoring, anesthesia delivery, and patient monitoring capabilities (Smiths Medical Press Release, 2025).

Research Analyst Overview

The anesthesia monitoring market is witnessing significant advancements, driven by the integration of personalized monitoring and hemodynamic solutions. Patient education and pharmacokinetic modeling enable customized care, while operator training ensures optimal performance. Nerve stimulation and patient engagement enhance safety and improve quality. Closed-loop anesthesia systems reduce alert fatigue and drug interactions, minimizing false alarms and risks. Performance optimization through wearable sensors and cardiac output monitoring enables precision medicine and predictive analytics.

The anesthesia monitoring devices market is undergoing rapid technological transformation, driven by the integration of intelligent systems and connectivity solutions. AI-Powered Monitoring enhances clinical decision-making with advanced Predictive Algorithms, offering real-time insights into patient vitals. Devices equipped with Wireless Sensors and Non-Invasive Technology are increasingly used in both pediatric and adult procedures, ensuring comfort and accuracy. Cloud Data Integration and Real-Time Analytics enable instant access to critical patient data, improving outcomes and workflow efficiency. Modern systems also feature IoT Connectivity, allowing seamless communication across devices and platforms. Digital Interfaces simplify operation and data visualization, while Secure Data Encryption ensures patient information remains protected. Additionally, Remote Access Systems give clinicians the flexibility to monitor patients from various locations, supporting continuous care in both hospital and ambulatory settings. These innovations are shaping a smarter, safer future for anesthesia delivery and patient monitoring.

Transcutaneous pacing and EEG monitoring expand monitoring capabilities, aligning with virtual care and remote patient care trends. Ventilation management and alarm prioritization systems streamline workflows and boost patient satisfaction. Biometric data integration and automated anesthesia delivery further enhance the market's potential.

Dive into Technavio's robust research methodology, blending expert interviews, extensive data synthesis, and validated models for unparalleled Anesthesia Monitoring Devices Market insights. See full methodology.

Market Scope

Report Coverage

Details

Page number

173

Base year

2023

Historic period

2018-2022

Forecast period

2024-2028

Growth momentum & CAGR

Accelerate at a CAGR of 10.87%

Market growth 2024-2028

USD 1235 million

Market structure

Fragmented

YoY growth 2023-2024(%)

9.53

Key countries

US, China, Germany, Japan, UK, Australia, India, France, Brazil, UAE, Rest of World (ROW), Saudi Arabia, France, South Korea, Mexico, Italy, and Spain

Competitive landscape

Leading Companies, Market Positioning of Companies, Competitive Strategies, and Industry Risks

Request Free Sample

What are the Key Data Covered in this Anesthesia Monitoring Devices Market Research and Growth Report?

  • CAGR of the Anesthesia Monitoring Devices industry during the forecast period
  • Detailed information on factors that will drive the growth and forecasting between 2024 and 2028
  • Precise estimation of the size of the market and its contribution of the industry in focus to the parent market
  • Accurate predictions about upcoming growth and trends and changes in consumer behaviour
  • Growth of the market across North America, Europe, Asia, and Rest of World (ROW)
  • Thorough analysis of the market's competitive landscape and detailed information about companies
  • Comprehensive analysis of factors that will challenge the anesthesia monitoring devices market growth of industry companies

We can help! Our analysts can customize this anesthesia monitoring devices market research report to meet your requirements.

Get in touch

1 Executive Summary

  • 1.1 Market overview
    • Executive Summary - Chart on Market Overview
    • Executive Summary - Data Table on Market Overview
    • Executive Summary - Chart on Global Market Characteristics
    • Executive Summary - Chart on Market by Geography
    • Executive Summary - Chart on Market Segmentation by Type
    • Executive Summary - Chart on Market Segmentation by End-user
    • Executive Summary - Chart on Incremental Growth
    • Executive Summary - Data Table on Incremental Growth
    • Executive Summary - Chart on Company Market Positioning

2 Market Landscape

  • 2.1 Market ecosystem
    • Parent Market
    • Data Table on - Parent Market
  • 2.2 Market characteristics
    • Market characteristics analysis
  • 2.3 Value chain analysis
    • Value Chain Analysis

3 Market Sizing

  • 3.1 Market definition
    • Offerings of companies included in the market definition
  • 3.2 Market segment analysis
    • Market segments
  • 3.3 Market size 2023
    • 3.4 Market outlook: Forecast for 2023-2028
      • Chart on Global - Market size and forecast 2023-2028 ($ million)
      • Data Table on Global - Market size and forecast 2023-2028 ($ million)
      • Chart on Global Market: Year-over-year growth 2023-2028 (%)
      • Data Table on Global Market: Year-over-year growth 2023-2028 (%)

    4 Historic Market Size

    • 4.1 Global Anesthesia Monitoring Devices Market 2018 - 2022
      • Historic Market Size - Data Table on Global Anesthesia Monitoring Devices Market 2018 - 2022 ($ million)
    • 4.2 Type segment analysis 2018 - 2022
      • Historic Market Size - Type Segment 2018 - 2022 ($ million)
    • 4.3 End-user segment analysis 2018 - 2022
      • Historic Market Size - End-user Segment 2018 - 2022 ($ million)
    • 4.4 Geography segment analysis 2018 - 2022
      • Historic Market Size - Geography Segment 2018 - 2022 ($ million)
    • 4.5 Country segment analysis 2018 - 2022
      • Historic Market Size - Country Segment 2018 - 2022 ($ million)

    5 Five Forces Analysis

    • 5.1 Five forces summary
      • Five forces analysis - Comparison between 2023 and 2028
    • 5.2 Bargaining power of buyers
      • Bargaining power of buyers - Impact of key factors 2023 and 2028
    • 5.3 Bargaining power of suppliers
      • Bargaining power of suppliers - Impact of key factors in 2023 and 2028
    • 5.4 Threat of new entrants
      • Threat of new entrants - Impact of key factors in 2023 and 2028
    • 5.5 Threat of substitutes
      • Threat of substitutes - Impact of key factors in 2023 and 2028
    • 5.6 Threat of rivalry
      • Threat of rivalry - Impact of key factors in 2023 and 2028
    • 5.7 Market condition
      • Chart on Market condition - Five forces 2023 and 2028

    6 Market Segmentation by Type

    • 6.1 Market segments
      • Chart on Type - Market share (2023-2028) (%)
      • Data Table on Type - Market share (2023-2028) (%)
    • 6.2 Comparison by Type
      • Chart on Comparison by Type
      • Data Table on Comparison by Type
    • 6.3 Standalone - Market size and forecast (2023-2028)
      • Chart on Standalone - Market size and forecast (2023-2028) ($ million)
      • Data Table on Standalone - Market size and forecast (2023-2028) ($ million)
      • Chart on Standalone - Year-over-year growth (2023-2028) (%)
      • Data Table on Standalone - Year-over-year growth (2023-2028) (%)
    • 6.4 Integrated - Market size and forecast (2023-2028)
      • Chart on Integrated - Market size and forecast (2023-2028) ($ million)
      • Data Table on Integrated - Market size and forecast (2023-2028) ($ million)
      • Chart on Integrated - Year-over-year growth (2023-2028) (%)
      • Data Table on Integrated - Year-over-year growth (2023-2028) (%)
    • 6.5 Market opportunity by Type
      • Market opportunity by Type ($ million)
      • Data Table on Market opportunity by Type ($ million)

    7 Market Segmentation by End-user

    • 7.1 Market segments
      • Chart on End-user - Market share (2023-2028) (%)
      • Data Table on End-user - Market share (2023-2028) (%)
    • 7.2 Comparison by End-user
      • Chart on Comparison by End-user
      • Data Table on Comparison by End-user
    • 7.3 Hospitals - Market size and forecast (2023-2028)
      • Chart on Hospitals - Market size and forecast (2023-2028) ($ million)
      • Data Table on Hospitals - Market size and forecast (2023-2028) ($ million)
      • Chart on Hospitals - Year-over-year growth (2023-2028) (%)
      • Data Table on Hospitals - Year-over-year growth (2023-2028) (%)
    • 7.4 Ambulatory service centers - Market size and forecast (2023-2028)
      • Chart on Ambulatory service centers - Market size and forecast (2023-2028) ($ million)
      • Data Table on Ambulatory service centers - Market size and forecast (2023-2028) ($ million)
      • Chart on Ambulatory service centers - Year-over-year growth (2023-2028) (%)
      • Data Table on Ambulatory service centers - Year-over-year growth (2023-2028) (%)
    • 7.5 Clinics - Market size and forecast (2023-2028)
      • Chart on Clinics - Market size and forecast (2023-2028) ($ million)
      • Data Table on Clinics - Market size and forecast (2023-2028) ($ million)
      • Chart on Clinics - Year-over-year growth (2023-2028) (%)
      • Data Table on Clinics - Year-over-year growth (2023-2028) (%)
    • 7.6 Market opportunity by End-user
      • Market opportunity by End-user ($ million)
      • Data Table on Market opportunity by End-user ($ million)

    8 Market Segmentation by Application

    • 8.1 Market segments
      • Chart on Application - Market share (2023-2028) (%)
      • Data Table on Application - Market share (2023-2028) (%)
    • 8.2 Comparison by Application
      • Chart on Comparison by Application
      • Data Table on Comparison by Application
    • 8.3 Operating Rooms - Market size and forecast (2023-2028)
      • Chart on Operating Rooms - Market size and forecast (2023-2028) ($ million)
      • Data Table on Operating Rooms - Market size and forecast (2023-2028) ($ million)
      • Chart on Operating Rooms - Year-over-year growth (2023-2028) (%)
      • Data Table on Operating Rooms - Year-over-year growth (2023-2028) (%)
    • 8.4 Intensive Care Units - Market size and forecast (2023-2028)
      • Chart on Intensive Care Units - Market size and forecast (2023-2028) ($ million)
      • Data Table on Intensive Care Units - Market size and forecast (2023-2028) ($ million)
      • Chart on Intensive Care Units - Year-over-year growth (2023-2028) (%)
      • Data Table on Intensive Care Units - Year-over-year growth (2023-2028) (%)
    • 8.5 Emergency Rooms - Market size and forecast (2023-2028)
      • Chart on Emergency Rooms - Market size and forecast (2023-2028) ($ million)
      • Data Table on Emergency Rooms - Market size and forecast (2023-2028) ($ million)
      • Chart on Emergency Rooms - Year-over-year growth (2023-2028) (%)
      • Data Table on Emergency Rooms - Year-over-year growth (2023-2028) (%)
    • 8.6 Market opportunity by Application
      • Market opportunity by Application ($ million)
      • Data Table on Market opportunity by Application ($ million)

    9 Market Segmentation by Product Types

    • 9.1 Market segments
      • Chart on Product Types - Market share (2023-2028) (%)
      • Data Table on Product Types - Market share (2023-2028) (%)
    • 9.2 Comparison by Product Types
      • Chart on Comparison by Product Types
      • Data Table on Comparison by Product Types
    • 9.3 Basic Anesthesia Monitors - Market size and forecast (2023-2028)
      • Chart on Basic Anesthesia Monitors - Market size and forecast (2023-2028) ($ million)
      • Data Table on Basic Anesthesia Monitors - Market size and forecast (2023-2028) ($ million)
      • Chart on Basic Anesthesia Monitors - Year-over-year growth (2023-2028) (%)
      • Data Table on Basic Anesthesia Monitors - Year-over-year growth (2023-2028) (%)
    • 9.4 Advanced Anesthesia Monitors - Market size and forecast (2023-2028)
      • Chart on Advanced Anesthesia Monitors - Market size and forecast (2023-2028) ($ million)
      • Data Table on Advanced Anesthesia Monitors - Market size and forecast (2023-2028) ($ million)
      • Chart on Advanced Anesthesia Monitors - Year-over-year growth (2023-2028) (%)
      • Data Table on Advanced Anesthesia Monitors - Year-over-year growth (2023-2028) (%)
    • 9.5 Integrated Anesthesia Workstations - Market size and forecast (2023-2028)
      • Chart on Integrated Anesthesia Workstations - Market size and forecast (2023-2028) ($ million)
      • Data Table on Integrated Anesthesia Workstations - Market size and forecast (2023-2028) ($ million)
      • Chart on Integrated Anesthesia Workstations - Year-over-year growth (2023-2028) (%)
      • Data Table on Integrated Anesthesia Workstations - Year-over-year growth (2023-2028) (%)
    • 9.6 Market opportunity by Product Types
      • Market opportunity by Product Types ($ million)
      • Data Table on Market opportunity by Product Types ($ million)

    10 Customer Landscape

    • 10.1 Customer landscape overview
      • Analysis of price sensitivity, lifecycle, customer purchase basket, adoption rates, and purchase criteria

    11 Geographic Landscape

    • 11.1 Geographic segmentation
      • Chart on Market share by geography 2023-2028 (%)
      • Data Table on Market share by geography 2023-2028 (%)
    • 11.2 Geographic comparison
      • Chart on Geographic comparison
      • Data Table on Geographic comparison
    • 11.3 North America - Market size and forecast 2023-2028
      • Chart on North America - Market size and forecast 2023-2028 ($ million)
      • Data Table on North America - Market size and forecast 2023-2028 ($ million)
      • Chart on North America - Year-over-year growth 2023-2028 (%)
      • Data Table on North America - Year-over-year growth 2023-2028 (%)
    • 11.4 Europe - Market size and forecast 2023-2028
      • Chart on Europe - Market size and forecast 2023-2028 ($ million)
      • Data Table on Europe - Market size and forecast 2023-2028 ($ million)
      • Chart on Europe - Year-over-year growth 2023-2028 (%)
      • Data Table on Europe - Year-over-year growth 2023-2028 (%)
    • 11.5 Asia - Market size and forecast 2023-2028
      • Chart on Asia - Market size and forecast 2023-2028 ($ million)
      • Data Table on Asia - Market size and forecast 2023-2028 ($ million)
      • Chart on Asia - Year-over-year growth 2023-2028 (%)
      • Data Table on Asia - Year-over-year growth 2023-2028 (%)
    • 11.6 Rest of World (ROW) - Market size and forecast 2023-2028
      • Chart on Rest of World (ROW) - Market size and forecast 2023-2028 ($ million)
      • Data Table on Rest of World (ROW) - Market size and forecast 2023-2028 ($ million)
      • Chart on Rest of World (ROW) - Year-over-year growth 2023-2028 (%)
      • Data Table on Rest of World (ROW) - Year-over-year growth 2023-2028 (%)
    • 11.7 US - Market size and forecast 2023-2028
      • Chart on US - Market size and forecast 2023-2028 ($ million)
      • Data Table on US - Market size and forecast 2023-2028 ($ million)
      • Chart on US - Year-over-year growth 2023-2028 (%)
      • Data Table on US - Year-over-year growth 2023-2028 (%)
    • 11.8 Germany - Market size and forecast 2023-2028
      • Chart on Germany - Market size and forecast 2023-2028 ($ million)
      • Data Table on Germany - Market size and forecast 2023-2028 ($ million)
      • Chart on Germany - Year-over-year growth 2023-2028 (%)
      • Data Table on Germany - Year-over-year growth 2023-2028 (%)
    • 11.9 UK - Market size and forecast 2023-2028
      • Chart on UK - Market size and forecast 2023-2028 ($ million)
      • Data Table on UK - Market size and forecast 2023-2028 ($ million)
      • Chart on UK - Year-over-year growth 2023-2028 (%)
      • Data Table on UK - Year-over-year growth 2023-2028 (%)
    • 11.10 China - Market size and forecast 2023-2028
      • Chart on China - Market size and forecast 2023-2028 ($ million)
      • Data Table on China - Market size and forecast 2023-2028 ($ million)
      • Chart on China - Year-over-year growth 2023-2028 (%)
      • Data Table on China - Year-over-year growth 2023-2028 (%)
    • 11.11 Japan - Market size and forecast 2023-2028
      • Chart on Japan - Market size and forecast 2023-2028 ($ million)
      • Data Table on Japan - Market size and forecast 2023-2028 ($ million)
      • Chart on Japan - Year-over-year growth 2023-2028 (%)
      • Data Table on Japan - Year-over-year growth 2023-2028 (%)
    • 11.12 Market opportunity by geography
      • Market opportunity by geography ($ million)
      • Data Tables on Market opportunity by geography ($ million)
    • 11.13 Australia - Market size and forecast (2023-2028)
      • Chart on Australia - Market size and forecast (2023-2028) ($ million)
      • Data Table on Australia - Market size and forecast (2023-2028) ($ million)
      • Chart on Australia - Year-over-year growth (2023-2028) (%)
      • Data Table on Australia - Year-over-year growth (2023-2028) (%)
    • 11.14 India - Market size and forecast (2023-2028)
      • Chart on India - Market size and forecast (2023-2028) ($ million)
      • Data Table on India - Market size and forecast (2023-2028) ($ million)
      • Chart on India - Year-over-year growth (2023-2028) (%)
      • Data Table on India - Year-over-year growth (2023-2028) (%)
    • 11.15 France - Market size and forecast (2023-2028)
      • Chart on France - Market size and forecast (2023-2028) ($ million)
      • Data Table on France - Market size and forecast (2023-2028) ($ million)
      • Chart on France - Year-over-year growth (2023-2028) (%)
      • Data Table on France - Year-over-year growth (2023-2028) (%)
    • 11.16 Brazil - Market size and forecast (2023-2028)
      • Chart on Brazil - Market size and forecast (2023-2028) ($ million)
      • Data Table on Brazil - Market size and forecast (2023-2028) ($ million)
      • Chart on Brazil - Year-over-year growth (2023-2028) (%)
      • Data Table on Brazil - Year-over-year growth (2023-2028) (%)
    • 11.17 UAE - Market size and forecast (2023-2028)
      • Chart on UAE - Market size and forecast (2023-2028) ($ million)
      • Data Table on UAE - Market size and forecast (2023-2028) ($ million)
      • Chart on UAE - Year-over-year growth (2023-2028) (%)
      • Data Table on UAE - Year-over-year growth (2023-2028) (%)
    • 11.18 Saudi Arabia - Market size and forecast (2023-2028)
      • Chart on Saudi Arabia - Market size and forecast (2023-2028) ($ million)
      • Data Table on Saudi Arabia - Market size and forecast (2023-2028) ($ million)
      • Chart on Saudi Arabia - Year-over-year growth (2023-2028) (%)
      • Data Table on Saudi Arabia - Year-over-year growth (2023-2028) (%)
    • 11.19 South Korea - Market size and forecast (2023-2028)
      • Chart on South Korea - Market size and forecast (2023-2028) ($ million)
      • Data Table on South Korea - Market size and forecast (2023-2028) ($ million)
      • Chart on South Korea - Year-over-year growth (2023-2028) (%)
      • Data Table on South Korea - Year-over-year growth (2023-2028) (%)
    • 11.20 Mexico - Market size and forecast (2023-2028)
      • Chart on Mexico - Market size and forecast (2023-2028) ($ million)
      • Data Table on Mexico - Market size and forecast (2023-2028) ($ million)
      • Chart on Mexico - Year-over-year growth (2023-2028) (%)
      • Data Table on Mexico - Year-over-year growth (2023-2028) (%)
    • 11.21 Italy - Market size and forecast (2023-2028)
      • Chart on Italy - Market size and forecast (2023-2028) ($ million)
      • Data Table on Italy - Market size and forecast (2023-2028) ($ million)
      • Chart on Italy - Year-over-year growth (2023-2028) (%)
      • Data Table on Italy - Year-over-year growth (2023-2028) (%)
    • 11.22 Spain - Market size and forecast (2023-2028)
      • Chart on Spain - Market size and forecast (2023-2028) ($ million)
      • Data Table on Spain - Market size and forecast (2023-2028) ($ million)
      • Chart on Spain - Year-over-year growth (2023-2028) (%)
      • Data Table on Spain - Year-over-year growth (2023-2028) (%)

    12 Drivers, Challenges, and Opportunity/Restraints

    • 12.1 Market drivers
      • 12.2 Market challenges
        • 12.3 Impact of drivers and challenges
          • Impact of drivers and challenges in 2023 and 2028
        • 12.4 Market opportunities/restraints

          13 Competitive Landscape

          • 13.1 Overview
            • 13.2 Competitive Landscape
              • Overview on criticality of inputs and factors of differentiation
            • 13.3 Landscape disruption
              • Overview on factors of disruption
            • 13.4 Industry risks
              • Impact of key risks on business

            14 Competitive Analysis

            • 14.1 Companies profiled
              • Companies covered
            • 14.2 Market positioning of companies
              • Matrix on companies position and classification
            • 14.3 B. Braun Melsungen AG
              • B. Braun Melsungen AG - Overview
              • B. Braun Melsungen AG - Product / Service
              • B. Braun Melsungen AG - Key offerings
            • 14.4 Becton Dickinson
              • Becton Dickinson - Overview
              • Becton Dickinson - Product / Service
              • Becton Dickinson - Key offerings
            • 14.5 Drägerwerk AG
              • Drägerwerk AG - Overview
              • Drägerwerk AG - Product / Service
              • Drägerwerk AG - Key offerings
            • 14.6 Fisher & Paykel Healthcare
              • Fisher & Paykel Healthcare - Overview
              • Fisher & Paykel Healthcare - Product / Service
              • Fisher & Paykel Healthcare - Key offerings
            • 14.7 GE Healthcare
              • GE Healthcare - Overview
              • GE Healthcare - Product / Service
              • GE Healthcare - Key offerings
            • 14.8 Getinge AB
              • Getinge AB - Overview
              • Getinge AB - Product / Service
              • Getinge AB - Key offerings
            • 14.9 Heyer Medical
              • Heyer Medical - Overview
              • Heyer Medical - Product / Service
              • Heyer Medical - Key offerings
            • 14.10 Koninklijke Philips
              • Koninklijke Philips - Overview
              • Koninklijke Philips - Product / Service
              • Koninklijke Philips - Key offerings
            • 14.11 Masimo Corporation
              • Masimo Corporation - Overview
              • Masimo Corporation - Product / Service
              • Masimo Corporation - Key offerings
            • 14.12 Medtronic PLC
              • Medtronic PLC - Overview
              • Medtronic PLC - Product / Service
              • Medtronic PLC - Key offerings
            • 14.13 Mindray Medical
              • Mindray Medical - Overview
              • Mindray Medical - Product / Service
              • Mindray Medical - Key offerings
            • 14.14 Nihon Kohden
              • Nihon Kohden - Overview
              • Nihon Kohden - Product / Service
              • Nihon Kohden - Key offerings
            • 14.15 Nonin Medical
              • Nonin Medical - Overview
              • Nonin Medical - Product / Service
              • Nonin Medical - Key offerings
            • 14.16 Omron Healthcare
              • Omron Healthcare - Overview
              • Omron Healthcare - Product / Service
              • Omron Healthcare - Key offerings
            • 14.17 Penlon Limited
              • Penlon Limited - Overview
              • Penlon Limited - Product / Service
              • Penlon Limited - Key offerings
            • 14.18 Schiller AG
              • Schiller AG - Overview
              • Schiller AG - Product / Service
              • Schiller AG - Key offerings
            • 14.19 Shenzhen Comen
              • Shenzhen Comen - Overview
              • Shenzhen Comen - Product / Service
              • Shenzhen Comen - Key offerings
            • 14.20 Smiths Medical
              • Smiths Medical - Overview
              • Smiths Medical - Product / Service
              • Smiths Medical - Key offerings
            • 14.21 Spacelabs Healthcare
              • Spacelabs Healthcare - Overview
              • Spacelabs Healthcare - Product / Service
              • Spacelabs Healthcare - Key offerings
            • 14.22 B.Braun SE
              • B.Braun SE - Overview
              • B.Braun SE - Product / Service
              • B.Braun SE - Key offerings
            • 14.23 Becton Dickinson and Co.
              • Becton Dickinson and Co. - Overview
              • Becton Dickinson and Co. - Product / Service
              • Becton Dickinson and Co. - Key offerings
            • 14.24 Beijing Aeonmed Co. Ltd.
              • Beijing Aeonmed Co. Ltd. - Overview
              • Beijing Aeonmed Co. Ltd. - Product / Service
              • Beijing Aeonmed Co. Ltd. - Key offerings
            • 14.25 BPL MEDICAL TECHNOLOGIES Pvt. Ltd.
              • BPL MEDICAL TECHNOLOGIES Pvt. Ltd. - Overview
              • BPL MEDICAL TECHNOLOGIES Pvt. Ltd. - Product / Service
              • BPL MEDICAL TECHNOLOGIES Pvt. Ltd. - Key offerings
            • 14.26 Compumedics Ltd.
              • Compumedics Ltd. - Overview
              • Compumedics Ltd. - Product / Service
              • Compumedics Ltd. - Key offerings
            • 14.27 Dixion Vertrieb medizinischer Gerate GmbH
              • Dixion Vertrieb medizinischer Gerate GmbH - Overview
              • Dixion Vertrieb medizinischer Gerate GmbH - Product / Service
              • Dixion Vertrieb medizinischer Gerate GmbH - Key offerings
            • 14.28 Dragerwerk AG and Co. KGaA
              • Dragerwerk AG and Co. KGaA - Overview
              • Dragerwerk AG and Co. KGaA - Product / Service
              • Dragerwerk AG and Co. KGaA - Key offerings
            • 14.29 Fisher and Paykel Healthcare Corp. Ltd.
              • Fisher and Paykel Healthcare Corp. Ltd. - Overview
              • Fisher and Paykel Healthcare Corp. Ltd. - Product / Service
              • Fisher and Paykel Healthcare Corp. Ltd. - Key offerings
            • 14.30 Fresenius SE and Co. KGaA
              • Fresenius SE and Co. KGaA - Overview
              • Fresenius SE and Co. KGaA - Product / Service
              • Fresenius SE and Co. KGaA - Key offerings
            • 14.31 Fukuda Denshi Co. Ltd
              • Fukuda Denshi Co. Ltd - Overview
              • Fukuda Denshi Co. Ltd - Product / Service
              • Fukuda Denshi Co. Ltd - Key offerings
            • 14.32 General Electric Co.
              • General Electric Co. - Overview
              • General Electric Co. - Product / Service
              • General Electric Co. - Key offerings
            • 14.33 Getinge AB
              • Getinge AB - Overview
              • Getinge AB - Product / Service
              • Getinge AB - Key offerings
            • 14.34 Infinium Medical Inc.
              • Infinium Medical Inc. - Overview
              • Infinium Medical Inc. - Product / Service
              • Infinium Medical Inc. - Key offerings
            • 14.35 Koninklijke Philips N.V.
              • Koninklijke Philips N.V. - Overview
              • Koninklijke Philips N.V. - Product / Service
              • Koninklijke Philips N.V. - Key offerings
            • 14.36 Masimo Corp.
              • Masimo Corp. - Overview
              • Masimo Corp. - Product / Service
              • Masimo Corp. - Key offerings
            • 14.37 Medtronic Plc
              • Medtronic Plc - Overview
              • Medtronic Plc - Product / Service
              • Medtronic Plc - Key offerings
            • 14.38 Nihon Kohden Corp.
              • Nihon Kohden Corp. - Overview
              • Nihon Kohden Corp. - Product / Service
              • Nihon Kohden Corp. - Key offerings
            • 14.39 SCHILLER AG
              • SCHILLER AG - Overview
              • SCHILLER AG - Product / Service
              • SCHILLER AG - Key offerings
            • 14.40 Shenzhen Mindray BioMedical Electronics Co. Ltd
              • Shenzhen Mindray BioMedical Electronics Co. Ltd - Overview
              • Shenzhen Mindray BioMedical Electronics Co. Ltd - Product / Service
              • Shenzhen Mindray BioMedical Electronics Co. Ltd - Key offerings
            • 14.41 Siemens AG
              • Siemens AG - Overview
              • Siemens AG - Product / Service
              • Siemens AG - Key offerings

            15 Appendix

            • 15.1 Scope of the report
              • 15.2 Inclusions and exclusions checklist
                • Inclusions checklist
                • Exclusions checklist
              • 15.3 Currency conversion rates for US$
                • Currency conversion rates for US$
              • 15.4 Research methodology
                • Research methodology
              • 15.5 Data procurement
                • Information sources
              • 15.6 Data validation
                • Data validation
              • 15.7 Validation techniques employed for market sizing
                • Validation techniques employed for market sizing
              • 15.8 Data synthesis
                • Data synthesis
              • 15.9 360 degree market analysis
                • 360 degree market analysis
              • 15.10 List of abbreviations
                • List of abbreviations

              Research Methodology

              Technavio presents a detailed picture of the market by way of study, synthesis, and summation of data from multiple sources. The analysts have presented the various facets of the market with a particular focus on identifying the key industry influencers. The data thus presented is comprehensive, reliable, and the result of extensive research, both primary and secondary.

              INFORMATION SOURCES

              Primary sources

              • Manufacturers and suppliers
              • Channel partners
              • Industry experts
              • Strategic decision makers

              Secondary sources

              • Industry journals and periodicals
              • Government data
              • Financial reports of key industry players
              • Historical data
              • Press releases

              DATA ANALYSIS

              Data Synthesis

              • Collation of data
              • Estimation of key figures
              • Analysis of derived insights

              Data Validation

              • Triangulation with data models
              • Reference against proprietary databases
              • Corroboration with industry experts

              REPORT WRITING

              Qualitative

              • Market drivers
              • Market challenges
              • Market trends
              • Five forces analysis

              Quantitative

              • Market size and forecast
              • Market segmentation
              • Geographical insights
              • Competitive landscape

              Interested in this report?

              Get your sample now to see our research methodology and insights!

              Download Now

              Frequently Asked Questions

              Anesthesia Monitoring Devices market growth will increase by $ 1235 mn during 2024-2028 .

              The Anesthesia Monitoring Devices market is expected to grow at a CAGR of 10.87% during 2024-2028 .

              Anesthesia Monitoring Devices market is segmented by Type( Standalone, Integrated) End-user( Hospitals, Ambulatory service centers, Clinics)

              B. Braun Melsungen AG, Becton Dickinson, Drägerwerk AG, Fisher & Paykel Healthcare, GE Healthcare, Getinge AB, Heyer Medical, Koninklijke Philips, Masimo Corporation, Medtronic PLC, Mindray Medical, Nihon Kohden, Nonin Medical, Omron Healthcare, Penlon Limited, Schiller AG, Shenzhen Comen, Smiths Medical, Spacelabs Healthcare are a few of the key vendors in the Anesthesia Monitoring Devices market.

              North America will register the highest growth rate of 35% among the other regions. Therefore, the Anesthesia Monitoring Devices market in North America is expected to garner significant business opportunities for the vendors during the forecast period.

              US, China, Germany, Japan, UK, Australia, India, France, Brazil, UAE, Rest of World (ROW), Saudi Arabia, France, South Korea, Mexico, Italy, Spain

              • Increasing number of surgeries requiring general anesthesiaGeneral anesthesia is administered to patients by medical practitioners to induce unconsciousness during surgery and for post-surgery pain management. It is usually used for major operations such as knee and hip replacements is the driving factor this market.
              • heart surgeries is the driving factor this market.
              • surgical procedures to treat cancer is the driving factor this market.
              • brain surgeries is the driving factor this market.
              • lung surgeries is the driving factor this market.
              • and surgeries of major arteries. Every year is the driving factor this market.
              • approximately 350 is the driving factor this market.
              • 000 pacemakers are implanted in the US. The US also has the highest rate of implantable cardioverter-defibrillator (ICD) implantations in the world. Every year is the driving factor this market.
              • approximately 120 is the driving factor this market.
              • 000 people in the US are implanted with ICDs. In addition is the driving factor this market.
              • in 2015 is the driving factor this market.
              • approximately 14 new ICDs and 74 pacemakers were implanted per 100 is the driving factor this market.
              • 000 population in Western Europe. Every year is the driving factor this market.
              • 18 is the driving factor this market.
              • 000 to 22 is the driving factor this market.
              • 000 cardiac rhythm management devices are implanted in Australia. The increasing prevalence of chronic conditions and diseases is leading to an increase in the number of surgeries. For instance is the driving factor this market.
              • the number of people with chronic conditions is the driving factor this market.
              • such as cancer and cardiac disease is the driving factor this market.
              • is increasing. For example is the driving factor this market.
              • a person with ovarian cancer may require a hysterectomy is the driving factor this market.
              • which is a surgical procedure to remove the uterus. According to Eurostat 2019 is the driving factor this market.
              • the Czech Republic and Lithuania in Europe witnessed a high number of hysterectomies in 2019. Similarly is the driving factor this market.
              • the number of bypass anastomosis procedures for heart revascularization was high in Serbia and Italy in 2019. In 2019 is the driving factor this market.
              • approximately 25 is the driving factor this market.
              • 000 people in China underwent surgery to implant artificial knees is the driving factor this market.
              • and this number is expected to increase to approximately more than 30 is the driving factor this market.
              • 000 by 2023. Many orthopedic and gastrointestinal surgeries such as hysterectomy is the driving factor this market.
              • appendectomy is the driving factor this market.
              • cholecystectomy is the driving factor this market.
              • and hip replacement are being performed annually in Europe is the driving factor this market.
              • which is the driving factor this market.
              • in turn is the driving factor this market.
              • will leverage the growth of the global anesthesia monitoring devices market during the forecast period. is the driving factor this market.

              The Anesthesia Monitoring Devices market vendors should focus on grabbing business opportunities from the Standalone segment as it accounted for the largest market share in the base year.