
Anti-Plagiarism Software For Education Sector Size 2025-2029
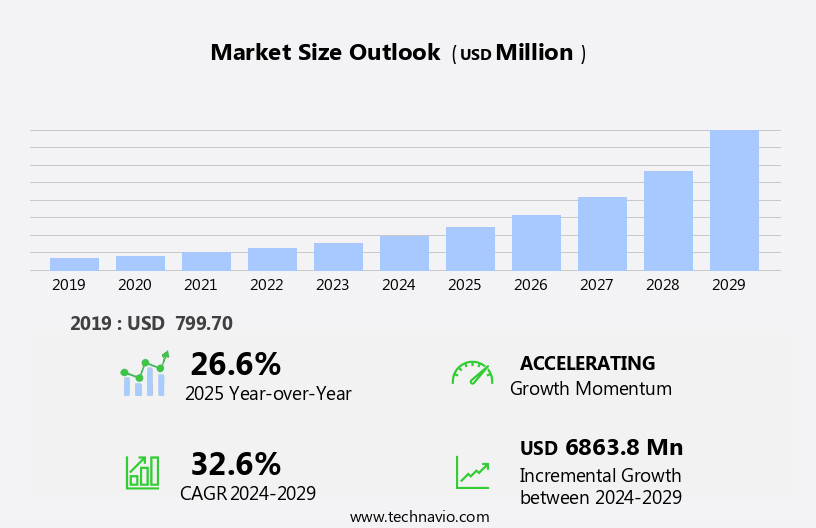
The anti-plagiarism software for education sector size is forecast to increase by USD 6.86 billion at a CAGR of 32.6% between 2024 and 2029.
- The Anti-Plagiarism Software Market in the education sector is witnessing significant growth due to increasing regulatory initiatives promoting academic integrity and open access to data. These factors have led to a swell in demand for robust plagiarism detection solutions. However, the availability of free anti-plagiarism software poses a challenge to market growth. Despite this, the market holds immense potential, with institutions recognizing the importance of maintaining academic honesty and ensuring the quality of research output. Regulatory hurdles, such as data privacy and security concerns, also impact adoption, necessitating solutions that adhere to stringent compliance standards. To capitalize on these opportunities and navigate challenges effectively, market participants must focus on offering advanced features, seamless integration, and robust data security.
- Additionally, partnerships with educational institutions and research organizations can help build credibility and expand market reach. Overall, the Anti-Plagiarism Software Market in the education sector is poised for growth, driven by the need to maintain academic integrity and comply with regulatory requirements. Neural networks and deep learning algorithms are used for contextual analysis and semantic similarity detection, enhancing automated grading and big data analysis.
What will be the Size of the Anti-Plagiarism Software For Education Sector during the forecast period?
- In the education sector, the demand for effective plagiarism prevention solutions continues to grow as educational research underscores the importance of academic honesty in online learning environments. Feedback systems that employ source tracking, image analysis, language models, and document analysis are at the forefront of this market, helping institutions ensure intellectual property protection and maintain research integrity. Plagiarism prevention tools are increasingly integrated into digital collaboration platforms, enabling real-time citation management and source attribution. Student engagement and instructor feedback are crucial components of blended learning, where digital and traditional teaching methods coalesce.
- Plagiarism prevention software that offers digital feedback and pattern recognition capabilities can significantly improve learning outcomes and promote academic honesty. Online learning platforms are increasingly adopting video analysis and source tracking to monitor copyright infringement and maintain research integrity. Data analytics and reference checking are also essential features, providing valuable insights into student performance and academic misconduct trends. As the education sector continues to evolve, plagiarism prevention solutions must adapt to the changing landscape of digital learning and collaboration. The integration of advanced technologies, such as neural networks and deep learning, promises to enhance the effectiveness of these tools and support the academic community in upholding the highest standards of research integrity.
How is this Anti-Plagiarism Software For Education Sector Industry segmented?
The anti-plagiarism software for education sector industry research report provides comprehensive data (region-wise segment analysis), with forecasts and estimates in "USD million" for the period 2025-2029, as well as historical data from 2019-2023 for the following segments.
- End-user
- Research institutions
- Academic institutions
- Deployment
- On-premises
- Cloud
- Type
- Text mining
- Integrated customization service
- Sector
- Large enterprises
- Small and medium enterprises
- Geography
- North America
- US
- Canada
- Mexico
- Europe
- France
- Germany
- UK
- APAC
- China
- India
- Japan
- South America
- Brazil
- Rest of World (ROW)
- North America
By End-user Insights
The research institutions segment is estimated to witness significant growth during the forecast period. In the education sector, the anti-plagiarism software market witnessed substantial growth in 2024, driven by the heightened importance of academic integrity and maintaining research quality within research institutions. These institutions rely on sophisticated anti-plagiarism solutions to compare submitted work against vast databases of academic papers, articles, and other sources, ensuring the originality of scholarly output. These tools not only identify potential plagiarism instances but also educate researchers and students on proper citation practices and originality. Advanced features such as source code analysis, similarity analysis, bibliographic analysis, originality checking, database search, data mining, reporting tools, and real-time monitoring enhance the software's effectiveness.
Natural language processing, text matching, online plagiarism detection, and plagiarism detection further bolster these solutions' capabilities. Web search, plagiarism checker, user interface, artificial intelligence, LMS integration, machine learning, research papers, learning management systems, web-based software, citation verification, cloud-based software, and legal frameworks are integral components of these anti-plagiarism tools. Pricing models catering to various budgets and text analysis capabilities cater to diverse educational needs. The market's evolution underscores the growing significance of academic integrity and data privacy in the digital age.
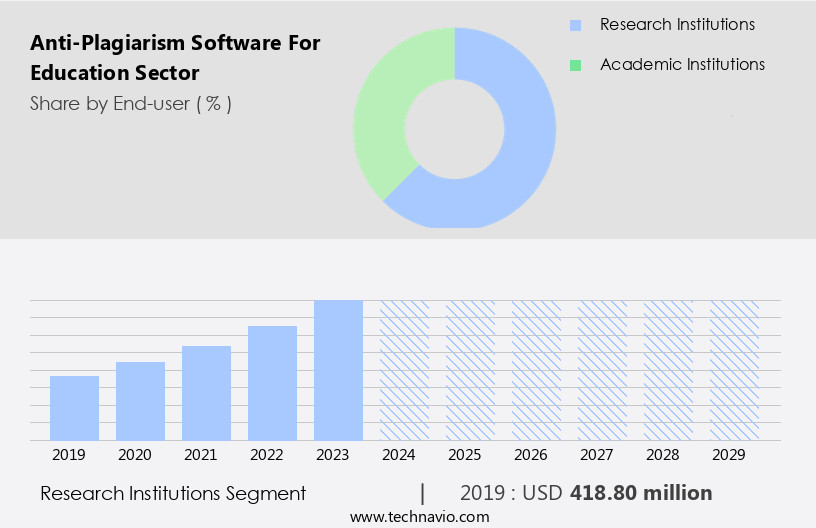
The Research institutions segment was valued at USD 418.80 billion in 2019 and showed a gradual increase during the forecast period. StartFragment Anti-plagiarism software for the education sector strengthens student accountability and supports faculty workflow with precise text similarity analysis and source matching. Institutions, including education institutions and K schools, utilize on-premise software for secure operations. Advanced citation analysis ensures academic integrity, while Plag Scan generates a detailed similarity report using a vast plagiarism database. Real-time detection and batch processing improve efficiency, aided by API integration for seamless functionality. Adherence to compliance regulations reinforces credibility, boosting student motivation and academic performance. The system enhances research ethics, safeguarding intellectual property rights through digital rights management. By fostering digital literacy, information literacy, and critical thinking, this technology ensures responsible scholarship and learning.
Regional Analysis
North America is estimated to contribute 28% to the growth of the global market during the forecast period. Technavio's analysts have elaborately explained the regional trends and drivers that shape the market during the forecast period.
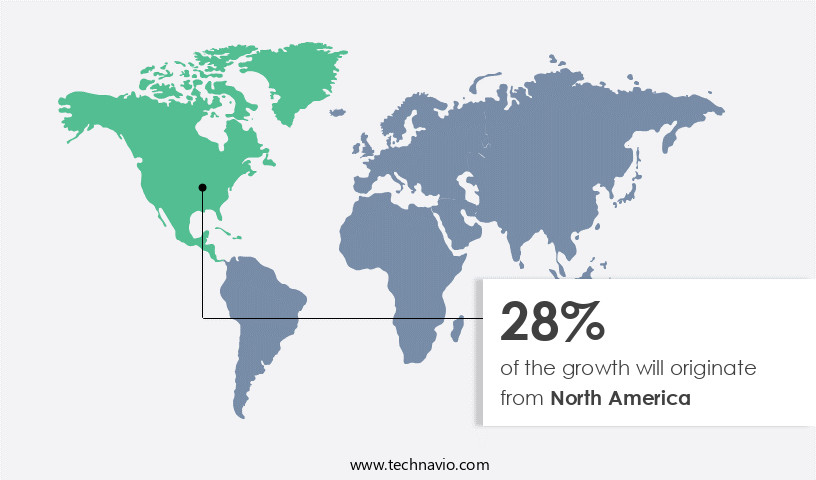
In the education sector, North America's higher adoption of anti-plagiarism software is driven by the region's substantial number of universities and advanced technological developments. The prevalence of e-learning in schools and universities increases the need for such software due to the increased potential for plagiarism in online assessments. The US government's USA Learning Program, an official e-learning platform, further highlights the importance of academic integrity in the digital age. Anti-plagiarism software solutions integrate various technologies, such as source code analysis, similarity analysis, bibliographic analysis, originality checking, database search, data mining, reporting tools, and real-time monitoring. These features enable the software to perform text matching, online plagiarism detection, web search, and plagiarism checker functions.
User interfaces are designed to be balanced, ensuring a seamless experience for educators and students. Artificial intelligence and machine learning algorithms are increasingly being employed in these solutions to improve their accuracy and efficiency. Natural language processing capabilities enable the software to understand the context and meaning of text, while cloud-based and web-based software options provide accessibility and flexibility. Citation verification and LMS integration are essential features for educational institutions, ensuring compliance with legal frameworks and maintaining academic integrity. Pricing models vary, with some offering subscription-based plans and others providing one-time purchases. Data privacy is a critical concern for educational institutions, and anti-plagiarism software providers must adhere to strict data privacy regulations to maintain trust and confidence.
The market's evolution is expected to continue, with ongoing advancements in technology and the increasing importance of academic integrity in the digital age.
Market Dynamics
Our researchers analyzed the data with 2024 as the base year, along with the key drivers, trends, and challenges. A holistic analysis of drivers will help companies refine their marketing strategies to gain a competitive advantage.
What are the Anti-Plagiarism Software For Education Sector market drivers leading to the rise in the adoption of Industry?
- The supportive initiatives of the government serve as the primary catalyst for market growth. Academic integrity is a priority for educational institutions worldwide, leading to the increasing adoption of advanced plagiarism detection tools. Governments and educational bodies are investing in these solutions to maintain the quality of education and ensure original work. Mandatory plagiarism checks for doctoral theses and research publications in various countries have driven demand for sophisticated software. Furthermore, the shift to online learning and digital assignments has made it essential to combat the ease of copying content from the internet. These anti-plagiarism tools offer reporting tools to help educators identify instances of plagiarism and provide students with feedback. They utilize natural language processing and real-time monitoring to compare submitted work against vast databases and the internet.
- Some solutions even offer mobile apps for convenience. Text matching technology is used to identify similarities between sources and student work, ensuring academic honesty. Data privacy is a crucial consideration for these tools, with providers implementing robust security measures to protect student information. By upholding academic integrity, these solutions enhance the credibility of academic qualifications and contribute to a fair and competitive educational environment. Such factors will increase the market research report growth during the forecast period.
What are the Anti-Plagiarism Software For Education Sector market trends shaping the Industry?
- Open access to data enables the free copying of content, making it a significant market trend in the data industry. This practice promotes transparency, collaboration, and innovation, as researchers and professionals can easily access and build upon each other's work. Plagiarism detection is a crucial aspect of academic integrity in the education sector. With the increasing availability of open access to literature and research papers online, the risk of plagiarism has become more prevalent. To mitigate this issue, plagiarism checkers using web search, artificial intelligence, and machine learning have gained popularity. These tools enable educators to compare student work against a vast database of existing content, ensuring originality. The user interface plays a significant role in the effectiveness and ease of use of plagiarism checkers. Advanced features such as LMS integration allow seamless submission and evaluation of student work within learning management systems.
- These tools provide quick and accurate results, saving time and resources for educators. Plagiarism detection software uses various techniques, including web search, artificial intelligence, and machine learning, to identify potential plagiarism. By comparing data against billions of web pages, these tools can identify instances of copying and paraphrasing. The software's ability to understand context and recognize synonyms and similar phrases enhances its accuracy. Plagiarism detection software is an essential tool for maintaining academic integrity in the education sector. Its advanced features, such as user-friendly interfaces, LMS integration, and powerful algorithms, enable educators to efficiently and accurately detect plagiarism, ensuring students uphold the highest standards of academic honesty. Such factors will increase the market report growth during the forecast period.
How does Anti-Plagiarism Software For Education Sector market faces challenges during its growth?
- The proliferation of free anti-plagiarism software poses a significant challenge to academic integrity in the industry, as it can undermine the value and authenticity of scholarly work, potentially hindering the industry's growth. Anti-plagiarism software plays a crucial role in the education sector, ensuring academic integrity through advanced text analysis. This market encompasses both web-based and cloud-based solutions, with learning management systems integrating these tools for seamless use. Citation verification is a key feature, helping users correctly attribute sources and avoid plagiarism. Despite the benefits, the availability of free and open-source tools poses a challenge. These sites offer options for checking and paraphrasing documents, reducing the need for proprietary software. Quetext and Duplichecker are examples of such competitors.
- Pricing models vary, with some offering freemium services and others charging fees based on usage. Companies must navigate this competitive landscape while adhering to legal frameworks. Regardless, the demand for reliable and efficient anti-plagiarism solutions remains strong. Such factors will hinder the market forecast growth.
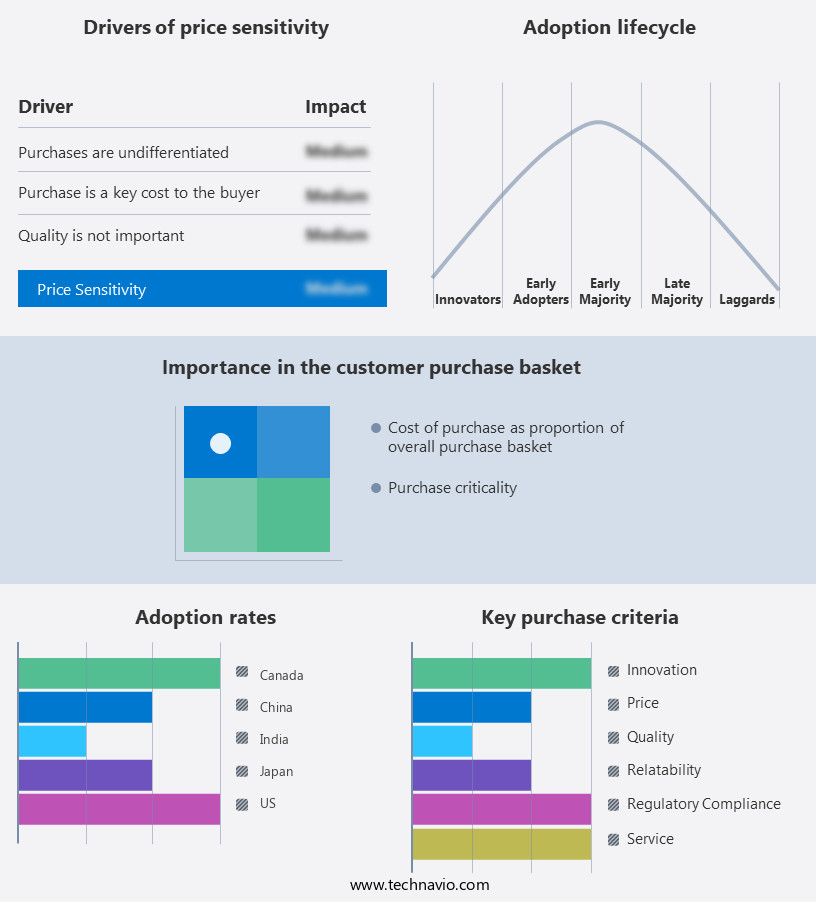
Exclusive Customer Landscape
The anti-plagiarism software for education sector forecasting report includes the adoption lifecycle of the market, covering from the innovator's stage to the laggard's stage. It focuses on adoption rates in different regions based on penetration. Furthermore, the anti-plagiarism software for education sector report also includes key purchase criteria and drivers of price sensitivity to help companies evaluate and develop their market growth analysis strategies.
Customer Landscape
Key Companies & Market Insights
Companies are implementing various strategies, such as strategic alliances, anti-plagiarism software for education sector forecast, partnerships, mergers and acquisitions, geographical expansion, and product/service launches, to enhance their presence in the industry.
Academicplagiarism Inc. - The company offers an academic plagiarism checker, premium editing, and proofreading services.
The industry research and growth report includes detailed analyses of the competitive landscape of the market and information about key companies, including:
- Academicplagiarism Inc.
- BibMe
- Blackboard Inc.
- Copyleaks Technologies Ltd.
- DupliChecker.com Inc.
- Grammarly Inc.
- Plagiarism Checker X LLC
- Plagiarism Detector
- Plagiarismanalyzer.com
- PlagScan GmbH
- PlagTracker
- PrePost SEO
- Quetext Inc.
- Search Engine Reports
- SmallSEOTools.com Inc.
- Turnitin LLC
Qualitative and quantitative analysis of companies has been conducted to help clients understand the wider business environment as well as the strengths and weaknesses of key industry players. Data is qualitatively analyzed to categorize companies as pure play, category-focused, industry-focused, and diversified; it is quantitatively analyzed to categorize companies as dominant, leading, strong, tentative, and weak.
Recent Development and News in Anti-Plagiarism Software For Education Sector
- In February 2023, Turnitin, a leading provider of plagiarism detection services, announced the launch of its new product, Turnitin Similarity 2. The advanced software uses artificial intelligence and machine learning algorithms to identify not only text matches but also similarities in ideas and structures, providing educators with a more comprehensive solution to address academic integrity issues
- In May 2024, Chegg, an American educational services company, entered into a strategic partnership with Grammarly, a popular writing assistant platform. This collaboration enabled Chegg to integrate Grammarly's plagiarism detection and grammar checking features into its student services, offering a more comprehensive suite of tools to help students improve their writing skills and maintain academic honesty
- In August 2024, iParadigms, the makers of Turnitin, secured a significant investment of USD50 million in a funding round led by Insight Partners. The investment was aimed at accelerating the company's product development, expanding its market reach, and enhancing its customer support
- In November 2025, the European Union passed a new regulation mandating the use of plagiarism detection software in all educational institutions across its member states. This policy change, which affects millions of students, is expected to significantly increase the demand for anti-plagiarism software in the education sector.
Research Analyst Overview
The education sector's anti-plagiarism market continues to evolve, driven by the constant need to maintain academic integrity and ensure originality in research. Solutions encompassing plagiarism detection, web search, and checker tools are at the forefront, employing various techniques such as source code analysis, similarity analysis, and bibliographic analysis. These tools utilize advanced technologies like natural language processing, real-time monitoring, and machine learning to provide accurate and efficient plagiarism checking. Integration with Learning Management Systems (LMS) and cloud-based software enables seamless workflows for educators and students. Web-based and mobile applications expand accessibility, while reporting tools help educators monitor progress and identify trends.
Data privacy remains a priority, with secure databases and data mining techniques ensuring confidentiality. Artificial intelligence and machine learning algorithms continuously refine plagiarism detection capabilities, enhancing the user experience. Research papers and academic integrity are key applications, with pricing models catering to various budgets and institutional needs. The legal framework surrounding plagiarism and academic dishonesty further fuels market growth, as institutions strive to maintain a level playing field for their students. StartFragment Anti-plagiarism software for the education sector leverages web crawling and document fingerprinting to detect instances of digital plagiarism while ensuring adherence to academic standards and institutional policies. Powered by cloud computing, these tools offer global accessibility and multilanguage support, catering to diverse educational institutions. Data visualization enhances report clarity, while integration with third-party tools streamlines processes. Workflow automation enables efficient checks, and customizable settings allow institutions to tailor detection methods. Through faculty training and student awareness campaigns, these systems foster academic integrity programs and plagiarism prevention initiatives. Faculty feedback refines algorithms, ensuring accuracy. By harnessing educational technology and digital resources, these solutions empower institutions to uphold academic credibility.
The Anti-Plagiarism Software for Education Sector is becoming indispensable as institutions prioritize academic integrity. Informed by market research and growth, institutions rely on market research reports and market growth and forecasting to evaluate adoption trends. Detailed market forecasting, supplemented with market reports and market forecasts, identifies expansion opportunities. Advanced education software integrates seamlessly with learning management systems, enhancing reliability across higher education and K-12 education. Mobile accessibility through mobile apps fosters usability, while student feedback informs refinements. Cutting-edge semantic analysis aids accuracy in plagiarism detection. The rise of distance learning has amplified the need for robust anti-plagiarism solutions, supporting digital assessment methods. Enhanced online collaboration tools ensure fair academic practices, reinforcing originality and ethical learning standards. As institutions adapt, these technologies remain pivotal in shaping a transparent and accountable education framework.
Dive into Technavio's strong research methodology, blending expert interviews, extensive data synthesis, and validated models for unparalleled Anti-Plagiarism Software For Education Sector insights. See full methodology.
|
Market Scope |
|
|
Report Coverage |
Details |
|
Page number |
221 |
|
Base year |
2024 |
|
Historic period |
2019-2023 |
|
Forecast period |
2025-2029 |
|
Growth momentum & CAGR |
Accelerate at a CAGR of 32.6% |
|
Market growth 2025-2029 |
USD 6.86 billion |
|
Market structure |
Fragmented |
|
YoY growth 2024-2025(%) |
26.6 |
|
Key countries |
US, China, Germany, UK, Canada, Japan, India, Mexico, Brazil, and France |
|
Competitive landscape |
Leading Companies, Market Positioning of Companies, Competitive Strategies, and Industry Risks |
What are the Key Data Covered in this Anti-Plagiarism Software For Education Sector Research and Growth Report?
- CAGR of the Anti-Plagiarism Software For Education Sector industry during the forecast period
- Detailed information on factors that will drive the growth and forecasting between 2025 and 2029
- Precise estimation of the size of the market and its contribution of the industry in focus to the parent market
- Accurate predictions about upcoming growth and trends and changes in consumer behaviour
- Growth of the market across North America, Europe, APAC, South America, and Middle East and Africa
- Thorough analysis of the market's competitive landscape and detailed information about companies
- Comprehensive analysis of factors that will challenge the anti-plagiarism software for education sector growth of industry companies
We can help! Our analysts can customize this anti-plagiarism software for education sector research report to meet your requirements.
 RIA -
RIA - 
