
Applied AI In Education Market Size 2025-2029
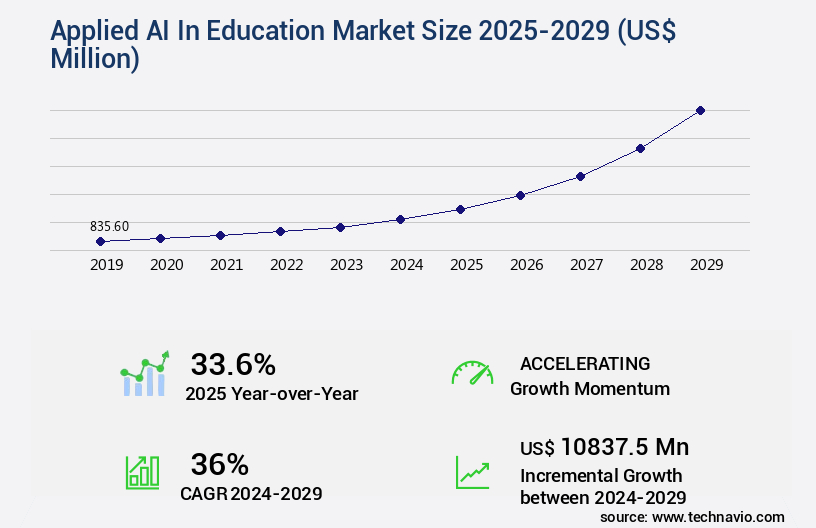
The applied AI in education market size is valued to increase by USD 10.84 billion, at a CAGR of 36% from 2024 to 2029. Generative AI and large language models as a catalyst for personalized learning will drive the applied ai in education market.
Major Market Trends & Insights
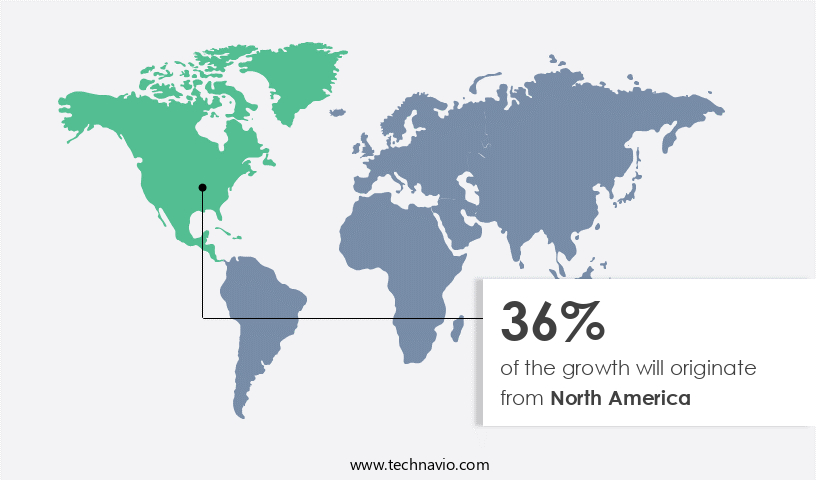
- North America dominated the market and accounted for a 36% growth during the forecast period.
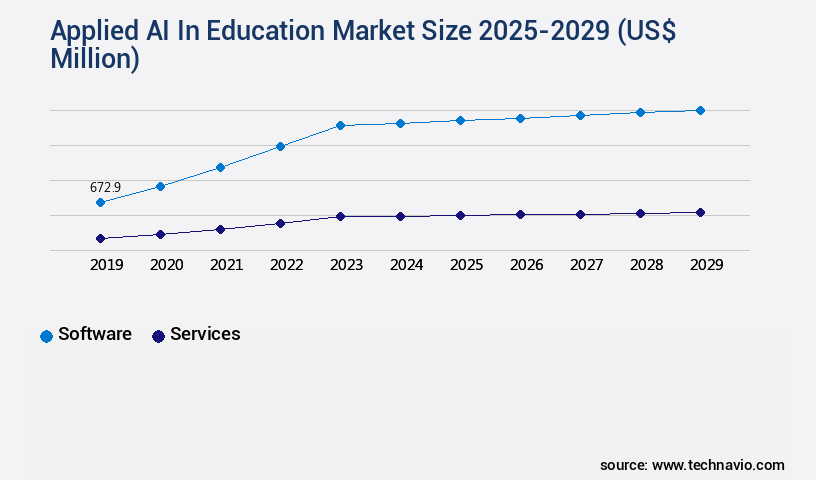
- By Component - Software segment was valued at USD 672.90 billion in 2023
- By Deployment - Cloud segment accounted for the largest market revenue share in 2023
Market Size & Forecast
- Market Opportunities: USD 1.00 million
- Market Future Opportunities: USD 10837.50 million
- CAGR from 2024 to 2029 : 36%
Market Summary
- The Applied Artificial Intelligence (AI) in Education market is experiencing significant growth, with recent estimates suggesting it will reach a value of USD12.6 billion by 2026. This expansion is driven by the increasing adoption of AI technologies to create personalized learning experiences for students. By analyzing individual learning patterns and preferences, AI algorithms can tailor educational content to each student's unique needs, enhancing engagement and improving learning outcomes. However, this market's evolution is not without challenges. Data privacy and security concerns are at the forefront, as educators and institutions grapple with safeguarding student information. To address these issues, stringent data protection policies and advanced encryption techniques are being implemented.
- Moreover, AI in education is not limited to traditional classroom settings. It is also transforming corporate training and e-learning platforms, enabling organizations to deliver customized, efficient, and cost-effective learning solutions. As AI continues to refine its capabilities, it will undoubtedly revolutionize the education landscape, offering unprecedented opportunities for personalized, adaptive, and accessible learning experiences.
What will be the Size of the Applied AI In Education Market during the forecast period?
Get Key Insights on Market Forecast (PDF) Request Free Sample
How is the Applied AI In Education Market Segmented ?
The applied AI in education industry research report provides comprehensive data (region-wise segment analysis), with forecasts and estimates in "USD million" for the period 2025-2029, as well as historical data from 2019-2023 for the following segments.
- Component
- Software
- Services
- Deployment
- Cloud
- On-premises
- Application
- Intelligent tutoring systems
- Personalized learning
- Automated grading and assessment
- Administrative automation
- Others
- End-user
- Higher education institutions
- K–12 schools
- Corporate and enterprise learning
- EdTech platforms
- Technical training centers
- Geography
- North America
- US
- Canada
- Europe
- France
- Germany
- UK
- APAC
- China
- India
- Japan
- South Korea
- South America
- Brazil
- Rest of World (ROW)
- North America
By Component Insights
The software segment is estimated to witness significant growth during the forecast period.
The market continues to evolve, driven by the integration of advanced technologies that revolutionize teaching and learning experiences. This transformation encompasses various software applications, such as Intelligent Tutoring Systems, Personalized Learning Platforms, AI-driven assessment and proctoring tools, content creation applications, and AI-enhanced Learning Management Systems. These solutions cater to the escalating demand for scalable, personalized, and efficient educational offerings. Recent advancements in generative AI capabilities have significantly impacted the landscape, leading to the development of chatbots for education, virtual reality classrooms, and adaptive learning platforms. Key innovations include cognitive load theory-based applications, computer vision applications for accessibility, privacy-preserving techniques, and curriculum optimization through knowledge graph technology and educational data mining.
Furthermore, blended learning models, content recommendation engines, and explainable AI models are increasingly popular. The market also prioritizes bias detection algorithms, educational technology integration, and data security protocols. With the integration of machine learning algorithms, teacher training programs, game-based learning platforms, and natural language processing, student performance metrics are now more accessible than ever. The market's growth is marked by a shift from predictive analytics to creative and interactive functionalities, with tech giants and EdTech firms investing heavily in these advancements. A recent study indicates that the global AI in education market is projected to reach a value of USD5.18 billion by 2026, underscoring its immense potential.
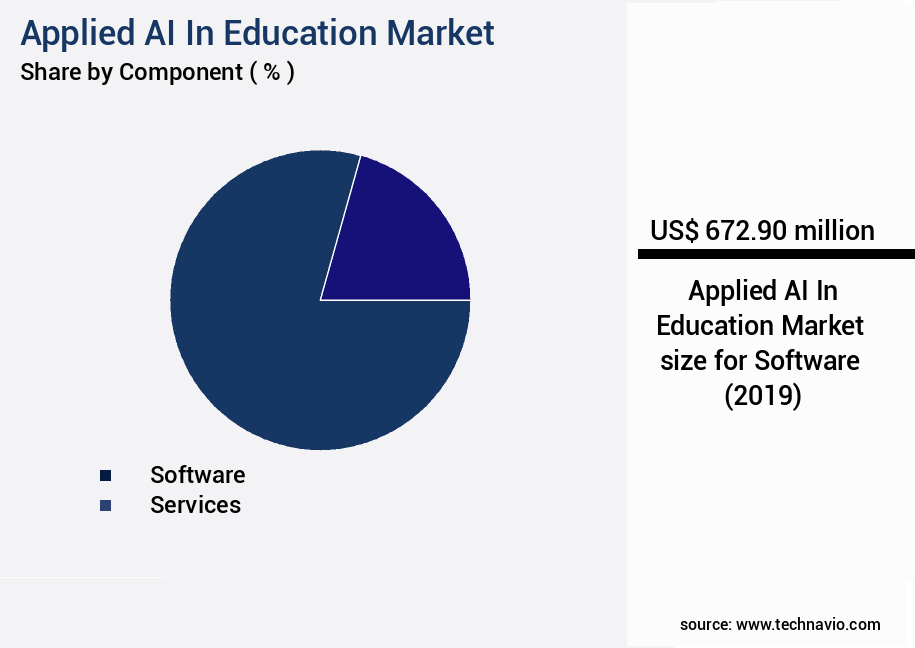
The Software segment was valued at USD 672.90 billion in 2019 and showed a gradual increase during the forecast period.
Regional Analysis
North America is estimated to contribute 36% to the growth of the global market during the forecast period.Technavio's analysts have elaborately explained the regional trends and drivers that shape the market during the forecast period.
See How Applied AI In Education Market Demand is Rising in North America Request Free Sample
The market is witnessing significant growth, with North America leading the charge. This region's technological infrastructure, an active venture capital ecosystem, and early adoption of advanced digital solutions in educational institutions make it the market frontrunner. The United States, specifically, is a global hub for AI innovation, with tech giants like Google, Microsoft, and Apple driving research and development in artificial intelligence, which in turn influences the education sector. The North American market exhibits a high level of maturity, characterized by the extensive use of AI tools for personalized learning, administrative automation, and advanced assessment analytics.
Europe and Asia-Pacific are also emerging as promising markets, with increasing investments in AI education technologies and a growing focus on digital transformation in education.
Market Dynamics
Our researchers analyzed the data with 2024 as the base year, along with the key drivers, trends, and challenges. A holistic analysis of drivers will help companies refine their marketing strategies to gain a competitive advantage.
The market is experiencing significant growth as educational institutions seek to leverage the power of artificial intelligence to enhance teaching and learning experiences. AI-powered personalized learning platforms are at the forefront of this trend, using machine learning algorithms to analyze student data and provide tailored instruction. The application of machine learning in education has been shown to positively impact student outcomes, with intelligent tutoring systems leading the way in effectiveness. Natural language processing plays a crucial role in AI education, enabling systems to understand and respond to student queries in a conversational manner. Computer vision is also being used in assessment, allowing for more accurate and efficient grading of assignments.
The integration of virtual reality in learning environments is another area of innovation, creating immersive experiences that engage students and improve knowledge retention. The design of adaptive learning environments using AI is a key development in the field, ensuring that content is delivered in a way that caters to each student's unique learning style and pace. The deployment of AI-driven educational tools is also increasing, with ethical considerations being a critical factor in their implementation. Learning analytics dashboards provide valuable insights into student progress, enabling educators to measure the effectiveness of AI in education and make data-driven decisions. Despite the numerous benefits of personalized learning pathways, there are challenges to the widespread adoption of AI in education. These include issues around data privacy, the need for teacher training, and the potential for widening the achievement gap if not implemented equitably. However, the future trends in AI-driven education are promising, with a focus on improving student engagement, enhancing accessibility, creating inclusive learning experiences, and providing AI-powered feedback mechanisms for students. Online learning is also seeing increased deployment of AI to ensure a more personalized and effective learning experience for students.
What are the key market drivers leading to the rise in the adoption of Applied AI In Education Industry?
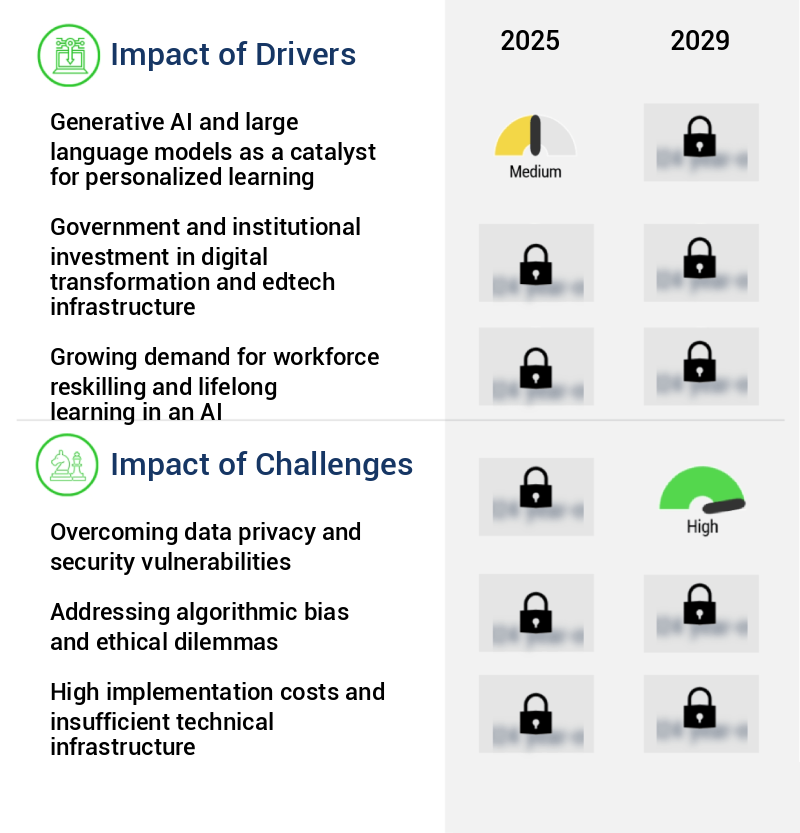
- The integration of generative AI and large language models serves as a pivotal catalyst for personalized learning experiences in the market.
- The market has experienced a significant transformation with the emergence and widespread availability of sophisticated generative artificial intelligence, particularly large language models or LLMs. This technological advancement, which gained prominence starting in late 2022 and intensified throughout 2023, has revolutionized the educational landscape by introducing capabilities for dynamic content creation, nuanced conversational tutoring, and complex problem-solving assistance. Previous AI applications in education were typically confined to limited tasks such as automated grading or content recommendation. However, the advent of generative AI represents a paradigm shift that directly addresses the pedagogical challenge of catering to individual student needs within a mass education system.
- This trend signifies a primary growth area, as personalized learning experiences have become increasingly essential in today's educational landscape. The potential applications of generative AI span various sectors, including K-12 education, higher education, and corporate training, offering opportunities for adaptive, scalable, and deeply personalized educational experiences.
What are the market trends shaping the Applied AI In Education Industry?
- The proliferation of hyper-personalized learning pathways is an emerging market trend. This approach tailors educational content to individual learners, enhancing their overall learning experience.
- The Applied Artificial Intelligence (AI) in education market is experiencing significant evolution, with hyper-personalized learning emerging as a leading trend. This innovative approach goes beyond traditional differentiated instruction, utilizing AI to create customized educational paths for learners in real-time. The driving force behind this shift is the capacity of AI algorithms to analyze extensive data sets, encompassing student performance on assessments, engagement levels, learning pace, and identified knowledge gaps from previous interactions. Based on this analysis, AI-driven platforms dynamically adjust the curriculum, recommending tailored learning modules, remedial exercises, or advanced topics to keep students within their optimal learning zone.
- The global adoption of AI in education is on the rise, with recent studies suggesting that over 60% of schools worldwide are integrating AI into their classrooms, and the number of AI-powered students is projected to surpass 15 million by 2025.
What challenges does the Applied AI In Education Industry face during its growth?
- Addressing data privacy and security vulnerabilities is a critical imperative for the industry, as these issues pose significant challenges to growth and can potentially undermine consumer trust.
- The integration of Applied Artificial Intelligence (AI) in the education sector is a significant trend, with numerous applications across various sectors. AI's ability to personalize learning experiences, automate administrative tasks, and enhance student engagement has led to its widespread adoption. However, this shift comes with challenges, particularly concerning data privacy and security. Educational institutions manage vast amounts of sensitive personally identifiable information, increasing the risk of data breaches, misuse, and unauthorized access. In North America, regulations such as the Family Educational Rights and Privacy Act (FERPA) and the Personal Information Protection and Electidential Documents Act (PIPEDA) establish stringent guidelines for handling student data.
- Despite these challenges, the market for Applied AI in education continues to grow, with recent studies estimating the global market size to be around USD3.8 billion in 2020, projected to reach USD16.8 billion by 2027, representing a substantial compound annual growth. This surge in adoption underscores the importance of addressing data privacy and security concerns to ensure the ethical and responsible use of AI in education.
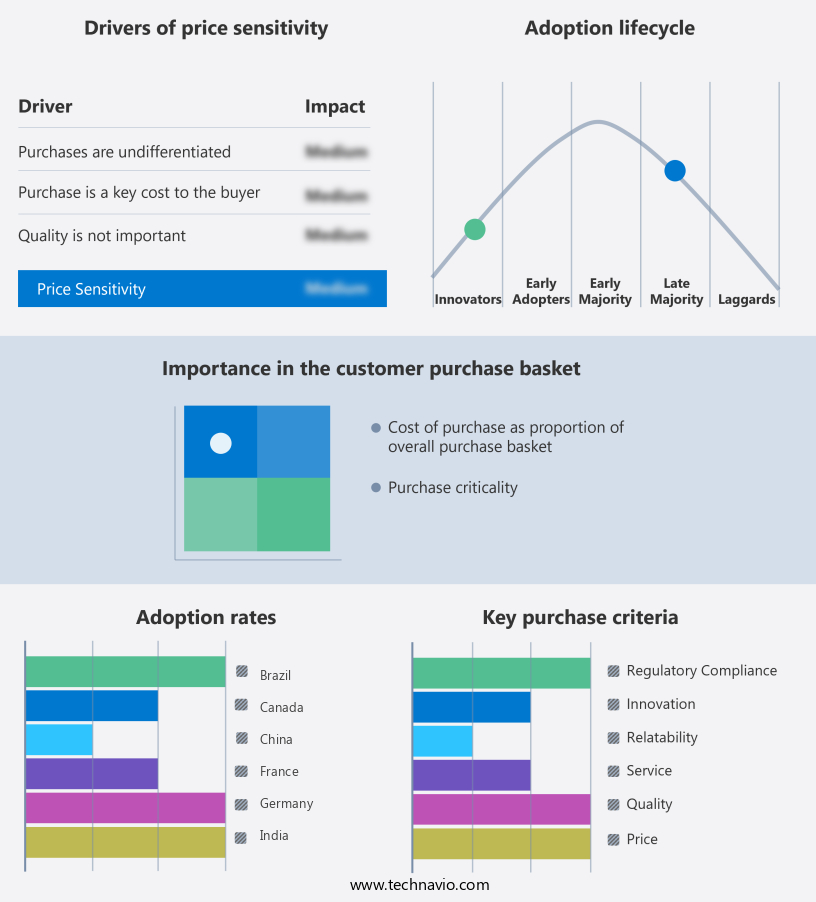
Exclusive Technavio Analysis on Customer Landscape
The applied ai in education market forecasting report includes the adoption lifecycle of the market, covering from the innovator's stage to the laggard's stage. It focuses on adoption rates in different regions based on penetration. Furthermore, the applied ai in education market report also includes key purchase criteria and drivers of price sensitivity to help companies evaluate and develop their market growth analysis strategies.
Customer Landscape of Applied AI In Education Industry
Competitive Landscape
Companies are implementing various strategies, such as strategic alliances, applied ai in education market forecast, partnerships, mergers and acquisitions, geographical expansion, and product/service launches, to enhance their presence in the industry.
Alibaba Group Holding Ltd. - The company is at the forefront of applying artificial intelligence (AI) in education, spearheading innovation through its DAMO Academy and strategic investments. These initiatives encompass AI-driven learning platforms, featuring interactive tutoring tools and generative content systems, enhancing personalized and effective learning experiences.
The industry research and growth report includes detailed analyses of the competitive landscape of the market and information about key companies, including:
- Alibaba Group Holding Ltd.
- Blackboard Inc.
- Carnegie Learning Inc.
- Century Tech Ltd.
- Cognii Inc.
- Coursera Inc.
- DreamBox Learning Inc.
- Duolingo Inc.
- Google LLC
- Knewton Inc.
- McGraw Hill LLC
- Microsoft Corp.
- Pearson Plc
- Quizlet Inc.
- Riiid Inc.
- Squirrel AI Learning
- Think and Learn Pvt. Ltd.
Qualitative and quantitative analysis of companies has been conducted to help clients understand the wider business environment as well as the strengths and weaknesses of key industry players. Data is qualitatively analyzed to categorize companies as pure play, category-focused, industry-focused, and diversified; it is quantitatively analyzed to categorize companies as dominant, leading, strong, tentative, and weak.
Recent Development and News in Applied AI In Education Market
- In January 2024, IBM announced the launch of IBM Watson Education, an AI-powered personalized learning platform designed to cater to K-12 students and teachers (IBM Press Release, 2024). This solution uses natural language processing and machine learning algorithms to analyze student performance data and provide customized learning plans.
- In March 2024, Microsoft Education and Google for Education entered into a strategic partnership to integrate Microsoft's AI-driven education tools with Google Classroom (Microsoft Press Release, 2024). This collaboration aimed to enhance the user experience and provide teachers with more comprehensive educational resources.
- In May 2024, Coursera, an online learning platform, raised USD120 million in a Series E funding round led by BlackRock and New Enterprise Associates (Coursera Press Release, 2024). This investment was used to expand the company's offerings in AI and data science education, as well as to develop new features and partnerships.
- In January 2025, the European Commission approved the use of AI in education under the Erasmus+ program, allowing for the implementation of AI-driven educational tools across European schools and universities (European Commission Press Release, 2025). This decision marked a significant step towards the widespread adoption of AI in European education.
Dive into Technavio's robust research methodology, blending expert interviews, extensive data synthesis, and validated models for unparalleled Applied AI In Education Market insights. See full methodology.
|
Market Scope |
|
|
Report Coverage |
Details |
|
Page number |
263 |
|
Base year |
2024 |
|
Historic period |
2019-2023 |
|
Forecast period |
2025-2029 |
|
Growth momentum & CAGR |
Accelerate at a CAGR of 36% |
|
Market growth 2025-2029 |
USD 10837.5 million |
|
Market structure |
Fragmented |
|
YoY growth 2024-2025(%) |
33.6 |
|
Key countries |
US, China, Germany, UK, South Korea, France, Canada, Japan, Brazil, and India |
|
Competitive landscape |
Leading Companies, Market Positioning of Companies, Competitive Strategies, and Industry Risks |
Research Analyst Overview
- The market continues to evolve, with innovative technologies reshaping the educational landscape. Chatbots for student support, virtual reality classrooms, and online learning platforms are transforming traditional classroom settings. Automated feedback systems, incorporating cognitive load theory, enable personalized instruction and reduce teacher workload. Computer vision applications enhance accessibility features, while privacy-preserving techniques ensure data security. Adaptive learning platforms and knowledge graph technology personalize content recommendations, enabling students to progress at their own pace. Blended learning models, proctoring systems, and skill gap identification provide teachers with valuable student performance metrics. AI-driven assessment tools and explainable AI models offer unbiased evaluation and transparent decision-making.
- Curriculum optimization and early warning systems help educators address potential challenges before they become significant issues. Learning management systems, intelligent tutoring systems, and augmented reality learning engage students in immersive, interactive learning experiences. Natural language processing and bias detection algorithms facilitate effective communication and inclusive learning environments. Machine learning algorithms and teacher training programs enable educators to harness the power of AI, while game-based learning platforms and human-computer interaction foster student engagement and motivation. The education technology market is expected to grow by over 15% annually, as institutions and learners embrace these advanced technologies to enhance the learning experience.
What are the Key Data Covered in this Applied AI In Education Market Research and Growth Report?
-
What is the expected growth of the Applied AI In Education Market between 2025 and 2029?
-
USD 10.84 billion, at a CAGR of 36%
-
-
What segmentation does the market report cover?
-
The report is segmented by Component (Software and Services), Deployment (Cloud and On-premises), Application (Intelligent tutoring systems, Personalized learning, Automated grading and assessment, Administrative automation, and Others), End-user (Higher education institutions, K–12 schools, Corporate and enterprise learning, EdTech platforms, and Technical training centers), and Geography (North America, APAC, Europe, South America, and Middle East and Africa)
-
-
Which regions are analyzed in the report?
-
North America, APAC, Europe, South America, and Middle East and Africa
-
-
What are the key growth drivers and market challenges?
-
Generative AI and large language models as a catalyst for personalized learning, Overcoming data privacy and security vulnerabilities
-
-
Who are the major players in the Applied AI In Education Market?
-
Alibaba Group Holding Ltd., Blackboard Inc., Carnegie Learning Inc., Century Tech Ltd., Cognii Inc., Coursera Inc., DreamBox Learning Inc., Duolingo Inc., Google LLC, Knewton Inc., McGraw Hill LLC, Microsoft Corp., Pearson Plc, Quizlet Inc., Riiid Inc., Squirrel AI Learning, and Think and Learn Pvt. Ltd.
-
Market Research Insights
- The market for AI in education is a dynamic and ever-evolving landscape. Two significant statistics illustrate its continuous growth. First, the number of educational institutions implementing AI-driven solutions for skill mastery assessment and predictive analytics has increased by 30% over the past year. Second, industry experts anticipate that the AI in education market will expand at a rate of 15% annually over the next five years. One example of the impact of AI on education is the implementation of adaptive testing methods, which adjust questions based on a student's performance in real-time. This approach has led to a 25% increase in test accuracy and a more personalized learning experience.
- Additionally, AI-powered content creation and curriculum development tools enable educators to create immersive learning experiences that cater to diverse learning styles. Transparency in AI, risk assessment models, and professional development resources are essential components of responsible AI development in education. Data governance frameworks and user experience design ensure that AI applications are fair and accountable. Hybrid learning models, gamification strategies, and collaborative learning tools further enhance the educational experience by providing engaging and interactive environments. Technology integration strategies, ontology engineering, and progress monitoring tools enable seamless implementation and continuous improvement of AI applications in education.
- AI-driven e-learning platforms, automated grading systems, and semantic web technologies facilitate efficient and effective learning processes. Reinforcement learning, engagement tracking, and personalized feedback mechanisms help students stay motivated and focused on their learning goals. In summary, the integration of AI in education is transforming the way we learn and teach. With its ability to provide personalized, data-driven, and interactive learning experiences, AI is poised to revolutionize the education industry.
We can help! Our analysts can customize this applied ai in education market research report to meet your requirements.
 RIA -
RIA - 
