Applied AI In Energy And Utilities Market Analysis, Size, and Forecast 2025-2029: North America (US, Canada, and Mexico), Europe (France, Germany, and UK), APAC (China, India, Japan, and South Korea), and Rest of World (ROW)

Applied AI In Energy And Utilities Market Analysis, Size, and Forecast 2025-2029:
North America (US, Canada, and Mexico), Europe (France, Germany, and UK), APAC (China, India, Japan, and South Korea), and Rest of World (ROW)

Published: Aug 2025 255 Pages SKU: IRTNTR80810

Market Overview at a Glance

$1.46 B
Market Opportunity
27.3%
CAGR
22.9
YoY growth 2024-2025(%)

Applied AI In Energy And Utilities Market Size 2025-2029

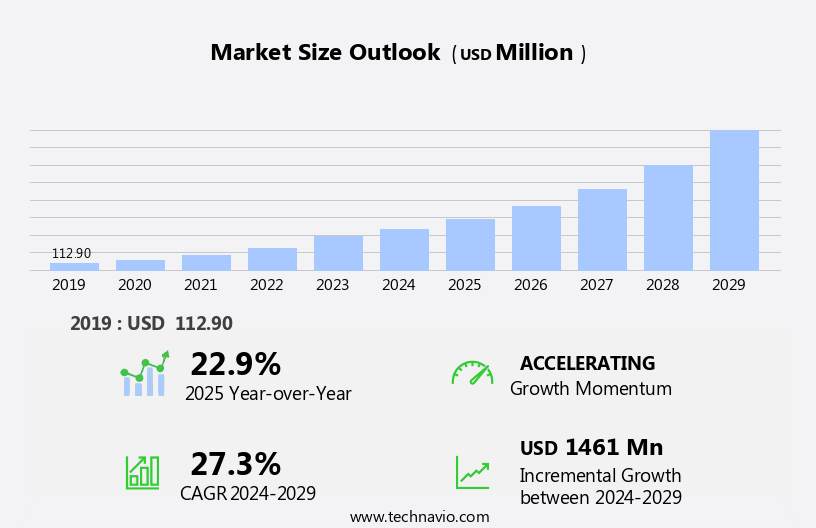
The applied AI in energy and utilities market size is forecast to increase by USD 1.46 billion, at a CAGR of 27.3% between 2024 and 2029.

  • The market is witnessing significant growth, driven by the critical imperative for grid modernization and resilience. Advanced technologies, including Generative AI, are revolutionizing the energy sector by enabling predictive maintenance and advanced operational simulation. This innovation allows companies to optimize energy production, reduce downtime, and enhance overall efficiency. However, the market's expansion is not without challenges. As AI systems process increasingly large volumes of sensitive data, ensuring data protection and compliance becomes essential. 
  • Companies must invest in robust cybersecurity measures and adhere to regulatory frameworks to mitigate risks and maintain customer trust. These challenges, while daunting, present opportunities for market participants to differentiate themselves by offering secure and compliant AI solutions. By addressing these complexities, companies can capitalize on the market's potential and contribute to a more efficient, reliable, and sustainable energy future. Navigating data security, privacy, and governance complexities poses a significant hurdle.

What will be the Size of the Applied AI In Energy And Utilities Market during the forecast period?

Applied AI In Energy And Utilities Market Size

Explore in-depth regional segment analysis with market size data - historical 2019-2023 and forecasts 2025-2029 - in the full report.  
Request Free Sample

The energy and utilities market continues to evolve, with artificial intelligence (AI) playing an increasingly significant role in optimizing operations and enhancing efficiency across various sectors. AI-powered asset management, for instance, enables utilities to predict maintenance needs, reducing downtime and extending asset life. Deep learning energy analysis, leveraging neural networks, improves energy production and distribution efficiency. Computer vision energy solutions analyze satellite and drone imagery for geospatial energy analytics, optimizing renewable energy generation and distribution. Energy efficiency AI and operational efficiency AI streamline processes, reducing costs and improving overall performance. AI-driven resource allocation and IOT energy integration enable real-time monitoring and response to energy demand.

Utility data visualization and advanced metering infrastructure provide insights into energy consumption patterns, enabling demand-side management and customer energy profiling. AI-driven grid optimization and outage prediction improve grid stability and reliability. Distributed generation AI optimizes energy storage and enhances the integration of renewable energy sources. Utility workforce optimization, proactive grid management, and grid stability algorithms ensure efficient workforce deployment and grid maintenance. Renewable energy forecasting and real-time energy monitoring enable accurate predictions and responsive adjustments. Load forecasting algorithms and predictive maintenance AI prevent potential issues before they become major problems.

According to a recent industry report, the global AI in energy market is expected to grow by over 20% annually in the coming years, underscoring the market's continuous dynamism and the growing importance of AI in the energy and utilities sector. For example, one utility company implemented an AI-powered predictive maintenance solution, resulting in a 30% reduction in maintenance costs and a 15% increase in asset availability.

How is this Applied AI In Energy And Utilities Industry segmented?

The applied AI in energy and utilities industry research report provides comprehensive data (region-wise segment analysis), with forecasts and estimates in "USD million" for the period 2025-2029, as well as historical data from 2019-2023 for the following segments.

  • Deployment
    • Cloud-based
    • On-premises
  • Application
    • Renewables management
    • Demand forecasting
    • Grid management
    • Energy management and optimization
    • Others
  • Technology
    • Machine learning
    • Predictive analytics
    • Deep learning
    • Computer vision
    • Others
  • Geography
    • North America
      • US
      • Canada
      • Mexico
    • Europe
      • France
      • Germany
      • UK
    • APAC
      • China
      • India
      • Japan
      • South Korea
    • Rest of World (ROW)

By Deployment Insights

The Cloud-based segment is estimated to witness significant growth during the forecast period. The market is experiencing significant growth, with cloud-based solutions leading the charge. Hosting AI applications and processing data on third-party cloud services like Amazon Web Services, Microsoft Azure, and Google Cloud is becoming the preferred choice for utilities due to its scalability, cost efficiency, and access to advanced analytical tools. For instance, long-term electricity demand forecasting, which requires petabytes of data and immense processing power to account for weather patterns, economic indicators, and the rise of electric vehicles, is made feasible by cloud-based solutions. AI-powered asset management, deep learning energy, computer vision energy, geospatial energy analytics, energy efficiency AI, operational efficiency AI, and AI-driven resource allocation are some of the applications transforming the energy sector. 

Moreover, IoT energy integration, utility data visualization, advanced metering infrastructure, AI-driven grid optimization, AI-powered outage prediction, distributed generation AI, utility workforce optimization, grid stability algorithms, demand-side management AI, energy storage optimization, condition-based maintenance, proactive grid management, renewable energy forecasting, real-time energy monitoring, load forecasting algorithms, customer energy profiling, predictive maintenance AI, energy consumption patterns, smart grid cybersecurity, and AI-based anomaly detection are all integral components of this dynamic market. According to recent estimates, the market is projected to grow by over 20% annually, underscoring its transformative potential. Smart grid cybersecurity and AI-based anomaly detection ensure the security and reliability of the energy infrastructure.

Applied AI In Energy And Utilities Market Size

Request Free Sample

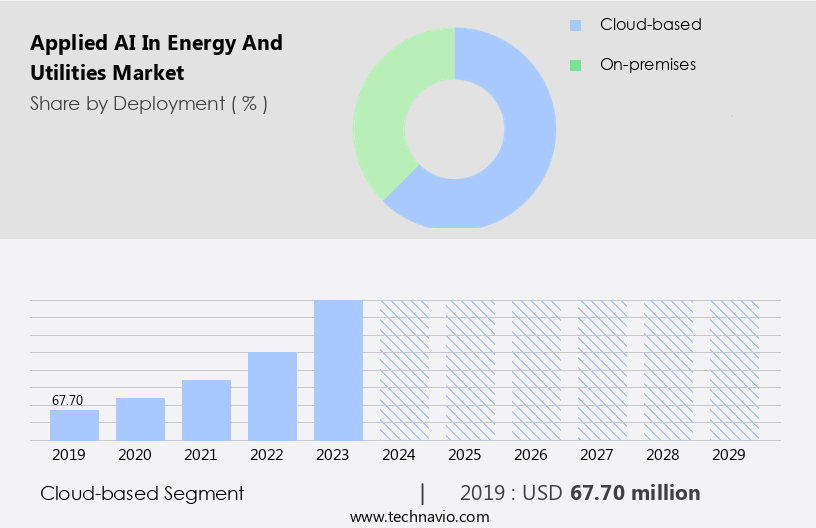
The Cloud-based segment was valued at USD 67.70 billion in 2019 and showed a gradual increase during the forecast period.

The Applied AI in Energy and Utilities Market is rapidly transforming with technologies like energy system modeling and power grid automation, enabling efficient grid operations. Smart city energy management and AI in utility operations enhance urban sustainability. Tools for risk assessment AI and energy infrastructure AI ensure system reliability. Innovations such as autonomous grid control and microgrid control systems support localized energy networks. Demand response optimization and energy conservation strategies reduce operational costs. Solar panel performance is improved through real-time monitoring. Smart meter data analytics and machine learning power grid enable predictive maintenance. Power system simulation AI and natural language processing energy aid planning. Additionally, AI in energy trading and digital twin energy systems drive operational intelligence.

Regional Analysis

North America is estimated to contribute 39% to the growth of the global market during the forecast period. Technavio's analysts have elaborately explained the regional trends and drivers that shape the market during the forecast period.

Applied AI In Energy And Utilities Market Share by Geography

 Request Free Sample

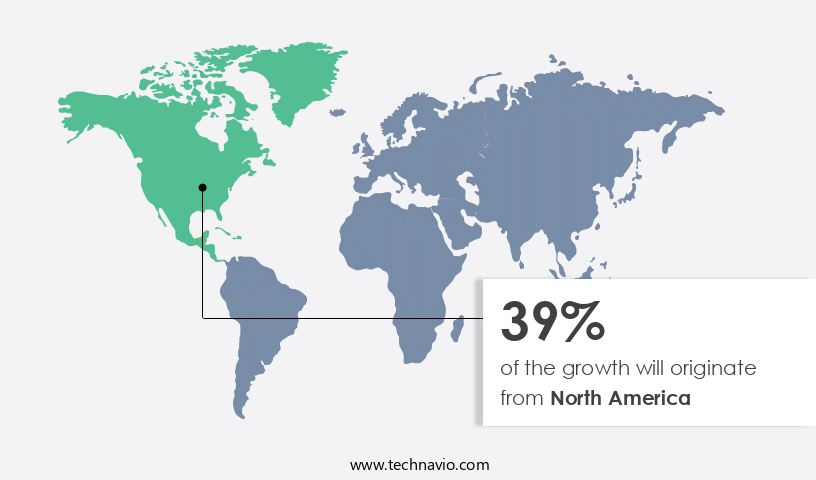
Artificial intelligence (AI) is transforming the energy and utilities sector in North America, with the region leading the global adoption due to several compelling drivers. Grid modernization is a pressing requirement to replace aging infrastructure, and AI technologies such as deep learning energy and computer vision are at the forefront of this transition. Geospatial energy analytics and IoT energy integration enable real-time monitoring and predictive maintenance, improving operational efficiency and grid stability. AI-driven resource allocation and demand-side management optimize energy consumption patterns, reducing overall energy waste. Advanced metering infrastructure and AI-powered outage prediction enhance customer experience and grid reliability.

Renewable energy forecasting and smart grid cybersecurity are essential components of the transition to clean energy sources, while AI-based anomaly detection ensures grid security. The energy storage optimization and condition-based maintenance further boost grid resilience. The United States, with its innovative technology ecosystem, is a hub for AI startups and established tech giants, fostering a competitive landscape. According to recent research, the North American AI in energy and utilities market is expected to grow by 15% annually, underscoring the sector's potential for significant growth. For instance, a leading utility company in the US implemented an AI-powered predictive maintenance system, resulting in a 20% reduction in unplanned downtime and a 15% increase in operational efficiency.

Market Dynamics

Our researchers analyzed the data with 2024 as the base year, along with the key drivers, trends, and challenges. A holistic analysis of drivers will help companies refine their marketing strategies to gain a competitive advantage. The market is experiencing significant growth as companies seek to leverage advanced technologies to optimize energy production, distribution, and consumption. AI algorithms for grid stability are being used to maintain power system balance and improve grid reliability. Machine learning for energy trading is enabling more accurate price forecasting and efficient energy market participation. Deep learning applications in power systems are enhancing power system analysis and improving the integration of renewable energy sources. Predictive analytics for power generation is helping utilities optimize generation capacity and reduce downtime.

AI-powered optimization of renewable energy is improving the efficiency and effectiveness of renewable energy sources, while natural language processing in utility billing is streamlining customer interactions and reducing billing errors. Computer vision for infrastructure inspection is enabling early detection of infrastructure issues, reducing maintenance costs and improving safety. IoT sensor data for energy efficiency is providing real-time insights into energy usage patterns, enabling proactive energy management. Advanced metering infrastructure data analysis is enabling more accurate energy consumption forecasting and demand response programs. AI-driven solutions for grid modernization are improving grid flexibility and resilience, while machine learning models for load forecasting are helping utilities better manage energy demand.

Predictive maintenance of energy assets is reducing downtime and maintenance costs, while AI in optimizing energy storage systems is improving energy storage efficiency and reducing costs. Real-time anomaly detection in power grids is enabling faster response times to grid issues, and deep learning for energy consumption prediction is helping utilities better understand energy usage patterns and optimize energy distribution. AI-driven solutions for smart city energy are enabling more efficient energy management in urban areas, while geospatial analytics for energy infrastructure is providing valuable insights into energy infrastructure performance and potential upgrades. AI-powered customer energy management systems are enabling more personalized energy management, and data visualization tools for utility operations are improving operational efficiency and effectiveness.

Overall, the market is transforming the energy industry, enabling more efficient, effective, and sustainable energy production, distribution, and consumption.

What are the key market drivers leading to the rise in the adoption of Applied AI In Energy And Utilities Industry?

  • The imperative need for grid modernization and resilience serves as the primary market driver. In today's world, ensuring a reliable and efficient power grid is not only critical but mandatory for meeting the increasing energy demands and mitigating the risks of power outages and other grid-related issues. Artificial intelligence offers a robust set of solutions to shift from a reactive to a proactive and predictive grid management approach. This outdated infrastructure is increasingly susceptible to failures amplified by extreme weather events instigated by climate change, including hurricanes, heatwaves, and wildfires.
  • For instance, AI-driven predictive maintenance can reduce unplanned downtime by up to 20%, ensuring a reliable power supply and minimizing potential revenue losses for utility companies. According to industry reports, the market is projected to expand at a double-digit percentage rate in the coming years. The market is experiencing significant growth due to the pressing requirement to modernize antiquated electrical grids and fortify them against the escalating risks of climate change. Infrastructure in developed regions, such as North America and Europe, is often decades old and ill-equipped to handle the intricacies of the contemporary energy sector.

What are the market trends shaping the Applied AI In Energy And Utilities Industry?

  • Generative AI serves as a catalyst for predictive maintenance and advanced operational simulation, emerging as the market trend in the industry. The energy and utilities sector is undergoing a significant transformation, transitioning from traditional machine learning applications to the adoption of Generative Artificial Intelligence (AI). This shift marks a significant evolution in how organizations manage their critical assets, anticipate operational challenges, and train the upcoming workforce. Unlike traditional predictive models that identify trends in historical data, generative AI generates new synthetic data and intricate simulations, providing unparalleled opportunities for enhancing operational resilience and efficiency.
  • According to recent studies, the global generative AI market in the energy sector is projected to grow by 25% in the next three years, reflecting the immense potential of this technology. The integration of generative AI in energy and utilities is poised to revolutionize the industry, offering numerous benefits such as improved asset performance, reduced operational risks, and enhanced predictive maintenance capabilities. The primary catalyst for this trend is the escalating complexity of energy systems and the pressing need to extend asset life, minimize unplanned downtime, and optimize capital expenditures amidst increasing costs and stringent regulatory oversight.

What challenges does the Applied AI In Energy And Utilities Industry face during its growth?

  • Navigating the intricate data security, privacy, and governance complexities is a significant challenge that can hinder industry growth. Professionals in this field must possess extensive knowledge and expertise to effectively address these issues and ensure regulatory compliance. Failure to do so can result in reputational damage, financial losses, and legal consequences. Therefore, prioritizing and effectively managing data security, privacy, and governance is essential for any organization seeking to succeed in today's digital landscape. Artificial intelligence (AI) adoption in the energy and utilities sector faces significant hurdles due to growing concerns over data security, privacy, and governance.
  • Amidst these concerns, the energy and utilities sector is projected to witness a 20% growth in AI investments over the next five years, underscoring the industry's commitment to leveraging AI for enhanced operational efficiency and resilience. However, it is crucial that companies prioritize robust security measures to mitigate potential risks and safeguard their critical infrastructure. With the integration of AI systems into energy grids and utility networks, the amount of sensitive data from smart meters, sensors, and operational technology (OT) systems increases exponentially. This convergence of IT and OT networks introduces new vulnerabilities, as cyberattacks could lead to severe consequences such as power outages, energy market manipulation, or consumer data breaches. For instance, a successful cyberattack on an AI-driven system could result in a 30% increase in power outages, as reported in a recent industry study.

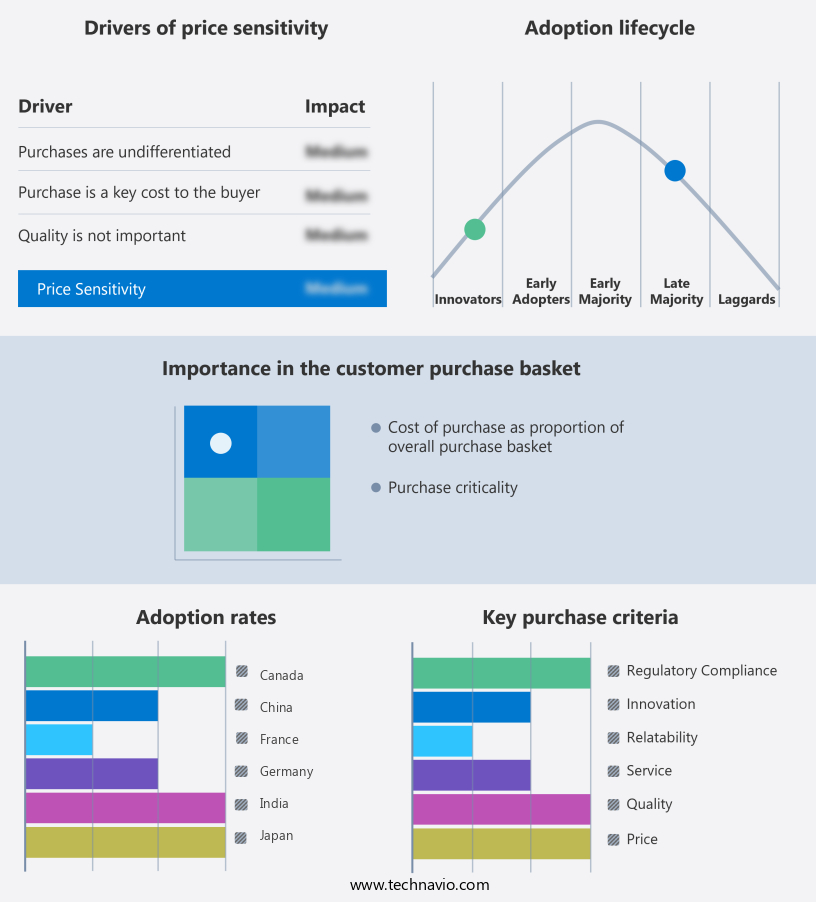
Exclusive Customer Landscape

The applied AI in energy and utilities market forecasting report includes the adoption lifecycle of the market, covering from the innovator's stage to the laggard's stage. It focuses on adoption rates in different regions based on penetration. Furthermore, the applied AI in energy and utilities market report also includes key purchase criteria and drivers of price sensitivity to help companies evaluate and develop their market growth analysis strategies.

Applied AI In Energy And Utilities Market Share by Geography

 Customer Landscape

Key Companies & Market Insights

Companies are implementing various strategies, such as strategic alliances, applied AI in energy and utilities market forecast, partnerships, mergers and acquisitions, geographical expansion, and product/service launches, to enhance their presence in the industry.

ABB Ltd. - The ABB Ability platform is a cutting-edge AI solution designed for energy facilities, delivering asset health monitoring, process optimization, and robotic automation capabilities.

The industry research and growth report includes detailed analyses of the competitive landscape of the market and information about key companies, including:

  • ABB Ltd.
  • Amazon Web Services Inc.
  • Arundo Analytics Inc.
  • BIDGELY INC.
  • C3.ai Inc.
  • General Electric Co.
  • Google LLC
  • Honeywell International Inc.
  • International Business Machines Corp.
  • Landis Gyr AG
  • Microsoft Corp.
  • NVIDIA Corp.
  • Oracle Corp.
  • Palantir Technologies Inc.
  • SAP SE
  • Schneider Electric SE
  • Siemens AG
  • SparkCognition Inc.
  • Stem Inc.
  • Verdigris Technologies Inc.

Qualitative and quantitative analysis of companies has been conducted to help clients understand the wider business environment as well as the strengths and weaknesses of key industry players. Data is qualitatively analyzed to categorize companies as pure play, category-focused, industry-focused, and diversified; it is quantitatively analyzed to categorize companies as dominant, leading, strong, tentative, and weak.

Recent Development and News in Applied AI In Energy And Utilities Market

  • In January 2024, IBM announced the launch of its new AI-powered energy management system, IBM Watson Energy and Water Insights, designed to optimize energy usage and grid management for utility companies. This solution uses machine learning algorithms to analyze real-time data and predict energy demand, thereby improving efficiency and reducing costs (IBM Press Release).
  • In March 2024, Siemens Energy and Microsoft entered into a strategic partnership to integrate Microsoft Azure's AI capabilities into Siemens Energy's energy management systems. This collaboration aimed to enhance grid stability, optimize renewable energy production, and improve overall energy system performance (Microsoft News Center).
  • In May 2024, Enel X, a leading energy services provider, raised USD 150 million in a funding round led by SoftBank's Vision Fund 2. The investment was earmarked for the expansion of Enel X's global energy management business, focusing on the deployment of AI and digital solutions for energy optimization and grid management (Enel X Press Release).
  • In April 2025, the European Commission approved the merger of Siemens Energy and Siemens Gamesa Renewable Energy. The combined entity, Siemens New Energy, would leverage AI technologies to enhance renewable energy production, grid integration, and energy efficiency across Europe (European Commission Press Release).

Research Analyst Overview

The market for Artificial Intelligence (AI) in energy and utilities continues to evolve, with applications spanning various sectors. AI-powered fault detection and predictive asset management are transforming maintenance operations, reducing downtime and increasing efficiency. Energy blockchain technology and grid modernization AI are revolutionizing the power grid, enabling secure and decentralized energy transactions. Renewable integration AI and wind turbine maintenance optimize energy production from renewable sources, while thermal plant optimization ensures maximum efficiency. Data-driven energy systems and energy market simulation enable accurate forecasting and pricing, with renewable energy optimization and intelligent energy pricing leading to significant cost savings. Power quality monitoring and AI-driven fraud detection enhance grid security and reliability.

Hydropower plant AI and sensor data analysis optimize energy production and improve operational performance. The energy sector is expected to grow by over 12% annually, driven by the increasing adoption of AI and advanced technologies. For instance, a leading utility company achieved a 15% reduction in maintenance costs through AI-powered predictive asset management.

Dive into Technavio's robust research methodology, blending expert interviews, extensive data synthesis, and validated models for unparalleled Applied AI In Energy And Utilities Market insights. See full methodology.

Market Scope

Report Coverage

Details

Page number

255

Base year

2024

Historic period

2019-2023

Forecast period

2025-2029

Growth momentum & CAGR

Accelerate at a CAGR of 27.3%

Market growth 2025-2029

USD 1.46 billion

Market structure

Fragmented

YoY growth 2024-2025(%)

22.9

Key countries

US, China, Canada, India, Germany, UK, Mexico, Japan, France, and South Korea

Competitive landscape

Leading Companies, Market Positioning of Companies, Competitive Strategies, and Industry Risks

Request Free Sample

What are the Key Data Covered in this Applied AI In Energy And Utilities Market Research and Growth Report?

  • CAGR of the Applied AI In Energy And Utilities industry during the forecast period
  • Detailed information on factors that will drive the growth and forecasting between 2025 and 2029
  • Precise estimation of the size of the market and its contribution of the industry in focus to the parent market
  • Accurate predictions about upcoming growth and trends and changes in consumer behaviour
  • Growth of the market across North America, APAC, Europe, Middle East and Africa, and South America
  • Thorough analysis of the market's competitive landscape and detailed information about companies
  • Comprehensive analysis of factors that will challenge the applied AI in energy and utilities market growth of industry companies

We can help! Our analysts can customize this applied AI in energy and utilities market research report to meet your requirements.

Get in touch

1 Executive Summary

  • 1.1 Market overview
    • Executive Summary - Chart on Market Overview
    • Executive Summary - Data Table on Market Overview
    • Executive Summary - Chart on Global Market Characteristics
    • Executive Summary - Chart on Market by Geography
    • Executive Summary - Chart on Market Segmentation by Deployment
    • Executive Summary - Chart on Market Segmentation by Application
    • Executive Summary - Chart on Market Segmentation by Technology
    • Executive Summary - Chart on Incremental Growth
    • Executive Summary - Data Table on Incremental Growth
    • Executive Summary - Chart on Company Market Positioning

2 Technavio Analysis

  • 2.1 Analysis of price sensitivity, lifecycle, customer purchase basket, adoption rates, and purchase criteria
    • Analysis of price sensitivity, lifecycle, customer purchase basket, adoption rates, and purchase criteria
  • 2.2 Criticality of inputs and Factors of differentiation
    • Overview on criticality of inputs and factors of differentiation
  • 2.3 Factors of disruption
    • Overview on factors of disruption
  • 2.4 Impact of drivers and challenges
    • Impact of drivers and challenges in 2024 and 2029

3 Market Landscape

  • 3.1 Market ecosystem
    • Parent Market
    • Data Table on - Parent Market
  • 3.2 Market characteristics
    • Market characteristics analysis
  • 3.3 Value chain analysis
    • Value chain analysis

4 Market Sizing

  • 4.1 Market definition
    • Offerings of companies included in the market definition
  • 4.2 Market segment analysis
    • Market segments
  • 4.3 Market size 2024
    • 4.4 Market outlook: Forecast for 2024-2029
      • Chart on Global - Market size and forecast 2024-2029 ($ million)
      • Data Table on Global - Market size and forecast 2024-2029 ($ million)
      • Chart on Global Market: Year-over-year growth 2024-2029 (%)
      • Data Table on Global Market: Year-over-year growth 2024-2029 (%)

    5 Historic Market Size

    • 5.1 Global Applied AI In Energy And Utilities Market 2019 - 2023
      • Historic Market Size - Data Table on Global Applied AI In Energy And Utilities Market 2019 - 2023 ($ million)
    • 5.2 Deployment segment analysis 2019 - 2023
      • Historic Market Size - Deployment Segment 2019 - 2023 ($ million)
    • 5.3 Application segment analysis 2019 - 2023
      • Historic Market Size - Application Segment 2019 - 2023 ($ million)
    • 5.4 Technology segment analysis 2019 - 2023
      • Historic Market Size - Technology Segment 2019 - 2023 ($ million)
    • 5.5 Geography segment analysis 2019 - 2023
      • Historic Market Size - Geography Segment 2019 - 2023 ($ million)
    • 5.6 Country segment analysis 2019 - 2023
      • Historic Market Size - Country Segment 2019 - 2023 ($ million)

    6 Five Forces Analysis

    • 6.1 Five forces summary
      • Five forces analysis - Comparison between 2024 and 2029
    • 6.2 Bargaining power of buyers
      • Bargaining power of buyers - Impact of key factors 2024 and 2029
    • 6.3 Bargaining power of suppliers
      • Bargaining power of suppliers - Impact of key factors in 2024 and 2029
    • 6.4 Threat of new entrants
      • Threat of new entrants - Impact of key factors in 2024 and 2029
    • 6.5 Threat of substitutes
      • Threat of substitutes - Impact of key factors in 2024 and 2029
    • 6.6 Threat of rivalry
      • Threat of rivalry - Impact of key factors in 2024 and 2029
    • 6.7 Market condition
      • Chart on Market condition - Five forces 2024 and 2029

    7 Market Segmentation by Deployment

    • 7.1 Market segments
      • Chart on Deployment - Market share 2024-2029 (%)
      • Data Table on Deployment - Market share 2024-2029 (%)
    • 7.2 Comparison by Deployment
      • Chart on Comparison by Deployment
      • Data Table on Comparison by Deployment
    • 7.3 Cloud-based - Market size and forecast 2024-2029
      • Chart on Cloud-based - Market size and forecast 2024-2029 ($ million)
      • Data Table on Cloud-based - Market size and forecast 2024-2029 ($ million)
      • Chart on Cloud-based - Year-over-year growth 2024-2029 (%)
      • Data Table on Cloud-based - Year-over-year growth 2024-2029 (%)
    • 7.4 On-premises - Market size and forecast 2024-2029
      • Chart on On-premises - Market size and forecast 2024-2029 ($ million)
      • Data Table on On-premises - Market size and forecast 2024-2029 ($ million)
      • Chart on On-premises - Year-over-year growth 2024-2029 (%)
      • Data Table on On-premises - Year-over-year growth 2024-2029 (%)
    • 7.5 Market opportunity by Deployment
      • Market opportunity by Deployment ($ million)
      • Data Table on Market opportunity by Deployment ($ million)

    8 Market Segmentation by Application

    • 8.1 Market segments
      • Chart on Application - Market share 2024-2029 (%)
      • Data Table on Application - Market share 2024-2029 (%)
    • 8.2 Comparison by Application
      • Chart on Comparison by Application
      • Data Table on Comparison by Application
    • 8.3 Renewables management - Market size and forecast 2024-2029
      • Chart on Renewables management - Market size and forecast 2024-2029 ($ million)
      • Data Table on Renewables management - Market size and forecast 2024-2029 ($ million)
      • Chart on Renewables management - Year-over-year growth 2024-2029 (%)
      • Data Table on Renewables management - Year-over-year growth 2024-2029 (%)
    • 8.4 Demand forecasting - Market size and forecast 2024-2029
      • Chart on Demand forecasting - Market size and forecast 2024-2029 ($ million)
      • Data Table on Demand forecasting - Market size and forecast 2024-2029 ($ million)
      • Chart on Demand forecasting - Year-over-year growth 2024-2029 (%)
      • Data Table on Demand forecasting - Year-over-year growth 2024-2029 (%)
    • 8.5 Grid management - Market size and forecast 2024-2029
      • Chart on Grid management - Market size and forecast 2024-2029 ($ million)
      • Data Table on Grid management - Market size and forecast 2024-2029 ($ million)
      • Chart on Grid management - Year-over-year growth 2024-2029 (%)
      • Data Table on Grid management - Year-over-year growth 2024-2029 (%)
    • 8.6 Energy management and optimization - Market size and forecast 2024-2029
      • Chart on Energy management and optimization - Market size and forecast 2024-2029 ($ million)
      • Data Table on Energy management and optimization - Market size and forecast 2024-2029 ($ million)
      • Chart on Energy management and optimization - Year-over-year growth 2024-2029 (%)
      • Data Table on Energy management and optimization - Year-over-year growth 2024-2029 (%)
    • 8.7 Others - Market size and forecast 2024-2029
      • Chart on Others - Market size and forecast 2024-2029 ($ million)
      • Data Table on Others - Market size and forecast 2024-2029 ($ million)
      • Chart on Others - Year-over-year growth 2024-2029 (%)
      • Data Table on Others - Year-over-year growth 2024-2029 (%)
    • 8.8 Market opportunity by Application
      • Market opportunity by Application ($ million)
      • Data Table on Market opportunity by Application ($ million)

    9 Market Segmentation by Technology

    • 9.1 Market segments
      • Chart on Technology - Market share 2024-2029 (%)
      • Data Table on Technology - Market share 2024-2029 (%)
    • 9.2 Comparison by Technology
      • Chart on Comparison by Technology
      • Data Table on Comparison by Technology
    • 9.3 Machine learning - Market size and forecast 2024-2029
      • Chart on Machine learning - Market size and forecast 2024-2029 ($ million)
      • Data Table on Machine learning - Market size and forecast 2024-2029 ($ million)
      • Chart on Machine learning - Year-over-year growth 2024-2029 (%)
      • Data Table on Machine learning - Year-over-year growth 2024-2029 (%)
    • 9.4 Predictive analytics - Market size and forecast 2024-2029
      • Chart on Predictive analytics - Market size and forecast 2024-2029 ($ million)
      • Data Table on Predictive analytics - Market size and forecast 2024-2029 ($ million)
      • Chart on Predictive analytics - Year-over-year growth 2024-2029 (%)
      • Data Table on Predictive analytics - Year-over-year growth 2024-2029 (%)
    • 9.5 Deep learning - Market size and forecast 2024-2029
      • Chart on Deep learning - Market size and forecast 2024-2029 ($ million)
      • Data Table on Deep learning - Market size and forecast 2024-2029 ($ million)
      • Chart on Deep learning - Year-over-year growth 2024-2029 (%)
      • Data Table on Deep learning - Year-over-year growth 2024-2029 (%)
    • 9.6 Computer vision - Market size and forecast 2024-2029
      • Chart on Computer vision - Market size and forecast 2024-2029 ($ million)
      • Data Table on Computer vision - Market size and forecast 2024-2029 ($ million)
      • Chart on Computer vision - Year-over-year growth 2024-2029 (%)
      • Data Table on Computer vision - Year-over-year growth 2024-2029 (%)
    • 9.7 Others - Market size and forecast 2024-2029
      • Chart on Others - Market size and forecast 2024-2029 ($ million)
      • Data Table on Others - Market size and forecast 2024-2029 ($ million)
      • Chart on Others - Year-over-year growth 2024-2029 (%)
      • Data Table on Others - Year-over-year growth 2024-2029 (%)
    • 9.8 Market opportunity by Technology
      • Market opportunity by Technology ($ million)
      • Data Table on Market opportunity by Technology ($ million)

    10 Customer Landscape

    • 10.1 Customer landscape overview
      • Analysis of price sensitivity, lifecycle, customer purchase basket, adoption rates, and purchase criteria

    11 Geographic Landscape

    • 11.1 Geographic segmentation
      • Chart on Market share by geography 2024-2029 (%)
      • Data Table on Market share by geography 2024-2029 (%)
    • 11.2 Geographic comparison
      • Chart on Geographic comparison
      • Data Table on Geographic comparison
    • 11.3 North America - Market size and forecast 2024-2029
      • Chart on North America - Market size and forecast 2024-2029 ($ million)
      • Data Table on North America - Market size and forecast 2024-2029 ($ million)
      • Chart on North America - Year-over-year growth 2024-2029 (%)
      • Data Table on North America - Year-over-year growth 2024-2029 (%)
    • 11.4 APAC - Market size and forecast 2024-2029
      • Chart on APAC - Market size and forecast 2024-2029 ($ million)
      • Data Table on APAC - Market size and forecast 2024-2029 ($ million)
      • Chart on APAC - Year-over-year growth 2024-2029 (%)
      • Data Table on APAC - Year-over-year growth 2024-2029 (%)
    • 11.5 Europe - Market size and forecast 2024-2029
      • Chart on Europe - Market size and forecast 2024-2029 ($ million)
      • Data Table on Europe - Market size and forecast 2024-2029 ($ million)
      • Chart on Europe - Year-over-year growth 2024-2029 (%)
      • Data Table on Europe - Year-over-year growth 2024-2029 (%)
    • 11.6 Middle East and Africa - Market size and forecast 2024-2029
      • Chart on Middle East and Africa - Market size and forecast 2024-2029 ($ million)
      • Data Table on Middle East and Africa - Market size and forecast 2024-2029 ($ million)
      • Chart on Middle East and Africa - Year-over-year growth 2024-2029 (%)
      • Data Table on Middle East and Africa - Year-over-year growth 2024-2029 (%)
    • 11.7 South America - Market size and forecast 2024-2029
      • Chart on South America - Market size and forecast 2024-2029 ($ million)
      • Data Table on South America - Market size and forecast 2024-2029 ($ million)
      • Chart on South America - Year-over-year growth 2024-2029 (%)
      • Data Table on South America - Year-over-year growth 2024-2029 (%)
    • 11.8 US - Market size and forecast 2024-2029
      • Chart on US - Market size and forecast 2024-2029 ($ million)
      • Data Table on US - Market size and forecast 2024-2029 ($ million)
      • Chart on US - Year-over-year growth 2024-2029 (%)
      • Data Table on US - Year-over-year growth 2024-2029 (%)
    • 11.9 China - Market size and forecast 2024-2029
      • Chart on China - Market size and forecast 2024-2029 ($ million)
      • Data Table on China - Market size and forecast 2024-2029 ($ million)
      • Chart on China - Year-over-year growth 2024-2029 (%)
      • Data Table on China - Year-over-year growth 2024-2029 (%)
    • 11.10 Canada - Market size and forecast 2024-2029
      • Chart on Canada - Market size and forecast 2024-2029 ($ million)
      • Data Table on Canada - Market size and forecast 2024-2029 ($ million)
      • Chart on Canada - Year-over-year growth 2024-2029 (%)
      • Data Table on Canada - Year-over-year growth 2024-2029 (%)
    • 11.11 India - Market size and forecast 2024-2029
      • Chart on India - Market size and forecast 2024-2029 ($ million)
      • Data Table on India - Market size and forecast 2024-2029 ($ million)
      • Chart on India - Year-over-year growth 2024-2029 (%)
      • Data Table on India - Year-over-year growth 2024-2029 (%)
    • 11.12 Germany - Market size and forecast 2024-2029
      • Chart on Germany - Market size and forecast 2024-2029 ($ million)
      • Data Table on Germany - Market size and forecast 2024-2029 ($ million)
      • Chart on Germany - Year-over-year growth 2024-2029 (%)
      • Data Table on Germany - Year-over-year growth 2024-2029 (%)
    • 11.13 UK - Market size and forecast 2024-2029
      • Chart on UK - Market size and forecast 2024-2029 ($ million)
      • Data Table on UK - Market size and forecast 2024-2029 ($ million)
      • Chart on UK - Year-over-year growth 2024-2029 (%)
      • Data Table on UK - Year-over-year growth 2024-2029 (%)
    • 11.14 Japan - Market size and forecast 2024-2029
      • Chart on Japan - Market size and forecast 2024-2029 ($ million)
      • Data Table on Japan - Market size and forecast 2024-2029 ($ million)
      • Chart on Japan - Year-over-year growth 2024-2029 (%)
      • Data Table on Japan - Year-over-year growth 2024-2029 (%)
    • 11.15 Mexico - Market size and forecast 2024-2029
      • Chart on Mexico - Market size and forecast 2024-2029 ($ million)
      • Data Table on Mexico - Market size and forecast 2024-2029 ($ million)
      • Chart on Mexico - Year-over-year growth 2024-2029 (%)
      • Data Table on Mexico - Year-over-year growth 2024-2029 (%)
    • 11.16 France - Market size and forecast 2024-2029
      • Chart on France - Market size and forecast 2024-2029 ($ million)
      • Data Table on France - Market size and forecast 2024-2029 ($ million)
      • Chart on France - Year-over-year growth 2024-2029 (%)
      • Data Table on France - Year-over-year growth 2024-2029 (%)
    • 11.17 South Korea - Market size and forecast 2024-2029
      • Chart on South Korea - Market size and forecast 2024-2029 ($ million)
      • Data Table on South Korea - Market size and forecast 2024-2029 ($ million)
      • Chart on South Korea - Year-over-year growth 2024-2029 (%)
      • Data Table on South Korea - Year-over-year growth 2024-2029 (%)
    • 11.18 Market opportunity by geography
      • Market opportunity by geography ($ million)
      • Data Tables on Market opportunity by geography ($ million)

    12 Drivers, Challenges, and Opportunity/Restraints

    • 12.1 Market drivers
      • 12.2 Market challenges
        • 12.3 Impact of drivers and challenges
          • Impact of drivers and challenges in 2024 and 2029
        • 12.4 Market opportunities/restraints

          13 Competitive Landscape

          • 13.1 Overview
            • 13.2 Competitive Landscape
              • Overview on criticality of inputs and factors of differentiation
            • 13.3 Landscape disruption
              • Overview on factors of disruption
            • 13.4 Industry risks
              • Impact of key risks on business

            14 Competitive Analysis

            • 14.1 Companies profiled
              • Companies covered
            • 14.2 Company ranking index
              • Company ranking index
            • 14.3 Market positioning of companies
              • Matrix on companies position and classification
            • 14.4 ABB Ltd.
              • ABB Ltd. - Overview
              • ABB Ltd. - Business segments
              • ABB Ltd. - Key news
              • ABB Ltd. - Key offerings
              • ABB Ltd. - Segment focus
              • SWOT
            • 14.5 Amazon Web Services Inc.
              • Amazon Web Services Inc. - Overview
              • Amazon Web Services Inc. - Product / Service
              • Amazon Web Services Inc. - Key news
              • Amazon Web Services Inc. - Key offerings
              • SWOT
            • 14.6 BIDGELY INC.
              • BIDGELY INC. - Overview
              • BIDGELY INC. - Product / Service
              • BIDGELY INC. - Key offerings
              • SWOT
            • 14.7 C3.ai Inc.
              • C3.ai Inc. - Overview
              • C3.ai Inc. - Product / Service
              • C3.ai Inc. - Key news
              • C3.ai Inc. - Key offerings
              • SWOT
            • 14.8 General Electric Co.
              • General Electric Co. - Overview
              • General Electric Co. - Business segments
              • General Electric Co. - Key news
              • General Electric Co. - Key offerings
              • General Electric Co. - Segment focus
              • SWOT
            • 14.9 Google LLC
              • Google LLC - Overview
              • Google LLC - Product / Service
              • Google LLC - Key offerings
              • SWOT
            • 14.10 Honeywell International Inc.
              • Honeywell International Inc. - Overview
              • Honeywell International Inc. - Business segments
              • Honeywell International Inc. - Key news
              • Honeywell International Inc. - Key offerings
              • Honeywell International Inc. - Segment focus
              • SWOT
            • 14.11 International Business Machines Corp.
              • International Business Machines Corp. - Overview
              • International Business Machines Corp. - Business segments
              • International Business Machines Corp. - Key news
              • International Business Machines Corp. - Key offerings
              • International Business Machines Corp. - Segment focus
              • SWOT
            • 14.12 Microsoft Corp.
              • Microsoft Corp. - Overview
              • Microsoft Corp. - Business segments
              • Microsoft Corp. - Key news
              • Microsoft Corp. - Key offerings
              • Microsoft Corp. - Segment focus
              • SWOT
            • 14.13 Oracle Corp.
              • Oracle Corp. - Overview
              • Oracle Corp. - Business segments
              • Oracle Corp. - Key news
              • Oracle Corp. - Key offerings
              • Oracle Corp. - Segment focus
              • SWOT
            • 14.14 SAP SE
              • SAP SE - Overview
              • SAP SE - Business segments
              • SAP SE - Key news
              • SAP SE - Key offerings
              • SAP SE - Segment focus
              • SWOT
            • 14.15 Schneider Electric SE
              • Schneider Electric SE - Overview
              • Schneider Electric SE - Business segments
              • Schneider Electric SE - Key news
              • Schneider Electric SE - Key offerings
              • Schneider Electric SE - Segment focus
              • SWOT
            • 14.16 Siemens AG
              • Siemens AG - Overview
              • Siemens AG - Business segments
              • Siemens AG - Key news
              • Siemens AG - Key offerings
              • Siemens AG - Segment focus
              • SWOT
            • 14.17 SparkCognition Inc.
              • SparkCognition Inc. - Overview
              • SparkCognition Inc. - Product / Service
              • SparkCognition Inc. - Key offerings
              • SWOT
            • 14.18 Stem Inc.
              • Stem Inc. - Overview
              • Stem Inc. - Product / Service
              • Stem Inc. - Key offerings
              • SWOT

            15 Appendix

            • 15.1 Scope of the report
              • 15.2 Inclusions and exclusions checklist
                • Inclusions checklist
                • Exclusions checklist
              • 15.3 Currency conversion rates for US$
                • Currency conversion rates for US$
              • 15.4 Research methodology
                • Research methodology
              • 15.5 Data procurement
                • Information sources
              • 15.6 Data validation
                • Data validation
              • 15.7 Validation techniques employed for market sizing
                • Validation techniques employed for market sizing
              • 15.8 Data synthesis
                • Data synthesis
              • 15.9 360 degree market analysis
                • 360 degree market analysis
              • 15.10 List of abbreviations
                • List of abbreviations

              Research Methodology

              Technavio presents a detailed picture of the market by way of study, synthesis, and summation of data from multiple sources. The analysts have presented the various facets of the market with a particular focus on identifying the key industry influencers. The data thus presented is comprehensive, reliable, and the result of extensive research, both primary and secondary.

              INFORMATION SOURCES

              Primary sources

              • Manufacturers and suppliers
              • Channel partners
              • Industry experts
              • Strategic decision makers

              Secondary sources

              • Industry journals and periodicals
              • Government data
              • Financial reports of key industry players
              • Historical data
              • Press releases

              DATA ANALYSIS

              Data Synthesis

              • Collation of data
              • Estimation of key figures
              • Analysis of derived insights

              Data Validation

              • Triangulation with data models
              • Reference against proprietary databases
              • Corroboration with industry experts

              REPORT WRITING

              Qualitative

              • Market drivers
              • Market challenges
              • Market trends
              • Five forces analysis

              Quantitative

              • Market size and forecast
              • Market segmentation
              • Geographical insights
              • Competitive landscape

              Interested in this report?

              Get your sample now to see our research methodology and insights!

              Download Now

              Frequently Asked Questions

              Applied Ai In Energy And Utilities market growth will increase by $ 1461 mn during 2025-2029 .

              The Applied Ai In Energy And Utilities market is expected to grow at a CAGR of 27.3% during 2025-2029 .

              Applied Ai In Energy And Utilities market is segmented by Deployment( Cloud-based, On-premises) Application( Renewables management, Demand forecasting, Grid management, Energy management and optimization, Others) Technology( Machine learning, Predictive analytics, Deep learning, Computer vision, Others)

              ABB Ltd., Amazon Web Services Inc., Arundo Analytics Inc., BIDGELY INC., C3.ai Inc., General Electric Co., Google LLC, Honeywell International Inc., International Business Machines Corp., Landis Gyr AG, Microsoft Corp., NVIDIA Corp., Oracle Corp., Palantir Technologies Inc., SAP SE, Schneider Electric SE, Siemens AG, SparkCognition Inc., Stem Inc., Verdigris Technologies Inc. are a few of the key vendors in the Applied Ai In Energy And Utilities market.

              North America will register the highest growth rate of 39% among the other regions. Therefore, the Applied Ai In Energy And Utilities market in North America is expected to garner significant business opportunities for the vendors during the forecast period.

              US, China, Canada, India, Germany, UK, Mexico, Japan, France, South Korea

              • Critical imperative for grid modernization and resilienceA fundamental driver propelling the global applied AI in energy and utilities market is the urgent need to modernize aging electrical grids and enhance their resilience against a confluence of escalating threats. Infrastructure across developed nations is the driving factor this market.
              • particularly in North America and Europe is the driving factor this market.
              • is frequently decades old and was not designed to accommodate the complexities of the modern energy landscape. This aging infrastructure is increasingly vulnerable to failures exacerbated by climate change induced extreme weather events is the driving factor this market.
              • including hurricanes is the driving factor this market.
              • heatwaves is the driving factor this market.
              • and wildfires. Artificial intelligence provides a powerful suite of tools to transition from a reactive to a proactive and predictive grid management paradigm. By leveraging machine learning algorithms is the driving factor this market.
              • utilities can analyze vast datasets from sensors is the driving factor this market.
              • weather forecasts is the driving factor this market.
              • and historical outage records to predict equipment failures before they occur. This predictive maintenance capability allows for targeted is the driving factor this market.
              • cost effective repairs is the driving factor this market.
              • minimizing downtime and preventing cascading failures that can lead to widespread blackouts. The economic and social costs of such outages are substantial is the driving factor this market.
              • providing a strong financial incentive for investment in AI-driven resilience solutions. Furthermore is the driving factor this market.
              • the grid faces a growing and evolving cybersecurity threat landscape. As grid control systems become more digitized and interconnected is the driving factor this market.
              • they present a larger attack surface for malicious actors. AI is becoming indispensable for cybersecurity is the driving factor this market.
              • capable of detecting anomalous network traffic and user behavior that may signify a sophisticated cyberattack in real time. These systems can learn the normal operational patterns of a network and flag deviations instantly is the driving factor this market.
              • a task that is impossible for human analysts to perform at scale. The ability of AI to identify and isolate threats faster than traditional security measures is a critical component of protecting the national critical infrastructure. This driver is exemplified by significant government and private sector initiatives. For instance is the driving factor this market.
              • in October 2023 is the driving factor this market.
              • the U.S. Department of Energy announced a landmark $3.5 billion investment through its Grid Resilience and Innovation Partnerships Program. A substantial portion of this funding is directed toward projects that utilize AI and advanced data analytics to improve grid flexibility and resilience. Projects funded under this initiative include the deployment of AI platforms to help utilities in regions like the Pacific Northwest predict and mitigate wildfire risks by analyzing satellite imagery and sensor data to identify vulnerable power lines and overgrown vegetation. This specific application demonstrates a direct use of AI to combat a tangible is the driving factor this market.
              • climate-driven threat to grid stability. Another key aspect of this driver is the physical security and operational awareness of sprawling utility assets. AI-powered video analytics and drone inspections are revolutionizing how utilities monitor remote substations and thousands of miles of transmission lines. In March 2024 is the driving factor this market.
              • NVIDIA highlighted at its GTC conference the growing use of its Metropolis framework for creating AI-enabled security and inspection solutions. Utilities are deploying these systems to automate the inspection of critical components is the driving factor this market.
              • using computer vision to detect defects is the driving factor this market.
              • corrosion is the driving factor this market.
              • or damage with a higher degree of accuracy and frequency than manual inspections. This not only enhances safety and reliability but also reduces operational costs and risks to human workers. The development of sophisticated digital twins is the driving factor this market.
              • which are virtual replicas of physical grid assets is the driving factor this market.
              • also falls under this driver. These AI-driven models allow operators to simulate the impact of various stressors is the driving factor this market.
              • from cyberattacks to severe storms is the driving factor this market.
              • enabling them to develop and test mitigation strategies in a risk free environment. This comprehensive push towards a more intelligent is the driving factor this market.
              • self-healing is the driving factor this market.
              • and secure grid is the driving factor this market.
              • backed by substantial government investment and catalyzed by tangible threats is the driving factor this market.
              • represents a powerful and enduring driver for the adoption of applied AI in the sector. is the driving factor this market.

              The Applied Ai In Energy And Utilities market vendors should focus on grabbing business opportunities from the Cloud-based segment as it accounted for the largest market share in the base year.