Aquatic Feed Ingredients And Products Market Analysis, Size, and Forecast 2026-2030: APAC (China, India, and Indonesia), Europe (UK, France, and Spain), North America (US, Canada, and Mexico), South America (Brazil and Argentina), Middle East and Africa (South Africa, Turkey, and Saudi Arabia), and Rest of World (ROW)

Aquatic Feed Ingredients And Products Market Analysis, Size, and Forecast 2026-2030:
APAC (China, India, and Indonesia), Europe (UK, France, and Spain), North America (US, Canada, and Mexico), South America (Brazil and Argentina), Middle East and Africa (South Africa, Turkey, and Saudi Arabia), and Rest of World (ROW)

Published: Dec 2025 298 Pages SKU: IRTNTR45468

Market Overview at a Glance

$5.44 B
Market Opportunity
6%
CAGR 2025 - 2030
43.7%
APAC Growth
$11.63 B
Fishes segment 2024

Aquatic Feed Ingredients And Products Market Size 2026-2030

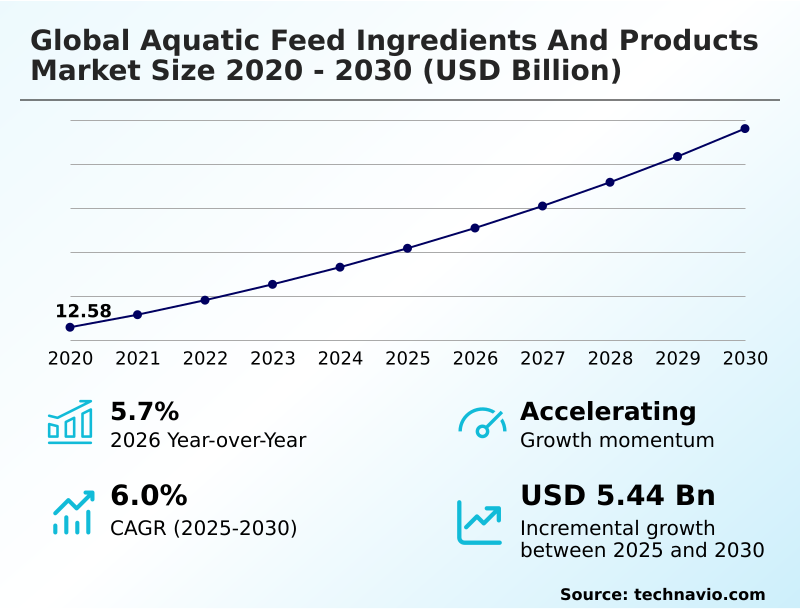
The aquatic feed ingredients and products market size is valued to increase by USD 5.44 billion, at a CAGR of 6% from 2025 to 2030. Increase in production of nutrient-rich, aquatic-based food will drive the aquatic feed ingredients and products market.

Major Market Trends & Insights

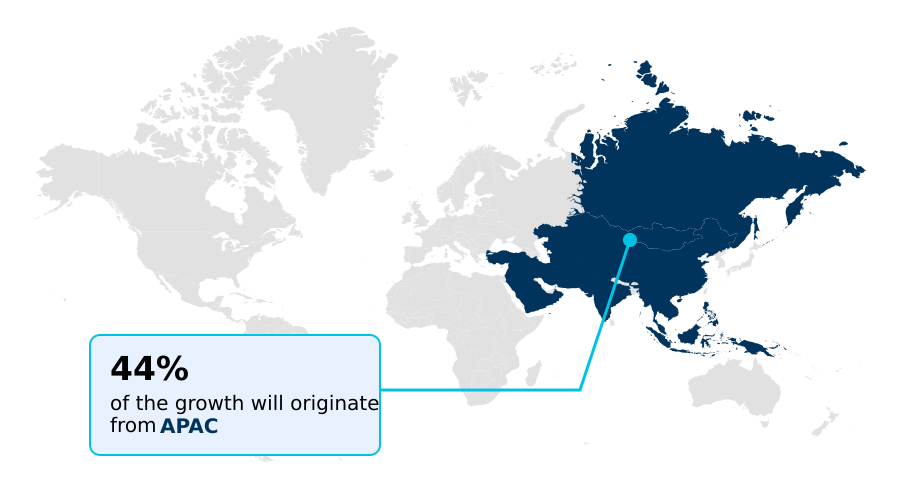
  • APAC dominated the market and accounted for a 43.7% growth during the forecast period.
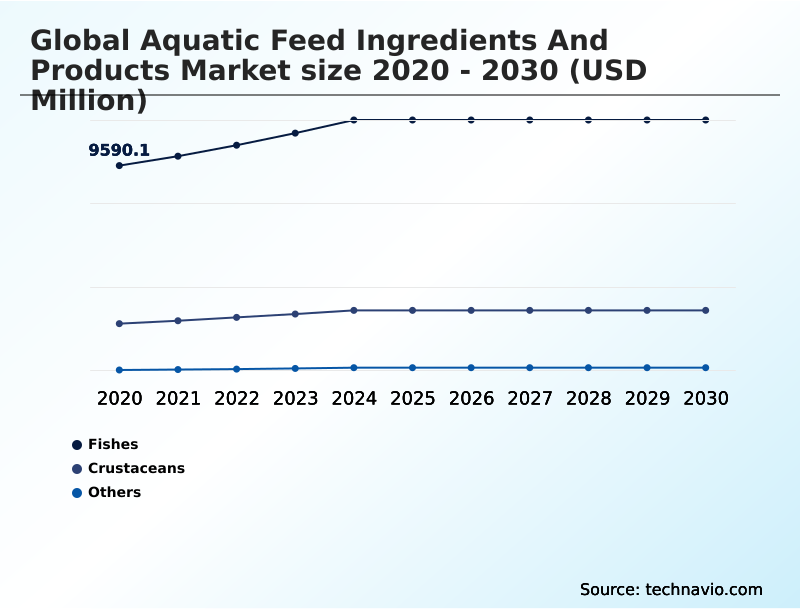
  • By Type - Fishes segment was valued at USD 11.63 billion in 2024
  • By Product - Soybean segment accounted for the largest market revenue share in 2024

Market Size & Forecast

  • Market Opportunities: USD 9.03 billion
  • Market Future Opportunities: USD 5.44 billion
  • CAGR from 2025 to 2030 : 6%

Market Summary

  • The aquatic feed ingredients and products market is evolving rapidly, driven by the dual imperatives of enhancing food security and ensuring environmental sustainability. At the core of this transformation is a strategic shift away from traditional reliance on finite marine resources toward a diversified portfolio of innovative inputs.
  • This includes the integration of alternative protein sources such as insect meal, single-cell proteins, and advanced plant-based proteins, which are critical for formulating nutritionally balanced feed. A key business scenario involves a feed manufacturer leveraging precision nutrition principles to develop specialized fish feed.
  • By optimizing the amino acid profile and using functional additives, the company improves the feed conversion ratio, which directly boosts farmer profitability. This approach also reduces nutrient discharge, helping aquaculture operations comply with tightening environmental regulations.
  • Furthermore, advancements in extrusion technology and microencapsulation are enhancing nutrient digestibility and the efficacy of probiotic supplements, supporting overall fish health management and the production of high-quality seafood for a growing global population.

What will be the Size of the Aquatic Feed Ingredients And Products Market during the forecast period?

Get Key Insights on Market Forecast (PDF) Request Free Sample

How is the Aquatic Feed Ingredients And Products Market Segmented?

The aquatic feed ingredients and products industry research report provides comprehensive data (region-wise segment analysis), with forecasts and estimates in "USD million" for the period 2026-2030, as well as historical data from 2020-2024 for the following segments.

  • Type
    • Fishes
    • Crustaceans
    • Others
  • Product
    • Soybean
    • Fish meal and fish oil
    • Corn or maize
    • Others
  • Product type
    • Pellets
    • Extruded
    • Powdered
    • Liquid
  • Geography
    • APAC
      • China
      • India
      • Indonesia
    • Europe
      • UK
      • France
      • Spain
    • North America
      • US
      • Canada
      • Mexico
    • South America
      • Brazil
      • Argentina
    • Middle East and Africa
      • South Africa
      • Turkey
      • Saudi Arabia
    • Rest of World (ROW)

By Type Insights

The fishes segment is estimated to witness significant growth during the forecast period.

The fishes segment is undergoing a significant transformation, driven by the adoption of high-performance aquafeed. This shift is characterized by a move towards precision nutrition and the reduction of marine-derived ingredients to improve sustainability.

Data-driven formulations that optimize nutrient retention and minimize environmental impact are becoming standard. Key focus areas include the development of species-specific diets and advanced feed formulation to reduce nitrogen excretion, a critical factor for regulatory compliance.

For instance, innovations have enabled a reduction in the forage fish dependency ratio to as low as 0.37, showcasing the industry's progress in decoupling growth from wild-caught resources.

The emphasis on high-energy feeds and functional feed ingredients is paramount for enhancing feed conversion ratio and supporting the long-term viability of finfish aquaculture.

Request Free Sample

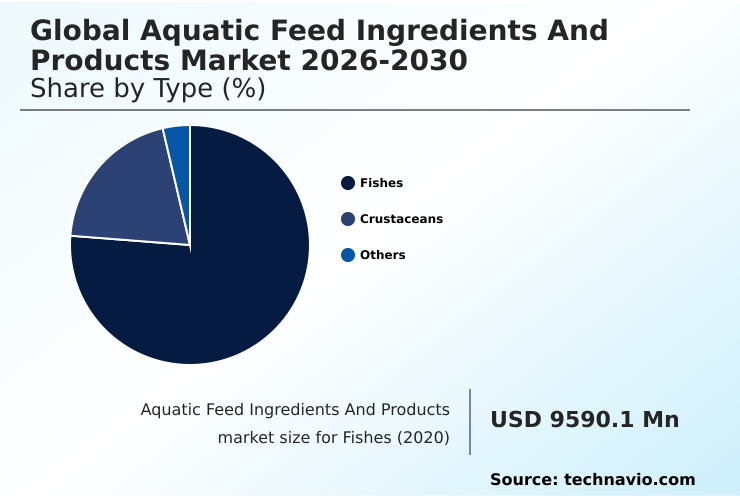
The Fishes segment was valued at USD 11.63 billion in 2024 and showed a gradual increase during the forecast period.

Request Free Sample

Regional Analysis

APAC is estimated to contribute 43.7% to the growth of the global market during the forecast period.Technavio’s analysts have elaborately explained the regional trends and drivers that shape the market during the forecast period.

See How Aquatic Feed Ingredients And Products Market Demand is Rising in APAC Request Free Sample

The geographic landscape of the market is dominated by the APAC region, which accounts for over 60% of global aquaculture output and contributes 43.7% of the industry's incremental growth.

Countries like China, India, and Vietnam are pivotal, transitioning from volume-based production to sophisticated operations using advanced aquafeed raw materials and sustainable aquaculture feed.

Europe, particularly Norway, sets global benchmarks for sustainability, pioneering low fishmeal diets and circular economy in aquaculture. In North America, the focus is on technology-driven solutions for recirculating aquaculture systems and antibiotic-free aquafeed.

South America, led by Chile and Ecuador, is a major supplier of salmon and shrimp, with a strong emphasis on salmon feed ingredients and shrimp feed formulation.

The Middle East and Africa is an emerging frontier, with governments promoting aquaculture to enhance food security.

Market Dynamics

Our researchers analyzed the data with 2025 as the base year, along with the key drivers, trends, and challenges. A holistic analysis of drivers will help companies refine their marketing strategies to gain a competitive advantage.

  • The strategic direction of the global aquatic feed ingredients and products market is increasingly defined by complex formulation and sourcing decisions. A primary focus is on understanding the impact of alternative proteins on feed conversion, with extensive research comparing plant-based vs marine proteins in aquafeed to optimize both cost and performance.
  • The role of enzymes in improving nutrient utilization has become critical, allowing for higher inclusion of novel ingredients. However, significant challenges in sourcing sustainable fishmeal and fish oil persist, driving innovation in raw material supply chains. The benefits of extruded feeds over pelleted feeds, particularly in enhancing digestibility, are widely recognized, fueling investment in advanced processing.
  • This is complemented by technology for reducing nutrient discharge from aquafeed, which is essential for regulatory compliance. Key strategies for managing raw material price volatility include diversifying protein sources and forward contracting. Concurrently, formulating diets for high-density aquaculture systems requires a deep understanding of the importance of functional additives for disease resistance.
  • The nutritional requirements for early-stage larval diets are also receiving significant attention, leading to advancements in microencapsulation for aquafeed delivery. For high-value species, optimizing omega-3 fatty acid profiles in salmon feed remains a priority. The cost-benefit analysis of using insect meal in aquafeed is proving favorable, though the regulatory landscape for novel feed ingredients is still evolving.
  • Finally, developing aquafeed for recirculating aquaculture systems and improving water stability of shrimp feed pellets represent key technical frontiers where precision nutrition to enhance feed conversion ratio is being applied.

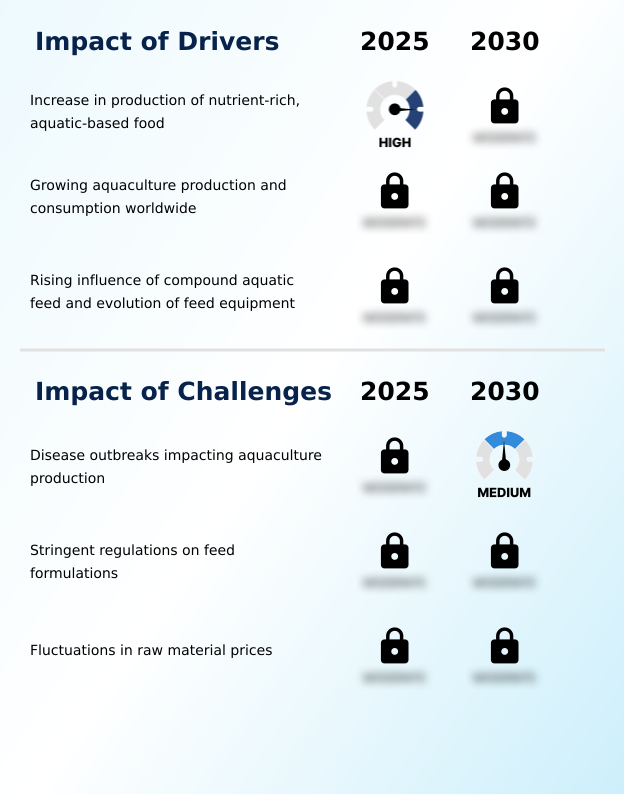
What are the key market drivers leading to the rise in the adoption of Aquatic Feed Ingredients And Products Industry?

  • The increase in production of nutrient-rich, aquatic-based food is a key driver for the market, fueled by rising consumer health awareness and growing demand for high-quality aquaculture products.

  • Market growth is driven by the rising global demand for a sustainable protein source and the expansion of intensive aquaculture systems.
  • The increasing production of fortified aquatic food, rich in essential nutrients, is supported by the adoption of nutritionally balanced feed.
  • The evolution of feed equipment, such as precision extrusion systems that improve nutrient retention by over 10%, enables the production of high-performance compound aquatic feed. These advanced feeds improve feed conversion ratios by approximately 12% compared to traditional farm-made feeds.
  • This synergy between advanced formulations and modern equipment allows for optimizing growth rates and enhancing fish health management, meeting the productivity demands of the rapidly expanding aquaculture sector worldwide while addressing sustainability goals.

What are the market trends shaping the Aquatic Feed Ingredients And Products Industry?

  • Growing technological advancement is a significant trend shaping the market, as innovations are increasingly leveraged to improve feed efficiency, sustainability, and overall profitability.

  • Key trends are reshaping the market, with a strong emphasis on technological integration and sustainable sourcing. The adoption of advanced technologies is improving feed production, with AI-driven automated feeding systems optimizing consumption and reducing waste by up to 15%. Innovations in feed formulation, including microencapsulation, are enhancing the nutritional bioavailability of key ingredients.
  • For instance, this method can improve the stability and delivery of sensitive vitamins and probiotics, increasing their efficacy by over 20%. The rising usage of high-standard raw materials, such as non-GMO soy protein concentrate and other plant-based proteins, reflects a market-wide shift towards sustainability.
  • This focus on tilapia feed composition and finfish diet optimization is driving demand for high-quality, traceable ingredients that support both animal health and environmental stewardship.

What challenges does the Aquatic Feed Ingredients And Products Industry face during its growth?

  • Disease outbreaks that impact aquaculture production represent a key challenge affecting industry growth, causing significant economic losses and disrupting feed demand.

  • The market faces significant hurdles, primarily from biological and economic volatility. Disease outbreaks remain a persistent threat, with events like Early Mortality Syndrome having previously reduced shrimp output by up to 40% in affected regions. This necessitates a focus on disease resistance in shrimp and other species through functional feeds.
  • Another major challenge is raw material price volatility, where fluctuations can increase production costs by more than 30% during periods of scarcity, impacting profitability. These price swings strain supply chains and complicate long-term planning.
  • Navigating these challenges requires robust risk management, investment in biosecurity, and diversification of raw material sourcing to ensure a stable and resilient supply chain for feed manufacturers.

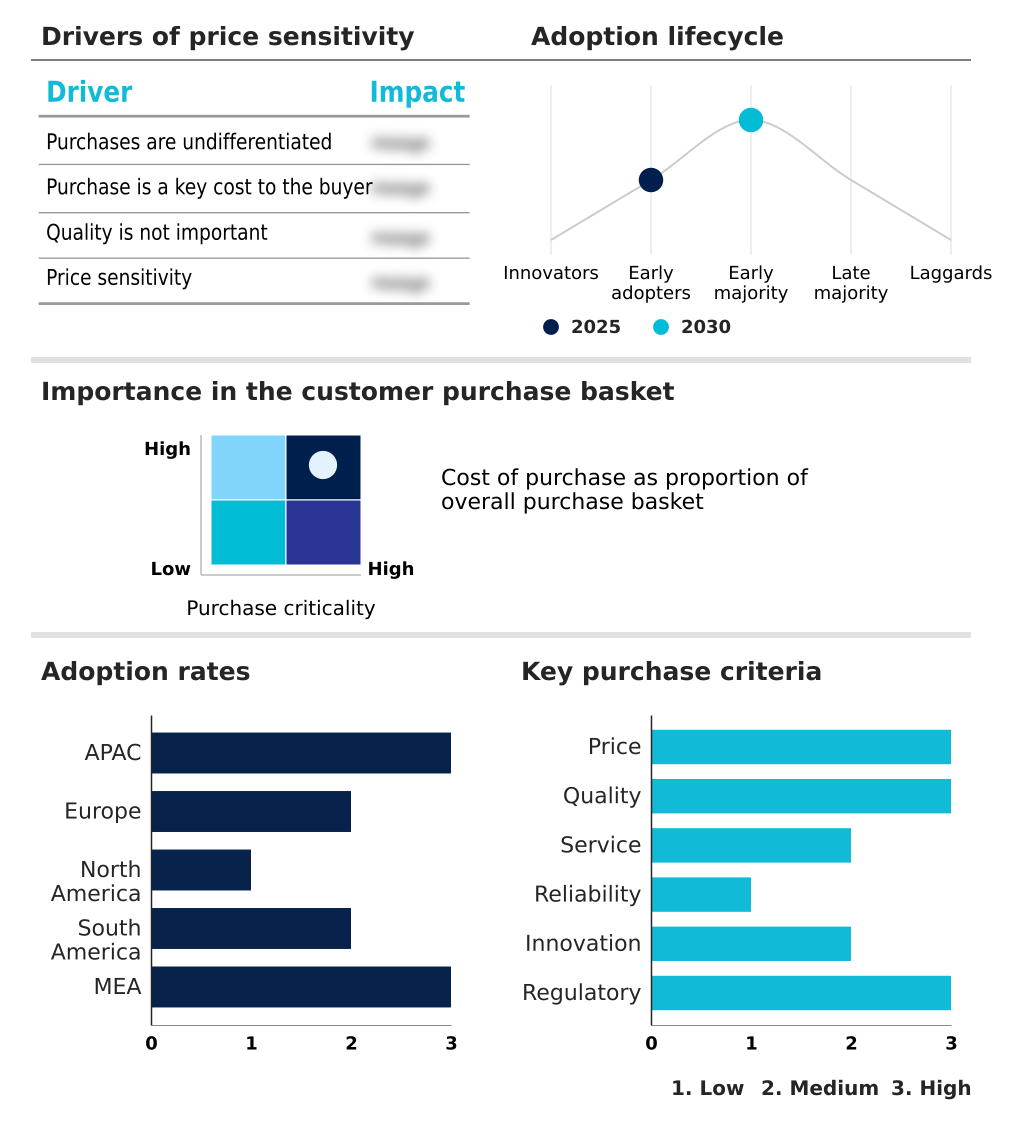
Exclusive Technavio Analysis on Customer Landscape

The aquatic feed ingredients and products market forecasting report includes the adoption lifecycle of the market, covering from the innovator’s stage to the laggard’s stage. It focuses on adoption rates in different regions based on penetration. Furthermore, the aquatic feed ingredients and products market report also includes key purchase criteria and drivers of price sensitivity to help companies evaluate and develop their market growth analysis strategies.

Customer Landscape of Aquatic Feed Ingredients And Products Industry

Competitive Landscape

Companies are implementing various strategies, such as strategic alliances, aquatic feed ingredients and products market forecast, partnerships, mergers and acquisitions, geographical expansion, and product/service launches, to enhance their presence in the industry.

Aller Aqua AS - Key offerings focus on developing advanced, high-performance nutritional solutions, including specialized functional feeds tailored to enhance health and growth across diverse aquatic species.

The industry research and growth report includes detailed analyses of the competitive landscape of the market and information about key companies, including:

  • Aller Aqua AS
  • Alltech Inc.
  • Archer Daniels Midland Co.
  • Beneo GmbH
  • Bentoli
  • BioMar Group
  • Darling Ingredients Inc.
  • DSM Firmenich AG
  • ESSECO Srl
  • IB Group
  • Kemin Industries Inc.
  • Krill Canada Corp.
  • Novus International Inc.
  • Nutreco N.V.
  • Ridley Corp. Ltd.
  • Skretting
  • Uniscope Inc.
  • UNO FEEDS
  • Prairie Aquatech

Qualitative and quantitative analysis of companies has been conducted to help clients understand the wider business environment as well as the strengths and weaknesses of key industry players. Data is qualitatively analyzed to categorize companies as pure play, category-focused, industry-focused, and diversified; it is quantitatively analyzed to categorize companies as dominant, leading, strong, tentative, and weak.

Recent Development and News in Aquatic feed ingredients and products market

  • In October 2024, BioMar Group presented new research findings that demonstrated the functional health benefits of including insect meal in shrimp diets, highlighting improved disease resistance and immune function.
  • In February 2025, Skretting partnered with salmon farms in Norway to launch a premium feed line enriched with algae-derived omega-3 oils and tailored amino acid profiles, aimed at boosting growth rates and nutritional quality.
  • In April 2025, BioMar Group announced it had established a supply chain for soybean oil that meets stringent deforestation-free criteria, ensuring compliance with the European Union Deforestation Regulation (EUDR) for its aquafeeds.
  • In May 2025, Nutreco introduced a next-generation feed extrusion line integrated with AI-driven controls at its facility in Chile to produce premium compound feeds for salmon with enhanced digestibility and minimal environmental impact.

Dive into Technavio’s robust research methodology, blending expert interviews, extensive data synthesis, and validated models for unparalleled Aquatic Feed Ingredients And Products Market insights. See full methodology.

Market Scope
Page number 298
Base year 2025
Historic period 2020-2024
Forecast period 2026-2030
Growth momentum & CAGR Accelerate at a CAGR of 6%
Market growth 2026-2030 USD 5443.7 million
Market structure Fragmented
YoY growth 2025-2026(%) 5.7%
Key countries China, India, Vietnam, Indonesia, Thailand, Japan, Norway, UK, France, Spain, Italy, The Netherlands, US, Canada, Mexico, Chile, Brazil, Argentina, Egypt, South Africa, Turkey, Saudi Arabia and UAE
Competitive landscape Leading Companies, Market Positioning of Companies, Competitive Strategies, and Industry Risks

Request Free Sample

Research Analyst Overview

  • The aquatic feed ingredients and products market is defined by a sophisticated interplay between scientific innovation and operational sustainability. The industry is moving beyond basic nutrition, focusing on species-specific diets that leverage precise amino acid profiles to maximize growth and health.
  • A key boardroom decision revolves around investment in alternative protein sources, such as algal oils, insect meal, and single-cell proteins, to mitigate the volatility of traditional fishmeal and fish oil markets and meet stringent sustainability mandates. Advanced extrusion technology and microencapsulation technology are being employed to enhance nutrient digestibility and protect functional additives like feed enzymes and probiotic supplements.
  • This ensures the delivery of high-energy feeds, including specialized grower feed, finisher feed, and larval diets, with superior pellet durability and water stability. Formulations increasingly incorporate plant-based proteins alongside marine-derived proteins to achieve optimal crustacean nutrition and finfish nutrition. This focus on precision nutrition is critical for improving the feed conversion ratio and reducing nutrient discharge.
  • Advanced aquafeed quality control and feed raw material traceability are essential for managing biosecurity measures, with innovations in feed formulation improving nutrient bioavailability by over 20%.

What are the Key Data Covered in this Aquatic Feed Ingredients And Products Market Research and Growth Report?

  • What is the expected growth of the Aquatic Feed Ingredients And Products Market between 2026 and 2030?

    • USD 5.44 billion, at a CAGR of 6%

  • What segmentation does the market report cover?

    • The report is segmented by Type (Fishes, Crustaceans, and Others), Product (Soybean, Fish meal and fish oil, Corn or maize, and Others), Product Type (Pellets, Extruded, Powdered, and Liquid) and Geography (APAC, Europe, North America, South America, Middle East and Africa)

  • Which regions are analyzed in the report?

    • APAC, Europe, North America, South America and Middle East and Africa

  • What are the key growth drivers and market challenges?

    • Increase in production of nutrient-rich, aquatic-based food, Disease outbreaks impacting aquaculture production

  • Who are the major players in the Aquatic Feed Ingredients And Products Market?

    • Aller Aqua AS, Alltech Inc., Archer Daniels Midland Co., Beneo GmbH, Bentoli, BioMar Group, Darling Ingredients Inc., DSM Firmenich AG, ESSECO Srl, IB Group, Kemin Industries Inc., Krill Canada Corp., Novus International Inc., Nutreco N.V., Ridley Corp. Ltd., Skretting, Uniscope Inc., UNO FEEDS and Prairie Aquatech

Market Research Insights

  • Market dynamics are increasingly shaped by the pursuit of efficiency and sustainability, with a clear trend toward high-performance aquafeed. The adoption of advanced feed manufacturing techniques enables producers to create nutritionally balanced feed that significantly improves growth rates. For instance, optimized shrimp feed formulation has been shown to increase survival rates by over 15% in intensive aquaculture systems.
  • Concurrently, the strategic use of a sustainable protein source is reducing dependency on marine ingredients, with some formulations achieving a 40% lower fish-in-fish-out ratio. This focus on improving feed efficiency and raw material traceability aligns with demands for a reduced environmental footprint, positioning circular economy principles as a central pillar of competitive strategy.
  • These shifts underscore a market focused on delivering value through superior animal performance and verifiable sustainability.

We can help! Our analysts can customize this aquatic feed ingredients and products market research report to meet your requirements.

Get in touch

1. Executive Summary

1.1 Market overview

Executive Summary - Chart on Market Overview
Executive Summary - Data Table on Market Overview
Executive Summary - Chart on Global Market Characteristics
Executive Summary - Chart on Market by Geography
Executive Summary - Chart on Market Segmentation by Type
Executive Summary - Chart on Market Segmentation by Product
Executive Summary - Chart on Market Segmentation by Product Type
Executive Summary - Chart on Incremental Growth
Executive Summary - Data Table on Incremental Growth
Executive Summary - Chart on Company Market Positioning

2. Technavio Analysis

2.1 Analysis of price sensitivity, lifecycle, customer purchase basket, adoption rates, and purchase criteria

2.2 Criticality of inputs and Factors of differentiation

Chart on Overview on criticality of inputs and factors of differentiation

2.3 Factors of disruption

Chart on Overview on factors of disruption

2.4 Impact of drivers and challenges

Chart on Impact of drivers and challenges in 2025 and 2030

3. Market Landscape

3.1 Market ecosystem

Chart on Parent Market
Data Table on - Parent Market

3.2 Market characteristics

Chart on Market characteristics analysis

3.3 Value chain analysis

Chart on Value chain analysis

4. Market Sizing

4.1 Market definition

Data Table on Offerings of companies included in the market definition

4.2 Market segment analysis

Market segments

4.3 Market size 2025

4.4 Market outlook: Forecast for 2025-2030

Chart on Global - Market size and forecast 2025-2030 ($ million)
Data Table on Global - Market size and forecast 2025-2030 ($ million)
Chart on Global Market: Year-over-year growth 2025-2030 (%)
Data Table on Global Market: Year-over-year growth 2025-2030 (%)

5. Historic Market Size

5.1 Global Aquatic Feed Ingredients And Products Market 2020 - 2024

Historic Market Size - Data Table on Global Aquatic Feed Ingredients And Products Market 2020 - 2024 ($ million)

5.2 Type segment analysis 2020 - 2024

Historic Market Size - Type Segment 2020 - 2024 ($ million)

5.3 Product segment analysis 2020 - 2024

Historic Market Size - Product Segment 2020 - 2024 ($ million)

5.4 Product Type segment analysis 2020 - 2024

Historic Market Size - Product Type Segment 2020 - 2024 ($ million)

5.5 Geography segment analysis 2020 - 2024

Historic Market Size - Geography Segment 2020 - 2024 ($ million)

5.6 Country segment analysis 2020 - 2024

Historic Market Size - Country Segment 2020 - 2024 ($ million)

6. Qualitative Analysis

6.1 Impact of AI on Global Aquatic Feed Ingredients and Products Market

7. Five Forces Analysis

7.1 Five forces summary

Five forces analysis - Comparison between 2025 and 2030

7.2 Bargaining power of buyers

Bargaining power of buyers - Impact of key factors 2025 and 2030

7.3 Bargaining power of suppliers

Bargaining power of suppliers - Impact of key factors in 2025 and 2030

7.4 Threat of new entrants

Threat of new entrants - Impact of key factors in 2025 and 2030

7.5 Threat of substitutes

Threat of substitutes - Impact of key factors in 2025 and 2030

7.6 Threat of rivalry

Threat of rivalry - Impact of key factors in 2025 and 2030

7.7 Market condition

Chart on Market condition - Five forces 2025 and 2030

8. Market Segmentation by Type

8.1 Market segments

Chart on Type - Market share 2025-2030 (%)
Data Table on Type - Market share 2025-2030 (%)

8.2 Comparison by Type

Chart on Comparison by Type
Data Table on Comparison by Type

8.3 Fishes - Market size and forecast 2025-2030

Chart on Fishes - Market size and forecast 2025-2030 ($ million)
Data Table on Fishes - Market size and forecast 2025-2030 ($ million)
Chart on Fishes - Year-over-year growth 2025-2030 (%)
Data Table on Fishes - Year-over-year growth 2025-2030 (%)

8.4 Crustaceans - Market size and forecast 2025-2030

Chart on Crustaceans - Market size and forecast 2025-2030 ($ million)
Data Table on Crustaceans - Market size and forecast 2025-2030 ($ million)
Chart on Crustaceans - Year-over-year growth 2025-2030 (%)
Data Table on Crustaceans - Year-over-year growth 2025-2030 (%)

8.5 Others - Market size and forecast 2025-2030

Chart on Others - Market size and forecast 2025-2030 ($ million)
Data Table on Others - Market size and forecast 2025-2030 ($ million)
Chart on Others - Year-over-year growth 2025-2030 (%)
Data Table on Others - Year-over-year growth 2025-2030 (%)

8.6 Market opportunity by Type

Market opportunity by Type ($ million)
Data Table on Market opportunity by Type ($ million)

9. Market Segmentation by Product

9.1 Market segments

Chart on Product - Market share 2025-2030 (%)
Data Table on Product - Market share 2025-2030 (%)

9.2 Comparison by Product

Chart on Comparison by Product
Data Table on Comparison by Product

9.3 Soybean - Market size and forecast 2025-2030

Chart on Soybean - Market size and forecast 2025-2030 ($ million)
Data Table on Soybean - Market size and forecast 2025-2030 ($ million)
Chart on Soybean - Year-over-year growth 2025-2030 (%)
Data Table on Soybean - Year-over-year growth 2025-2030 (%)

9.4 Fish meal and fish oil - Market size and forecast 2025-2030

Chart on Fish meal and fish oil - Market size and forecast 2025-2030 ($ million)
Data Table on Fish meal and fish oil - Market size and forecast 2025-2030 ($ million)
Chart on Fish meal and fish oil - Year-over-year growth 2025-2030 (%)
Data Table on Fish meal and fish oil - Year-over-year growth 2025-2030 (%)

9.5 Corn or maize - Market size and forecast 2025-2030

Chart on Corn or maize - Market size and forecast 2025-2030 ($ million)
Data Table on Corn or maize - Market size and forecast 2025-2030 ($ million)
Chart on Corn or maize - Year-over-year growth 2025-2030 (%)
Data Table on Corn or maize - Year-over-year growth 2025-2030 (%)

9.6 Others - Market size and forecast 2025-2030

Chart on Others - Market size and forecast 2025-2030 ($ million)
Data Table on Others - Market size and forecast 2025-2030 ($ million)
Chart on Others - Year-over-year growth 2025-2030 (%)
Data Table on Others - Year-over-year growth 2025-2030 (%)

9.7 Market opportunity by Product

Market opportunity by Product ($ million)
Data Table on Market opportunity by Product ($ million)

10. Market Segmentation by Product Type

10.1 Market segments

Chart on Product Type - Market share 2025-2030 (%)
Data Table on Product Type - Market share 2025-2030 (%)

10.2 Comparison by Product Type

Chart on Comparison by Product Type
Data Table on Comparison by Product Type

10.3 Pellets - Market size and forecast 2025-2030

Chart on Pellets - Market size and forecast 2025-2030 ($ million)
Data Table on Pellets - Market size and forecast 2025-2030 ($ million)
Chart on Pellets - Year-over-year growth 2025-2030 (%)
Data Table on Pellets - Year-over-year growth 2025-2030 (%)

10.4 Extruded - Market size and forecast 2025-2030

Chart on Extruded - Market size and forecast 2025-2030 ($ million)
Data Table on Extruded - Market size and forecast 2025-2030 ($ million)
Chart on Extruded - Year-over-year growth 2025-2030 (%)
Data Table on Extruded - Year-over-year growth 2025-2030 (%)

10.5 Powdered - Market size and forecast 2025-2030

Chart on Powdered - Market size and forecast 2025-2030 ($ million)
Data Table on Powdered - Market size and forecast 2025-2030 ($ million)
Chart on Powdered - Year-over-year growth 2025-2030 (%)
Data Table on Powdered - Year-over-year growth 2025-2030 (%)

10.6 Liquid - Market size and forecast 2025-2030

Chart on Liquid - Market size and forecast 2025-2030 ($ million)
Data Table on Liquid - Market size and forecast 2025-2030 ($ million)
Chart on Liquid - Year-over-year growth 2025-2030 (%)
Data Table on Liquid - Year-over-year growth 2025-2030 (%)

10.7 Market opportunity by Product Type

Market opportunity by Product Type ($ million)
Data Table on Market opportunity by Product Type ($ million)

11. Customer Landscape

11.1 Customer landscape overview

Analysis of price sensitivity, lifecycle, customer purchase basket, adoption rates, and purchase criteria

12. Geographic Landscape

12.1 Geographic segmentation

Chart on Market share by geography 2025-2030 (%)
Data Table on Market share by geography 2025-2030 (%)

12.2 Geographic comparison

Chart on Geographic comparison
Data Table on Geographic comparison

12.3 APAC - Market size and forecast 2025-2030

Chart on APAC - Market size and forecast 2025-2030 ($ million)
Data Table on APAC - Market size and forecast 2025-2030 ($ million)
Chart on APAC - Year-over-year growth 2025-2030 (%)
Data Table on APAC - Year-over-year growth 2025-2030 (%)
Chart on Regional Comparison - APAC
Data Table on Regional Comparison - APAC

12.3.1 China - Market size and forecast 2025-2030

Chart on China - Market size and forecast 2025-2030 ($ million)
Data Table on China - Market size and forecast 2025-2030 ($ million)
Chart on China - Year-over-year growth 2025-2030 (%)
Data Table on China - Year-over-year growth 2025-2030 (%)

12.3.2 India - Market size and forecast 2025-2030

Chart on India - Market size and forecast 2025-2030 ($ million)
Data Table on India - Market size and forecast 2025-2030 ($ million)
Chart on India - Year-over-year growth 2025-2030 (%)
Data Table on India - Year-over-year growth 2025-2030 (%)

12.3.3 Vietnam - Market size and forecast 2025-2030

Chart on Vietnam - Market size and forecast 2025-2030 ($ million)
Data Table on Vietnam - Market size and forecast 2025-2030 ($ million)
Chart on Vietnam - Year-over-year growth 2025-2030 (%)
Data Table on Vietnam - Year-over-year growth 2025-2030 (%)

12.3.4 Indonesia - Market size and forecast 2025-2030

Chart on Indonesia - Market size and forecast 2025-2030 ($ million)
Data Table on Indonesia - Market size and forecast 2025-2030 ($ million)
Chart on Indonesia - Year-over-year growth 2025-2030 (%)
Data Table on Indonesia - Year-over-year growth 2025-2030 (%)

12.3.5 Thailand - Market size and forecast 2025-2030

Chart on Thailand - Market size and forecast 2025-2030 ($ million)
Data Table on Thailand - Market size and forecast 2025-2030 ($ million)
Chart on Thailand - Year-over-year growth 2025-2030 (%)
Data Table on Thailand - Year-over-year growth 2025-2030 (%)

12.3.6 Japan - Market size and forecast 2025-2030

Chart on Japan - Market size and forecast 2025-2030 ($ million)
Data Table on Japan - Market size and forecast 2025-2030 ($ million)
Chart on Japan - Year-over-year growth 2025-2030 (%)
Data Table on Japan - Year-over-year growth 2025-2030 (%)

12.4 Europe - Market size and forecast 2025-2030

Chart on Europe - Market size and forecast 2025-2030 ($ million)
Data Table on Europe - Market size and forecast 2025-2030 ($ million)
Chart on Europe - Year-over-year growth 2025-2030 (%)
Data Table on Europe - Year-over-year growth 2025-2030 (%)
Chart on Regional Comparison - Europe
Data Table on Regional Comparison - Europe

12.4.1 Norway - Market size and forecast 2025-2030

Chart on Norway - Market size and forecast 2025-2030 ($ million)
Data Table on Norway - Market size and forecast 2025-2030 ($ million)
Chart on Norway - Year-over-year growth 2025-2030 (%)
Data Table on Norway - Year-over-year growth 2025-2030 (%)

12.4.2 UK - Market size and forecast 2025-2030

Chart on UK - Market size and forecast 2025-2030 ($ million)
Data Table on UK - Market size and forecast 2025-2030 ($ million)
Chart on UK - Year-over-year growth 2025-2030 (%)
Data Table on UK - Year-over-year growth 2025-2030 (%)

12.4.3 France - Market size and forecast 2025-2030

Chart on France - Market size and forecast 2025-2030 ($ million)
Data Table on France - Market size and forecast 2025-2030 ($ million)
Chart on France - Year-over-year growth 2025-2030 (%)
Data Table on France - Year-over-year growth 2025-2030 (%)

12.4.4 Spain - Market size and forecast 2025-2030

Chart on Spain - Market size and forecast 2025-2030 ($ million)
Data Table on Spain - Market size and forecast 2025-2030 ($ million)
Chart on Spain - Year-over-year growth 2025-2030 (%)
Data Table on Spain - Year-over-year growth 2025-2030 (%)

12.4.5 Italy - Market size and forecast 2025-2030

Chart on Italy - Market size and forecast 2025-2030 ($ million)
Data Table on Italy - Market size and forecast 2025-2030 ($ million)
Chart on Italy - Year-over-year growth 2025-2030 (%)
Data Table on Italy - Year-over-year growth 2025-2030 (%)

12.4.6 The Netherlands - Market size and forecast 2025-2030

Chart on The Netherlands - Market size and forecast 2025-2030 ($ million)
Data Table on The Netherlands - Market size and forecast 2025-2030 ($ million)
Chart on The Netherlands - Year-over-year growth 2025-2030 (%)
Data Table on The Netherlands - Year-over-year growth 2025-2030 (%)

12.5 North America - Market size and forecast 2025-2030

Chart on North America - Market size and forecast 2025-2030 ($ million)
Data Table on North America - Market size and forecast 2025-2030 ($ million)
Chart on North America - Year-over-year growth 2025-2030 (%)
Data Table on North America - Year-over-year growth 2025-2030 (%)
Chart on Regional Comparison - North America
Data Table on Regional Comparison - North America

12.5.1 US - Market size and forecast 2025-2030

Chart on US - Market size and forecast 2025-2030 ($ million)
Data Table on US - Market size and forecast 2025-2030 ($ million)
Chart on US - Year-over-year growth 2025-2030 (%)
Data Table on US - Year-over-year growth 2025-2030 (%)

12.5.2 Canada - Market size and forecast 2025-2030

Chart on Canada - Market size and forecast 2025-2030 ($ million)
Data Table on Canada - Market size and forecast 2025-2030 ($ million)
Chart on Canada - Year-over-year growth 2025-2030 (%)
Data Table on Canada - Year-over-year growth 2025-2030 (%)

12.5.3 Mexico - Market size and forecast 2025-2030

Chart on Mexico - Market size and forecast 2025-2030 ($ million)
Data Table on Mexico - Market size and forecast 2025-2030 ($ million)
Chart on Mexico - Year-over-year growth 2025-2030 (%)
Data Table on Mexico - Year-over-year growth 2025-2030 (%)

12.6 South America - Market size and forecast 2025-2030

Chart on South America - Market size and forecast 2025-2030 ($ million)
Data Table on South America - Market size and forecast 2025-2030 ($ million)
Chart on South America - Year-over-year growth 2025-2030 (%)
Data Table on South America - Year-over-year growth 2025-2030 (%)
Chart on Regional Comparison - South America
Data Table on Regional Comparison - South America

12.6.1 Chile - Market size and forecast 2025-2030

Chart on Chile - Market size and forecast 2025-2030 ($ million)
Data Table on Chile - Market size and forecast 2025-2030 ($ million)
Chart on Chile - Year-over-year growth 2025-2030 (%)
Data Table on Chile - Year-over-year growth 2025-2030 (%)

12.6.2 Brazil - Market size and forecast 2025-2030

Chart on Brazil - Market size and forecast 2025-2030 ($ million)
Data Table on Brazil - Market size and forecast 2025-2030 ($ million)
Chart on Brazil - Year-over-year growth 2025-2030 (%)
Data Table on Brazil - Year-over-year growth 2025-2030 (%)

12.6.3 Argentina - Market size and forecast 2025-2030

Chart on Argentina - Market size and forecast 2025-2030 ($ million)
Data Table on Argentina - Market size and forecast 2025-2030 ($ million)
Chart on Argentina - Year-over-year growth 2025-2030 (%)
Data Table on Argentina - Year-over-year growth 2025-2030 (%)

12.7 Middle East and Africa - Market size and forecast 2025-2030

Chart on Middle East and Africa - Market size and forecast 2025-2030 ($ million)
Data Table on Middle East and Africa - Market size and forecast 2025-2030 ($ million)
Chart on Middle East and Africa - Year-over-year growth 2025-2030 (%)
Data Table on Middle East and Africa - Year-over-year growth 2025-2030 (%)
Chart on Regional Comparison - Middle East and Africa
Data Table on Regional Comparison - Middle East and Africa

12.7.1 Egypt - Market size and forecast 2025-2030

Chart on Egypt - Market size and forecast 2025-2030 ($ million)
Data Table on Egypt - Market size and forecast 2025-2030 ($ million)
Chart on Egypt - Year-over-year growth 2025-2030 (%)
Data Table on Egypt - Year-over-year growth 2025-2030 (%)

12.7.2 South Africa - Market size and forecast 2025-2030

Chart on South Africa - Market size and forecast 2025-2030 ($ million)
Data Table on South Africa - Market size and forecast 2025-2030 ($ million)
Chart on South Africa - Year-over-year growth 2025-2030 (%)
Data Table on South Africa - Year-over-year growth 2025-2030 (%)

12.7.3 Turkey - Market size and forecast 2025-2030

Chart on Turkey - Market size and forecast 2025-2030 ($ million)
Data Table on Turkey - Market size and forecast 2025-2030 ($ million)
Chart on Turkey - Year-over-year growth 2025-2030 (%)
Data Table on Turkey - Year-over-year growth 2025-2030 (%)

12.7.4 Saudi Arabia - Market size and forecast 2025-2030

Chart on Saudi Arabia - Market size and forecast 2025-2030 ($ million)
Data Table on Saudi Arabia - Market size and forecast 2025-2030 ($ million)
Chart on Saudi Arabia - Year-over-year growth 2025-2030 (%)
Data Table on Saudi Arabia - Year-over-year growth 2025-2030 (%)

12.7.5 UAE - Market size and forecast 2025-2030

Chart on UAE - Market size and forecast 2025-2030 ($ million)
Data Table on UAE - Market size and forecast 2025-2030 ($ million)
Chart on UAE - Year-over-year growth 2025-2030 (%)
Data Table on UAE - Year-over-year growth 2025-2030 (%)

12.8 Market opportunity by geography

Market opportunity by geography ($ million)
Data Tables on Market opportunity by geography ($ million)

13. Drivers, Challenges, and Opportunity

13.1 Market drivers

Increase in production of nutrient-rich, aquatic-based food
Growing aquaculture production and consumption worldwide
Rising influence of compound aquatic feed and evolution of feed equipment

13.2 Market challenges

Disease outbreaks impacting aquaculture production
Stringent regulations on feed formulations
Fluctuations in raw material prices

13.3 Impact of drivers and challenges

Impact of drivers and challenges in 2025 and 2030

13.4 Market opportunities

Growing technological advancement
Rising usage of high-standard raw materials to achieve better-quality products
Growing demand for feed enzymes

14. Competitive Landscape

14.1 Overview

14.2

Overview on criticality of inputs and factors of differentiation

14.3 Landscape disruption

Overview on factors of disruption

14.4 Industry risks

Impact of key risks on business

15. Competitive Analysis

15.1 Companies profiled

Companies covered

15.2 Company ranking index

15.3 Market positioning of companies

Matrix on companies position and classification

15.4 Aller Aqua AS

Aller Aqua AS - Overview
Aller Aqua AS - Product / Service
Aller Aqua AS - Key offerings
SWOT

15.5 Alltech Inc.

Alltech Inc. - Overview
Alltech Inc. - Product / Service
Alltech Inc. - Key news
Alltech Inc. - Key offerings
SWOT

15.6 Archer Daniels Midland Co.

Archer Daniels Midland Co. - Overview
Archer Daniels Midland Co. - Business segments
Archer Daniels Midland Co. - Key news
Archer Daniels Midland Co. - Key offerings
Archer Daniels Midland Co. - Segment focus
SWOT

15.7 Beneo GmbH

Beneo GmbH - Overview
Beneo GmbH - Product / Service
Beneo GmbH - Key news
Beneo GmbH - Key offerings
SWOT

15.8 BioMar Group

BioMar Group - Overview
BioMar Group - Product / Service
BioMar Group - Key offerings
SWOT

15.9 Darling Ingredients Inc.

Darling Ingredients Inc. - Overview
Darling Ingredients Inc. - Business segments
Darling Ingredients Inc. - Key news
Darling Ingredients Inc. - Key offerings
Darling Ingredients Inc. - Segment focus
SWOT

15.10 DSM Firmenich AG

DSM Firmenich AG - Overview
DSM Firmenich AG - Product / Service
DSM Firmenich AG - Key offerings
SWOT

15.11 ESSECO Srl

ESSECO Srl - Overview
ESSECO Srl - Product / Service
ESSECO Srl - Key offerings
SWOT

15.12 IB Group

IB Group - Overview
IB Group - Product / Service
IB Group - Key offerings
SWOT

15.13 Kemin Industries Inc.

Kemin Industries Inc. - Overview
Kemin Industries Inc. - Product / Service
Kemin Industries Inc. - Key news
Kemin Industries Inc. - Key offerings
SWOT

15.14 Novus International Inc.

Novus International Inc. - Overview
Novus International Inc. - Product / Service
Novus International Inc. - Key offerings
SWOT

15.15 Nutreco N.V.

Nutreco N.V. - Overview
Nutreco N.V. - Product / Service
Nutreco N.V. - Key offerings
SWOT

15.16 Ridley Corp. Ltd.

Ridley Corp. Ltd. - Overview
Ridley Corp. Ltd. - Business segments
Ridley Corp. Ltd. - Key offerings
Ridley Corp. Ltd. - Segment focus
SWOT

15.17 Skretting

Skretting - Overview
Skretting - Product / Service
Skretting - Key offerings
SWOT

15.18 UNO FEEDS

UNO FEEDS - Overview
UNO FEEDS - Product / Service
UNO FEEDS - Key offerings
SWOT

16. Appendix

16.1 Scope of the report

Market definition
Objectives
Notes and caveats

16.2 Inclusions and exclusions checklist

Inclusions checklist
Exclusions checklist

16.3 Currency conversion rates for US$

16.4 Research methodology

16.5 Data procurement

Information sources

16.6 Data validation

16.7 Validation techniques employed for market sizing

16.8 Data synthesis

16.9 360 degree market analysis

16.10 List of abbreviations

Research Methodology

Technavio presents a detailed picture of the market by way of study, synthesis, and summation of data from multiple sources. The analysts have presented the various facets of the market with a particular focus on identifying the key industry influencers. The data thus presented is comprehensive, reliable, and the result of extensive research, both primary and secondary.

INFORMATION SOURCES

Primary sources

  • Manufacturers and suppliers
  • Channel partners
  • Industry experts
  • Strategic decision makers

Secondary sources

  • Industry journals and periodicals
  • Government data
  • Financial reports of key industry players
  • Historical data
  • Press releases

DATA ANALYSIS

Data Synthesis

  • Collation of data
  • Estimation of key figures
  • Analysis of derived insights

Data Validation

  • Triangulation with data models
  • Reference against proprietary databases
  • Corroboration with industry experts

REPORT WRITING

Qualitative

  • Market drivers
  • Market challenges
  • Market trends
  • Five forces analysis

Quantitative

  • Market size and forecast
  • Market segmentation
  • Geographical insights
  • Competitive landscape

Interested in this report?

Get your sample now to see our research methodology and insights!

Download Now

Frequently Asked Questions

Aquatic Feed Ingredients And Products market growth will increase by USD 5443.7 million during 2026-2030 .

The Aquatic Feed Ingredients And Products market is expected to grow at a CAGR of 6% during 2026-2030 .

Aquatic Feed Ingredients And Products market is segmented by Type (Fishes, Crustaceans, Others) Product (Soybean, Fish meal and fish oil, Corn or maize, Others) Product type (Pellets, Extruded, Powdered, Liquid)

Aller Aqua AS, Alltech Inc., Archer Daniels Midland Co., Beneo GmbH, Bentoli, BioMar Group, Darling Ingredients Inc., DSM Firmenich AG, ESSECO Srl, IB Group, Kemin Industries Inc., Krill Canada Corp., Novus International Inc., Nutreco N.V., Ridley Corp. Ltd., Skretting, Uniscope Inc., UNO FEEDS, Prairie Aquatech are a few of the key vendors in the Aquatic Feed Ingredients And Products market.

APAC will register the highest growth rate of 43.7% among the other regions. Therefore, the Aquatic Feed Ingredients And Products market in APAC is expected to garner significant business opportunities for the vendors during the forecast period.

China, India, Vietnam, Indonesia, Thailand, Japan, Norway, UK, France, Spain, Italy, The Netherlands, US, Canada, Mexico, Chile, Brazil, Argentina, Egypt, South Africa, Turkey, Saudi Arabia, UAE

  • Increase in production of nutrient-rich, aquatic-based food is the driving factor this market.

The Aquatic Feed Ingredients And Products market vendors should focus on grabbing business opportunities from the Type segment as it accounted for the largest market share in the base year.