Augmented Reality (AR) Gaming Market Analysis, Size, and Forecast 2025-2029: North America (US and Canada), Europe (France, Germany, Italy, and UK), APAC (China, India, Japan, and South Korea), and Rest of World (ROW)

Augmented Reality (AR) Gaming Market Analysis, Size, and Forecast 2025-2029:
North America (US and Canada), Europe (France, Germany, Italy, and UK), APAC (China, India, Japan, and South Korea), and Rest of World (ROW)

Published: May 2025 217 Pages SKU: IRTNTR76215

Market Overview at a Glance

$118.32 B
Market Opportunity
54.2%
CAGR
38.2
YoY growth 2024-2025(%)

Augmented Reality (AR) Gaming Market Size 2025-2029

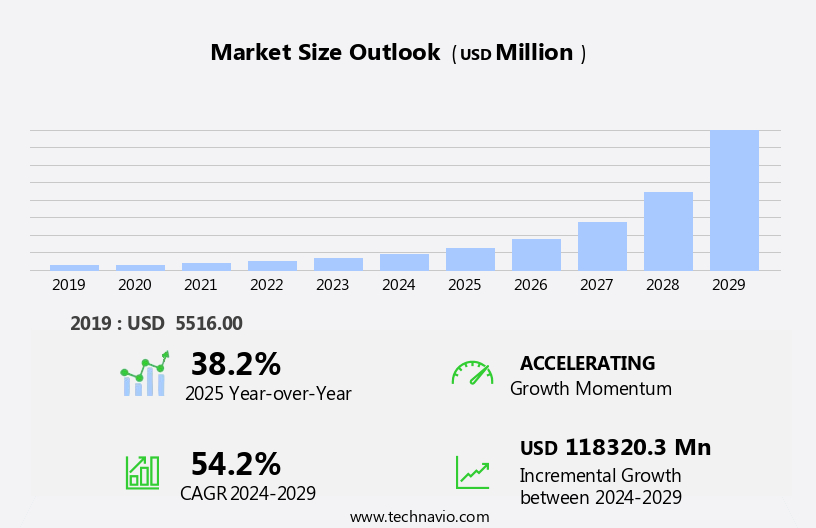
The augmented reality (ar) gaming market size is forecast to increase by USD 118.32 billion, at a CAGR of 54.2% between 2024 and 2029.

  • The market is experiencing significant growth, driven by escalating investments in AR technology and the increasing popularity of AR games. The immersive nature of AR games, which overlays digital information onto the real world, is capturing the attention of consumers and driving demand. However, the high cost associated with developing and implementing AR gaming applications poses a significant challenge for market players.
  • Companies must navigate this obstacle by exploring cost-effective solutions and partnerships to bring AR gaming experiences to a broader audience. To capitalize on this market's potential, businesses should focus on creating engaging and innovative AR gaming applications, while also addressing affordability concerns to ensure long-term success.

What will be the Size of the Augmented Reality (AR) Gaming Market during the forecast period?

Augmented Reality (AR) Gaming Market Size

Explore in-depth regional segment analysis with market size data - historical 2019-2023 and forecasts 2025-2029 - in the full report.  
Request Free Sample

The market continues to evolve, driven by advancements in network infrastructure, frame rate, head-mounted displays (HMDs), and sensor fusion technology. These innovations enable more immersive experiences, enhancing player engagement across various sectors. Real-time rendering, game engines, and environmental mapping are crucial components, ensuring seamless integration of AR SDKs, spatial computing, computer vision, and data analytics. Haptic feedback, graphics rendering, and AR headsets offer new dimensions to gaming, merging digital and physical worlds. Motion tracking, cross-platform compatibility, and GPS integration broaden accessibility, while monetization strategies, such as subscription models, virtual currency, and in-app purchases, fuel market growth.

Security protocols, churn rate, and game development are essential aspects, with cloud computing and performance optimization playing a significant role in enhancing the overall user experience. Gesture recognition, depth sensing, and voice recognition add to the interactive nature of AR gaming, creating a dynamic and ever-evolving market landscape.

How is this Augmented Reality (AR) Gaming Industry segmented?

The augmented reality (ar) gaming industry research report provides comprehensive data (region-wise segment analysis), with forecasts and estimates in "USD million" for the period 2025-2029, as well as historical data from 2019-2023 for the following segments.

  • Type
    • Mobile devices
    • HMDs
    • Smart glasses
  • Component
    • Hardware
    • Software
  • Genre
    • Adventure
    • Shooter
    • Puzzle
    • Sports and fitness
  • Business Segment
    • Free-to-play
    • Premium
    • Subscription
  • Geography
    • North America
      • US
      • Canada
    • Europe
      • France
      • Germany
      • Italy
      • UK
    • APAC
      • China
      • India
      • Japan
      • South Korea
    • Rest of World (ROW)

    By Type Insights

    The mobile devices segment is estimated to witness significant growth during the forecast period.

    The market is experiencing significant growth, with mobile devices leading the way. In 2024, mobile devices held the largest market share due to their convenience, reliability, and portability. AR gaming companies are increasingly investing in AR technology, making games available on mobile devices such as smartphones and laptops. The affordability and accessibility of these games are driving market growth. Subscription models and virtual currencies are popular monetization strategies in AR gaming. Player engagement is enhanced through motion tracking, cross-platform compatibility, environmental mapping, real-time rendering, and game engine technology. Data privacy and accessibility features are essential for maintaining user trust.

    GPS integration, social features, and avatar customization add to the immersive gaming experience. Cloud computing, gesture recognition, performance optimization, and network infrastructure ensure seamless gameplay. Frame rate, head-mounted displays (HMDs), and PC integration offer improved graphics rendering and user experience. Security protocols and churn rate management are crucial for maintaining user retention. SLAM technology, augmented reality SDKs, and spatial computing enable advanced features like object recognition and level design. Multiplayer gaming, in-app purchases, and advertising revenue are essential revenue streams. Computer vision, data analytics, haptic feedback, and voice recognition enhance the overall gaming experience. AR headsets and overlays provide a more immersive experience.

    Depth sensing and sensor fusion offer advanced motion tracking capabilities. Overall, the AR gaming market is evolving rapidly, with continuous innovation in technology and business models.

    Augmented Reality (AR) Gaming Market Size

    Request Free Sample

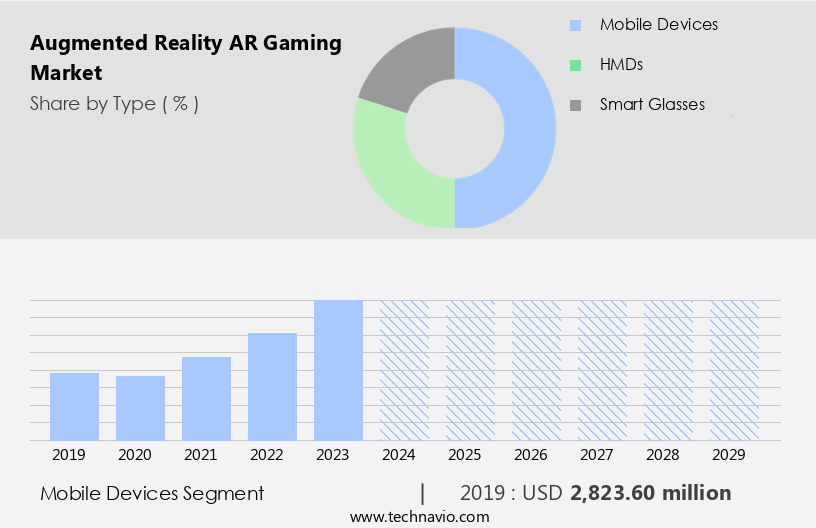
    The Mobile devices segment was valued at USD 2.82 billion in 2019 and showed a gradual increase during the forecast period.

    Regional Analysis

    North America is estimated to contribute 40% to the growth of the global market during the forecast period.Technavio’s analysts have elaborately explained the regional trends and drivers that shape the market during the forecast period.

    Augmented Reality (AR) Gaming Market Share by Geography

     Request Free Sample

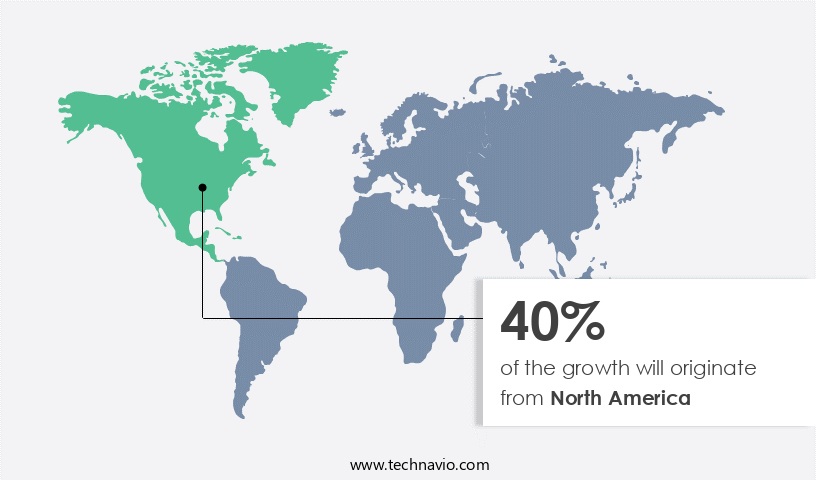
    The market is witnessing significant growth, with North America leading the way in 2024. Driven by the integration of advanced technologies such as the Internet of Things (IoT) and AR, mixed reality (MR), and virtual reality (VR), the market is experiencing a surge in innovation. AR technology, in particular, is gaining traction due to its immersive and harmonious nature. Companies like Qualcomm are heavily investing in AR technology, with a strong presence in the US market. For instance, Apple's Vision Pro, launched in February 2024, although marketed as a mixed reality headset, has opened new avenues for AR gaming experiences.

    These include narrative-driven and spatially interactive formats. Subscriptions models are increasingly popular monetization strategies, offering players unlimited access to games and additional features. Virtual currencies and in-app purchases provide alternative revenue streams. Motion tracking and depth sensing technologies enhance player engagement, while cross-platform compatibility and real-time rendering ensure seamless gameplay. Environmental mapping and SLAM technology offer more immersive gaming experiences. Data privacy and security protocols are essential considerations, with companies implementing robust performance optimization and network infrastructure to maintain high frame rates and reduce churn. Social features, avatar customization, and multiplayer gaming foster community engagement. AR SDKs and game engines facilitate game development, while cloud computing and computer vision enable data analytics and image processing.

    Haptic feedback and graphics rendering further enhance the overall gaming experience. GPS integration and voice recognition offer additional functionalities, while head-mounted displays (HMDs) and gaming console integration expand the reach of AR gaming. Gesture recognition and sensor fusion ensure intuitive user experiences. Retention rates remain a key focus, with companies implementing various strategies to keep players engaged. Advertising revenue and object recognition are emerging monetization opportunities.

    Market Dynamics

    Our researchers analyzed the data with 2024 as the base year, along with the key drivers, trends, and challenges. A holistic analysis of drivers will help companies refine their marketing strategies to gain a competitive advantage.

    The augmented reality gaming market is experiencing rapid growth, with immersive experiences captivating consumers worldwide. AR technology merges digital content with the real world, revolutionizing gaming. Players engage with interactive 3D models, virtual objects, and holograms, creating a captivating and engaging environment. AR gaming apps utilize advanced features like facial recognition, motion tracking, and location-based services to enhance gameplay. The market is driven by consumer demand for innovative gaming experiences, with applications extending beyond entertainment to education, healthcare, and retail. AR gaming offers a new dimension in social interaction, enabling multiplayer experiences and community building. The future of AR gaming is bright, with continued advancements in technology and increasing industry investment. Companies are exploring new revenue streams through in-app purchases, subscriptions, and advertising, making AR gaming a lucrative business opportunity. Gamers seek immersive experiences, and AR technology delivers, offering endless possibilities for creativity and engagement.

    What are the key market drivers leading to the rise in the adoption of Augmented Reality (AR) Gaming Industry?

    • As a professional virtual assistant, I'm here to help you with accurate and formal responses. Regarding your query, the market's growth is primarily attributed to the significant increase in investments dedicated to Augmented Reality (AR) technology. 

    • Augmented Reality (AR) gaming is an emerging technology gaining significant traction in various industries, including social media, retail, healthcare, and automotive. The integration of AR in gaming is expected to offer immersive experiences with social features, avatar customization, and 3D modeling. AR gaming platforms are also exploring gaming console integration, depth sensing, and gesture recognition for enhanced user experience. The market dynamics of AR gaming are driven by the increasing demand for cloud computing and performance optimization. With millions of users engaging in AR gaming daily, there is a need for robust security protocols to ensure user data privacy and churn rate reduction.
    • Game developers are investing heavily in AR technology, leveraging the power of 3D modeling, depth sensing, and gesture recognition for creating innovative games. Investors recognize AR gaming as a high-potential frontier within the broader immersive tech ecosystem. The transfer of large amounts of data and massive processing power required for AR gaming necessitates significant investment. Companies are entering partnerships and acquisitions to expand their AR gaming offerings and stay competitive. In conclusion, the AR gaming market is poised for growth, with several market players and startups investing in innovation and collaboration to deliver immersive gaming experiences.
    • The technology's potential applications extend beyond gaming, making it an exciting area for investment and innovation.

    What are the market trends shaping the Augmented Reality (AR) Gaming Industry?

    • The rising adoption of augmented reality (AR) games signifies a significant market trend. This emerging technology is poised to revolutionize the gaming industry, offering immersive experiences that blur the lines between the physical and digital worlds.

    • Augmented Reality (AR) gaming represents an immersive and harmonious fusion of digital content and the physical world. The global market for AR gaming is experiencing significant growth, driven by the widespread adoption of smartphones and tablets, increasing network infrastructure, and the integration of AR technology into these devices. Moreover, the integration of AR gaming into Personal Computers (PC) is also propelling the market forward. Sensor fusion and Spatial Computing technologies are essential components of AR gaming, enabling real-time interaction between the virtual and real worlds. Computer vision and data analytics play a crucial role in enhancing the user experience, while haptic feedback provides a more immersive and engaging gaming experience.
    • SLAM (Simultaneous Localization and Mapping) technology is another key enabler, allowing for accurate tracking of the user's position and environment. The AR gaming market is also witnessing the development and adoption of advanced technologies such as head-mounted displays (HMDs) and Augmented Reality Software Development Kits (SDKs). These technologies enable more immersive and interactive gaming experiences, increasing retention rates and user engagement. However, concerns around privacy, safety, and data usage remain, as AR games often require access to cameras, location data, and real-world mapping. It is essential for companies to address these concerns through robust data security measures and user-friendly privacy policies.
    • In conclusion, the AR gaming market is experiencing significant growth, driven by the increasing adoption of AR technology and the integration of AR games into mobile devices and PCs. The use of advanced technologies such as sensor fusion, SLAM, and haptic feedback is enhancing the user experience, while the development of AR SDKs and HMDs is enabling more immersive and interactive gaming experiences. However, privacy and data security concerns remain a significant challenge, requiring robust solutions from companies to address these concerns and build user trust.

    What challenges does the Augmented Reality (AR) Gaming Industry face during its growth?

    • The high cost of developing and implementing augmented reality (AR) gaming applications poses a significant challenge to the industry's growth. This financial barrier can hinder the expansion and mainstream adoption of AR technology in the gaming sector. 

    • The market offers immersive experiences by integrating digital graphics with real-world environments. AR headsets and mobile devices are the primary platforms for AR gaming. The market's growth is driven by advanced graphics rendering, image processing, and voice recognition technologies. Advertising revenue, multiplayer gaming, and in-app purchases are significant revenue streams. Level design and object recognition are essential components of AR gaming, ensuring a harmonious blend of virtual and real elements.
    • The development process for AR gaming solutions varies in complexity and cost. Simple product visualizations have lower production costs than intricate, interactive standalone games. Realistic animations and intuitive user interfaces increase development time and expenses. AR gaming's potential is vast, offering limitless opportunities for innovation and growth.

    Exclusive Customer Landscape

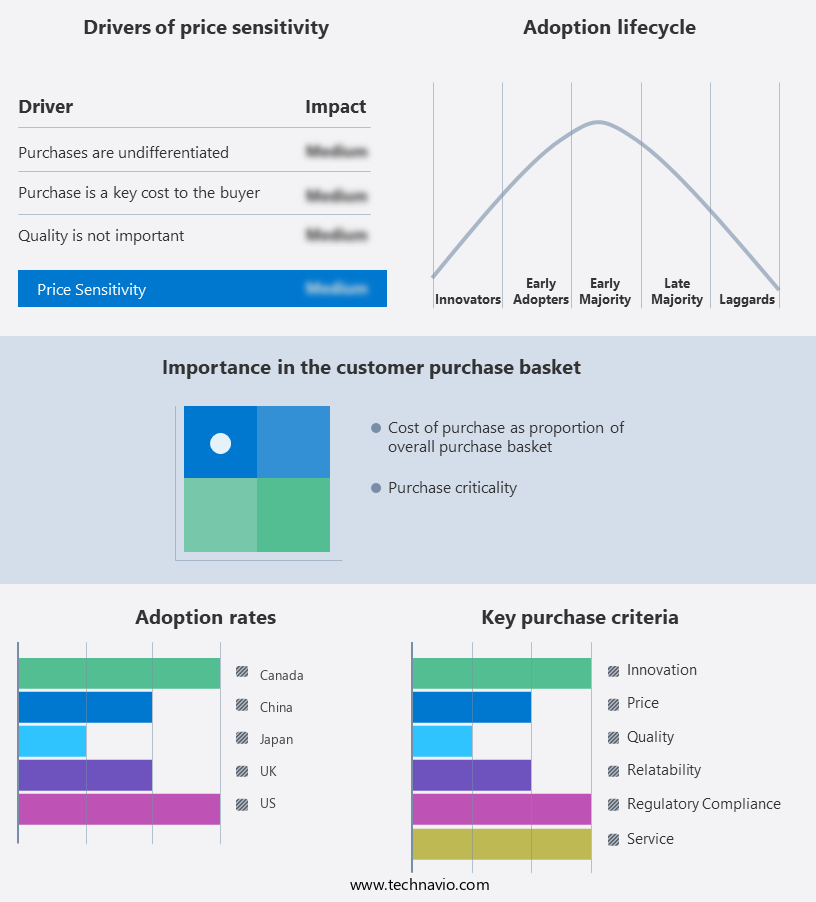
    The augmented reality (ar) gaming market forecasting report includes the adoption lifecycle of the market, covering from the innovator’s stage to the laggard’s stage. It focuses on adoption rates in different regions based on penetration. Furthermore, the augmented reality (ar) gaming market report also includes key purchase criteria and drivers of price sensitivity to help companies evaluate and develop their market growth analysis strategies.

    Augmented Reality (AR) Gaming Market Share by Geography

     Customer Landscape

    Key Companies & Market Insights

    Companies are implementing various strategies, such as strategic alliances, augmented reality (ar) gaming market forecast, partnerships, mergers and acquisitions, geographical expansion, and product/service launches, to enhance their presence in the industry.

    Apple Inc. - The company showcases an innovative approach to augmented reality (AR) technology, integrating Apple's Vision Pro, ARKit, and RealityKit for immersive gaming experiences on iPhone and iPad. By leveraging these advanced tools, users can engage in interactive, 3D environments, blurring the lines between the physical and digital worlds. This cutting-edge technology offers limitless possibilities for entertainment, education, and productivity applications. By harnessing the power of AR, the company is at the forefront of transforming the way we interact with technology.

    The industry research and growth report includes detailed analyses of the competitive landscape of the market and information about key companies, including:

    • Apple Inc.
    • Blippar Ltd.
    • Hofli Ltd.
    • Meta Platforms Inc.
    • Milkroom Studios GmbH
    • Netmarble Corp.
    • Niantic Inc.
    • OliveX Holdings Ltd.
    • Qualcomm Inc.
    • Resolution Games
    • Rovio Entertainment Corp.
    • Snap Inc.
    • Unity Technologies Inc.
    • Zappar Ltd.

    Qualitative and quantitative analysis of companies has been conducted to help clients understand the wider business environment as well as the strengths and weaknesses of key industry players. Data is qualitatively analyzed to categorize companies as pure play, category-focused, industry-focused, and diversified; it is quantitatively analyzed to categorize companies as dominant, leading, strong, tentative, and weak.

    Recent Development and News in Augmented Reality (AR) Gaming Market

    • In January 2024, Niantic, a leading AR gaming company, launched its much-anticipated title, "Pokémon GO 2," which introduced new features like multiplayer mode and AR-enhanced location-based challenges (Niantic Press Release). In March 2024, Apple and Google strengthened their commitment to the AR gaming industry by announcing ARKit 4 and ARCore 1.11 updates, respectively, enhancing developer tools for creating immersive AR experiences (Apple Developer, Google Developers).
    • In April 2024, Magic Leap, the AR headset manufacturer, secured a strategic partnership with Electronic Arts (EA) to develop exclusive AR games for their Magic Leap One headset, marking a significant step towards mainstream adoption of AR gaming (Magic Leap Press Release). In May 2025, Microsoft's Mojang Studios unveiled "Minecraft Earth," an AR version of their iconic game, at the Minecon Live event, attracting a massive fanbase and further expanding the reach of AR gaming (Mojang Studios Press Release).

    Research Analyst Overview

    • The market is experiencing significant growth, with innovative technologies such as 3D scanning, AR cloud, and location-based services driving engagement. Brands are leveraging marketing campaigns to promote immersive experiences, integrating AR markers and image targets for interactive gameplay. Game developers are utilizing advanced game mechanics, character design, and narrative design to create captivating content. AR glasses and depth cameras enable competitive gaming, while IMU sensors and game controllers offer enhanced user experiences. Fitness games and educational applications cater to diverse audiences, with beta testing and user feedback essential for game balancing and content creation.
    • Game development frameworks facilitate the creation of location-based games, providing an analytics dashboard for tracking player behavior and optimizing game balancing. AR technology continues to revolutionize casual gaming, offering a new dimension to interactive storytelling and world building.

    Dive into Technavio’s robust research methodology, blending expert interviews, extensive data synthesis, and validated models for unparalleled Augmented Reality (AR) Gaming Market insights. See full methodology.

    Market Scope

    Report Coverage

    Details

    Page number

    217

    Base year

    2024

    Historic period

    2019-2023

    Forecast period

    2025-2029

    Growth momentum & CAGR

    Accelerate at a CAGR of 54.2%

    Market growth 2025-2029

    USD 118320.3 million

    Market structure

    Concentrated

    YoY growth 2024-2025(%)

    38.2

    Key countries

    US, China, Canada, Germany, UK, France, Japan, South Korea, Italy, and India

    Competitive landscape

    Leading Companies, Market Positioning of Companies, Competitive Strategies, and Industry Risks

    Request Free Sample

    What are the Key Data Covered in this Augmented Reality (AR) Gaming Market Research and Growth Report?

    • CAGR of the Augmented Reality (AR) Gaming industry during the forecast period
    • Detailed information on factors that will drive the growth and forecasting between 2025 and 2029
    • Precise estimation of the size of the market and its contribution of the industry in focus to the parent market
    • Accurate predictions about upcoming growth and trends and changes in consumer behaviour
    • Growth of the market across North America, Europe, APAC, Middle East and Africa, and South America
    • Thorough analysis of the market’s competitive landscape and detailed information about companies
    • Comprehensive analysis of factors that will challenge the augmented reality (ar) gaming market growth of industry companies

    We can help! Our analysts can customize this augmented reality (ar) gaming market research report to meet your requirements.

    Get in touch


    1 Executive Summary

    • 1.1 Market overview
      • Executive Summary - Chart on Market Overview
      • Executive Summary - Data Table on Market Overview
      • Executive Summary - Chart on Global Market Characteristics
      • Executive Summary - Chart on Market by Geography
      • Executive Summary - Chart on Market Segmentation by Type
      • Executive Summary - Chart on Market Segmentation by Component
      • Executive Summary - Chart on Market Segmentation by Genre
      • Executive Summary - Chart on Market Segmentation by Business Segment
      • Executive Summary - Chart on Incremental Growth
      • Executive Summary - Data Table on Incremental Growth
      • Executive Summary - Chart on Company Market Positioning

    2 Technavio Analysis

    • 2.1 Analysis of price sensitivity, lifecycle, customer purchase basket, adoption rates, and purchase criteria
      • Analysis of price sensitivity, lifecycle, customer purchase basket, adoption rates, and purchase criteria
    • 2.2 Criticality of inputs and Factors of differentiation
      • Overview on criticality of inputs and factors of differentiation
    • 2.3 Factors of disruption
      • Overview on factors of disruption
    • 2.4 Impact of drivers and challenges
      • Impact of drivers and challenges in 2024 and 2029

    3 Market Landscape

    • 3.1 Market ecosystem
      • Parent Market
      • Data Table on - Parent Market
    • 3.2 Market characteristics
      • Market characteristics analysis
    • 3.3 Value chain analysis
      • Value chain analysis

    4 Market Sizing

    • 4.1 Market definition
      • Offerings of companies included in the market definition
    • 4.2 Market segment analysis
      • Market segments
    • 4.3 Market size 2024
      • 4.4 Market outlook: Forecast for 2024-2029
        • Chart on Global - Market size and forecast 2024-2029 ($ million)
        • Data Table on Global - Market size and forecast 2024-2029 ($ million)
        • Chart on Global Market: Year-over-year growth 2024-2029 (%)
        • Data Table on Global Market: Year-over-year growth 2024-2029 (%)

      5 Historic Market Size

      • 5.1 Global Augmented Reality (AR) Gaming Market 2019 - 2023
        • Historic Market Size - Data Table on Global Augmented Reality (AR) Gaming Market 2019 - 2023 ($ million)
      • 5.2 Type segment analysis 2019 - 2023
        • Historic Market Size - Type Segment 2019 - 2023 ($ million)
      • 5.3 Component segment analysis 2019 - 2023
        • Historic Market Size - Component Segment 2019 - 2023 ($ million)
      • 5.4 Genre segment analysis 2019 - 2023
        • Historic Market Size - Genre Segment 2019 - 2023 ($ million)
      • 5.5 Business segment analysis 2019 - 2023
        • Historic Market Size - Business Segment 2019 - 2023 ($ million)
      • 5.6 Geography segment analysis 2019 - 2023
        • Historic Market Size - Geography Segment 2019 - 2023 ($ million)
      • 5.7 Country segment analysis 2019 - 2023
        • Historic Market Size - Country Segment 2019 - 2023 ($ million)

      6 Qualitative Analysis

      • 6.1 Impact of AI in the Global Augmented Reality (AR) Gaming Market

        7 Five Forces Analysis

        • 7.1 Five forces summary
          • Five forces analysis - Comparison between 2024 and 2029
        • 7.2 Bargaining power of buyers
          • Bargaining power of buyers - Impact of key factors 2024 and 2029
        • 7.3 Bargaining power of suppliers
          • Bargaining power of suppliers - Impact of key factors in 2024 and 2029
        • 7.4 Threat of new entrants
          • Threat of new entrants - Impact of key factors in 2024 and 2029
        • 7.5 Threat of substitutes
          • Threat of substitutes - Impact of key factors in 2024 and 2029
        • 7.6 Threat of rivalry
          • Threat of rivalry - Impact of key factors in 2024 and 2029
        • 7.7 Market condition
          • Chart on Market condition - Five forces 2024 and 2029

        8 Market Segmentation by Type

        • 8.1 Market segments
          • Chart on Type - Market share 2024-2029 (%)
          • Data Table on Type - Market share 2024-2029 (%)
        • 8.2 Comparison by Type
          • Chart on Comparison by Type
          • Data Table on Comparison by Type
        • 8.3 Mobile devices - Market size and forecast 2024-2029
          • Chart on Mobile devices - Market size and forecast 2024-2029 ($ million)
          • Data Table on Mobile devices - Market size and forecast 2024-2029 ($ million)
          • Chart on Mobile devices - Year-over-year growth 2024-2029 (%)
          • Data Table on Mobile devices - Year-over-year growth 2024-2029 (%)
        • 8.4 HMDs - Market size and forecast 2024-2029
          • Chart on HMDs - Market size and forecast 2024-2029 ($ million)
          • Data Table on HMDs - Market size and forecast 2024-2029 ($ million)
          • Chart on HMDs - Year-over-year growth 2024-2029 (%)
          • Data Table on HMDs - Year-over-year growth 2024-2029 (%)
        • 8.5 Smart glasses - Market size and forecast 2024-2029
          • Chart on Smart glasses - Market size and forecast 2024-2029 ($ million)
          • Data Table on Smart glasses - Market size and forecast 2024-2029 ($ million)
          • Chart on Smart glasses - Year-over-year growth 2024-2029 (%)
          • Data Table on Smart glasses - Year-over-year growth 2024-2029 (%)
        • 8.6 Market opportunity by Type
          • Market opportunity by Type ($ million)
          • Data Table on Market opportunity by Type ($ million)

        9 Market Segmentation by Component

        • 9.1 Market segments
          • Chart on Component - Market share 2024-2029 (%)
          • Data Table on Component - Market share 2024-2029 (%)
        • 9.2 Comparison by Component
          • Chart on Comparison by Component
          • Data Table on Comparison by Component
        • 9.3 Hardware - Market size and forecast 2024-2029
          • Chart on Hardware - Market size and forecast 2024-2029 ($ million)
          • Data Table on Hardware - Market size and forecast 2024-2029 ($ million)
          • Chart on Hardware - Year-over-year growth 2024-2029 (%)
          • Data Table on Hardware - Year-over-year growth 2024-2029 (%)
        • 9.4 Software - Market size and forecast 2024-2029
          • Chart on Software - Market size and forecast 2024-2029 ($ million)
          • Data Table on Software - Market size and forecast 2024-2029 ($ million)
          • Chart on Software - Year-over-year growth 2024-2029 (%)
          • Data Table on Software - Year-over-year growth 2024-2029 (%)
        • 9.5 Market opportunity by Component
          • Market opportunity by Component ($ million)
          • Data Table on Market opportunity by Component ($ million)

        10 Market Segmentation by Genre

        • 10.1 Market segments
          • Chart on Genre - Market share 2024-2029 (%)
          • Data Table on Genre - Market share 2024-2029 (%)
        • 10.2 Comparison by Genre
          • Chart on Comparison by Genre
          • Data Table on Comparison by Genre
        • 10.3 Adventure - Market size and forecast 2024-2029
          • Chart on Adventure - Market size and forecast 2024-2029 ($ million)
          • Data Table on Adventure - Market size and forecast 2024-2029 ($ million)
          • Chart on Adventure - Year-over-year growth 2024-2029 (%)
          • Data Table on Adventure - Year-over-year growth 2024-2029 (%)
        • 10.4 Shooter - Market size and forecast 2024-2029
          • Chart on Shooter - Market size and forecast 2024-2029 ($ million)
          • Data Table on Shooter - Market size and forecast 2024-2029 ($ million)
          • Chart on Shooter - Year-over-year growth 2024-2029 (%)
          • Data Table on Shooter - Year-over-year growth 2024-2029 (%)
        • 10.5 Puzzle - Market size and forecast 2024-2029
          • Chart on Puzzle - Market size and forecast 2024-2029 ($ million)
          • Data Table on Puzzle - Market size and forecast 2024-2029 ($ million)
          • Chart on Puzzle - Year-over-year growth 2024-2029 (%)
          • Data Table on Puzzle - Year-over-year growth 2024-2029 (%)
        • 10.6 Sports and fitness - Market size and forecast 2024-2029
          • Chart on Sports and fitness - Market size and forecast 2024-2029 ($ million)
          • Data Table on Sports and fitness - Market size and forecast 2024-2029 ($ million)
          • Chart on Sports and fitness - Year-over-year growth 2024-2029 (%)
          • Data Table on Sports and fitness - Year-over-year growth 2024-2029 (%)
        • 10.7 Market opportunity by Genre
          • Market opportunity by Genre ($ million)
          • Data Table on Market opportunity by Genre ($ million)

        11 Market Segmentation by Business Segment

        • 11.1 Market segments
          • Chart on Market Segmentation by Business Segment - Market share 2024-2029 (%)
          • Data Table on Market Segmentation by Business Segment - Market share 2024-2029 (%)
        • 11.2 Comparison by Market Segmentation by Business Segment
          • Chart on Comparison by Market Segmentation by Business Segment
          • Data Table on Comparison by Market Segmentation by Business Segment
        • 11.3 Free-to-play - Market size and forecast 2024-2029
          • Chart on Free-to-play - Market size and forecast 2024-2029 ($ million)
          • Data Table on Free-to-play - Market size and forecast 2024-2029 ($ million)
          • Chart on Free-to-play - Year-over-year growth 2024-2029 (%)
          • Data Table on Free-to-play - Year-over-year growth 2024-2029 (%)
        • 11.4 Premium - Market size and forecast 2024-2029
          • Chart on Premium - Market size and forecast 2024-2029 ($ million)
          • Data Table on Premium - Market size and forecast 2024-2029 ($ million)
          • Chart on Premium - Year-over-year growth 2024-2029 (%)
          • Data Table on Premium - Year-over-year growth 2024-2029 (%)
        • 11.5 Subscription - Market size and forecast 2024-2029
          • Chart on Subscription - Market size and forecast 2024-2029 ($ million)
          • Data Table on Subscription - Market size and forecast 2024-2029 ($ million)
          • Chart on Subscription - Year-over-year growth 2024-2029 (%)
          • Data Table on Subscription - Year-over-year growth 2024-2029 (%)
        • 11.6 Market opportunity by Market Segmentation by Business Segment
          • Market opportunity by Market Segmentation by Business Segment ($ million)
          • Data Table on Market opportunity by Market Segmentation by Business Segment ($ million)

        12 Customer Landscape

        • 12.1 Customer landscape overview
          • Analysis of price sensitivity, lifecycle, customer purchase basket, adoption rates, and purchase criteria

        13 Geographic Landscape

        • 13.1 Geographic segmentation
          • Chart on Market share by geography 2024-2029 (%)
          • Data Table on Market share by geography 2024-2029 (%)
        • 13.2 Geographic comparison
          • Chart on Geographic comparison
          • Data Table on Geographic comparison
        • 13.3 North America - Market size and forecast 2024-2029
          • Chart on North America - Market size and forecast 2024-2029 ($ million)
          • Data Table on North America - Market size and forecast 2024-2029 ($ million)
          • Chart on North America - Year-over-year growth 2024-2029 (%)
          • Data Table on North America - Year-over-year growth 2024-2029 (%)
        • 13.4 Europe - Market size and forecast 2024-2029
          • Chart on Europe - Market size and forecast 2024-2029 ($ million)
          • Data Table on Europe - Market size and forecast 2024-2029 ($ million)
          • Chart on Europe - Year-over-year growth 2024-2029 (%)
          • Data Table on Europe - Year-over-year growth 2024-2029 (%)
        • 13.5 APAC - Market size and forecast 2024-2029
          • Chart on APAC - Market size and forecast 2024-2029 ($ million)
          • Data Table on APAC - Market size and forecast 2024-2029 ($ million)
          • Chart on APAC - Year-over-year growth 2024-2029 (%)
          • Data Table on APAC - Year-over-year growth 2024-2029 (%)
        • 13.6 Middle East and Africa - Market size and forecast 2024-2029
          • Chart on Middle East and Africa - Market size and forecast 2024-2029 ($ million)
          • Data Table on Middle East and Africa - Market size and forecast 2024-2029 ($ million)
          • Chart on Middle East and Africa - Year-over-year growth 2024-2029 (%)
          • Data Table on Middle East and Africa - Year-over-year growth 2024-2029 (%)
        • 13.7 South America - Market size and forecast 2024-2029
          • Chart on South America - Market size and forecast 2024-2029 ($ million)
          • Data Table on South America - Market size and forecast 2024-2029 ($ million)
          • Chart on South America - Year-over-year growth 2024-2029 (%)
          • Data Table on South America - Year-over-year growth 2024-2029 (%)
        • 13.8 US - Market size and forecast 2024-2029
          • Chart on US - Market size and forecast 2024-2029 ($ million)
          • Data Table on US - Market size and forecast 2024-2029 ($ million)
          • Chart on US - Year-over-year growth 2024-2029 (%)
          • Data Table on US - Year-over-year growth 2024-2029 (%)
        • 13.9 China - Market size and forecast 2024-2029
          • Chart on China - Market size and forecast 2024-2029 ($ million)
          • Data Table on China - Market size and forecast 2024-2029 ($ million)
          • Chart on China - Year-over-year growth 2024-2029 (%)
          • Data Table on China - Year-over-year growth 2024-2029 (%)
        • 13.10 Canada - Market size and forecast 2024-2029
          • Chart on Canada - Market size and forecast 2024-2029 ($ million)
          • Data Table on Canada - Market size and forecast 2024-2029 ($ million)
          • Chart on Canada - Year-over-year growth 2024-2029 (%)
          • Data Table on Canada - Year-over-year growth 2024-2029 (%)
        • 13.11 Germany - Market size and forecast 2024-2029
          • Chart on Germany - Market size and forecast 2024-2029 ($ million)
          • Data Table on Germany - Market size and forecast 2024-2029 ($ million)
          • Chart on Germany - Year-over-year growth 2024-2029 (%)
          • Data Table on Germany - Year-over-year growth 2024-2029 (%)
        • 13.12 UK - Market size and forecast 2024-2029
          • Chart on UK - Market size and forecast 2024-2029 ($ million)
          • Data Table on UK - Market size and forecast 2024-2029 ($ million)
          • Chart on UK - Year-over-year growth 2024-2029 (%)
          • Data Table on UK - Year-over-year growth 2024-2029 (%)
        • 13.13 Japan - Market size and forecast 2024-2029
          • Chart on Japan - Market size and forecast 2024-2029 ($ million)
          • Data Table on Japan - Market size and forecast 2024-2029 ($ million)
          • Chart on Japan - Year-over-year growth 2024-2029 (%)
          • Data Table on Japan - Year-over-year growth 2024-2029 (%)
        • 13.14 France - Market size and forecast 2024-2029
          • Chart on France - Market size and forecast 2024-2029 ($ million)
          • Data Table on France - Market size and forecast 2024-2029 ($ million)
          • Chart on France - Year-over-year growth 2024-2029 (%)
          • Data Table on France - Year-over-year growth 2024-2029 (%)
        • 13.15 South Korea - Market size and forecast 2024-2029
          • Chart on South Korea - Market size and forecast 2024-2029 ($ million)
          • Data Table on South Korea - Market size and forecast 2024-2029 ($ million)
          • Chart on South Korea - Year-over-year growth 2024-2029 (%)
          • Data Table on South Korea - Year-over-year growth 2024-2029 (%)
        • 13.16 Italy - Market size and forecast 2024-2029
          • Chart on Italy - Market size and forecast 2024-2029 ($ million)
          • Data Table on Italy - Market size and forecast 2024-2029 ($ million)
          • Chart on Italy - Year-over-year growth 2024-2029 (%)
          • Data Table on Italy - Year-over-year growth 2024-2029 (%)
        • 13.17 India - Market size and forecast 2024-2029
          • Chart on India - Market size and forecast 2024-2029 ($ million)
          • Data Table on India - Market size and forecast 2024-2029 ($ million)
          • Chart on India - Year-over-year growth 2024-2029 (%)
          • Data Table on India - Year-over-year growth 2024-2029 (%)
        • 13.18 Market opportunity by geography
          • Market opportunity by geography ($ million)
          • Data Tables on Market opportunity by geography ($ million)

        14 Drivers, Challenges, and Opportunity/Restraints

        • 14.1 Market drivers
          • 14.2 Market challenges
            • 14.3 Impact of drivers and challenges
              • Impact of drivers and challenges in 2024 and 2029
            • 14.4 Market opportunities/restraints

              15 Competitive Landscape

              • 15.1 Overview
                • 15.2 Competitive Landscape
                  • Overview on criticality of inputs and factors of differentiation
                • 15.3 Landscape disruption
                  • Overview on factors of disruption
                • 15.4 Industry risks
                  • Impact of key risks on business

                16 Competitive Analysis

                • 16.1 Companies profiled
                  • Companies covered
                • 16.2 Company ranking index
                  • Company ranking index
                • 16.3 Market positioning of companies
                  • Matrix on companies position and classification
                • 16.4 Apple Inc.
                  • Apple Inc. - Overview
                  • Apple Inc. - Business segments
                  • Apple Inc. - Key news
                  • Apple Inc. - Key offerings
                  • Apple Inc. - Segment focus
                  • SWOT
                • 16.5 Blippar Ltd.
                  • Blippar Ltd. - Overview
                  • Blippar Ltd. - Product / Service
                  • Blippar Ltd. - Key offerings
                  • SWOT
                • 16.6 Hofli Ltd.
                  • Hofli Ltd. - Overview
                  • Hofli Ltd. - Product / Service
                  • Hofli Ltd. - Key offerings
                  • SWOT
                • 16.7 Meta Platforms Inc.
                  • Meta Platforms Inc. - Overview
                  • Meta Platforms Inc. - Business segments
                  • Meta Platforms Inc. - Key offerings
                  • Meta Platforms Inc. - Segment focus
                  • SWOT
                • 16.8 Milkroom Studios GmbH
                  • Milkroom Studios GmbH - Overview
                  • Milkroom Studios GmbH - Product / Service
                  • Milkroom Studios GmbH - Key offerings
                  • SWOT
                • 16.9 Netmarble Corp.
                  • Netmarble Corp. - Overview
                  • Netmarble Corp. - Product / Service
                  • Netmarble Corp. - Key offerings
                  • SWOT
                • 16.10 Niantic Inc.
                  • Niantic Inc. - Overview
                  • Niantic Inc. - Product / Service
                  • Niantic Inc. - Key offerings
                  • SWOT
                • 16.11 OliveX Holdings Ltd.
                  • OliveX Holdings Ltd. - Overview
                  • OliveX Holdings Ltd. - Product / Service
                  • OliveX Holdings Ltd. - Key offerings
                  • SWOT
                • 16.12 Qualcomm Inc.
                  • Qualcomm Inc. - Overview
                  • Qualcomm Inc. - Business segments
                  • Qualcomm Inc. - Key news
                  • Qualcomm Inc. - Key offerings
                  • Qualcomm Inc. - Segment focus
                  • SWOT
                • 16.13 Resolution Games
                  • Resolution Games - Overview
                  • Resolution Games - Product / Service
                  • Resolution Games - Key offerings
                  • SWOT
                • 16.14 Rovio Entertainment Corp.
                  • Rovio Entertainment Corp. - Overview
                  • Rovio Entertainment Corp. - Business segments
                  • Rovio Entertainment Corp. - Key news
                  • Rovio Entertainment Corp. - Key offerings
                  • Rovio Entertainment Corp. - Segment focus
                  • SWOT
                • 16.15 Snap Inc.
                  • Snap Inc. - Overview
                  • Snap Inc. - Product / Service
                  • Snap Inc. - Key offerings
                  • SWOT
                • 16.16 Unity Technologies Inc.
                  • Unity Technologies Inc. - Overview
                  • Unity Technologies Inc. - Product / Service
                  • Unity Technologies Inc. - Key news
                  • Unity Technologies Inc. - Key offerings
                  • SWOT
                • 16.17 Zappar Ltd.
                  • Zappar Ltd. - Overview
                  • Zappar Ltd. - Product / Service
                  • Zappar Ltd. - Key offerings
                  • SWOT

                17 Appendix

                • 17.1 Scope of the report
                  • 17.2 Inclusions and exclusions checklist
                    • Inclusions checklist
                    • Exclusions checklist
                  • 17.3 Currency conversion rates for US$
                    • Currency conversion rates for US$
                  • 17.4 Research methodology
                    • Research methodology
                  • 17.5 Data procurement
                    • Information sources
                  • 17.6 Data validation
                    • Data validation
                  • 17.7 Validation techniques employed for market sizing
                    • Validation techniques employed for market sizing
                  • 17.8 Data synthesis
                    • Data synthesis
                  • 17.9 360 degree market analysis
                    • 360 degree market analysis
                  • 17.10 List of abbreviations
                    • List of abbreviations

                  Research Methodology

                  Technavio presents a detailed picture of the market by way of study, synthesis, and summation of data from multiple sources. The analysts have presented the various facets of the market with a particular focus on identifying the key industry influencers. The data thus presented is comprehensive, reliable, and the result of extensive research, both primary and secondary.

                  INFORMATION SOURCES

                  Primary sources

                  • Manufacturers and suppliers
                  • Channel partners
                  • Industry experts
                  • Strategic decision makers

                  Secondary sources

                  • Industry journals and periodicals
                  • Government data
                  • Financial reports of key industry players
                  • Historical data
                  • Press releases

                  DATA ANALYSIS

                  Data Synthesis

                  • Collation of data
                  • Estimation of key figures
                  • Analysis of derived insights

                  Data Validation

                  • Triangulation with data models
                  • Reference against proprietary databases
                  • Corroboration with industry experts

                  REPORT WRITING

                  Qualitative

                  • Market drivers
                  • Market challenges
                  • Market trends
                  • Five forces analysis

                  Quantitative

                  • Market size and forecast
                  • Market segmentation
                  • Geographical insights
                  • Competitive landscape

                  Interested in this report?

                  Get your sample now to see our research methodology and insights!

                  Download Now

                  Frequently Asked Questions

                  Augmented Reality (Ar) Gaming market growth will increase by $ 118320.3 mn during 2025-2029 .

                  The Augmented Reality (Ar) Gaming market is expected to grow at a CAGR of 54.2% during 2025-2029 .

                  Augmented Reality (Ar) Gaming market is segmented by Type( Mobile devices, HMDs, Smart glasses) Component( Hardware, Software) Genre( Adventure, Shooter, Puzzle, Sports and fitness, South America)

                  Apple Inc., Blippar Ltd., Hofli Ltd., Meta Platforms Inc., Milkroom Studios GmbH, Netmarble Corp., Niantic Inc., OliveX Holdings Ltd., Qualcomm Inc., Resolution Games, Rovio Entertainment Corp., Snap Inc., Unity Technologies Inc., Zappar Ltd. are a few of the key vendors in the Augmented Reality (Ar) Gaming market.

                  North America will register the highest growth rate of 40% among the other regions. Therefore, the Augmented Reality (Ar) Gaming market in North America is expected to garner significant business opportunities for the vendors during the forecast period.

                  US, China, Canada, Germany, UK, France, Japan, South Korea, Italy, India

                  • Increasing investments in AR technologyAR is an emerging technology is the driving factor this market.
                  • and several big players and startups are investing heavily in innovations related to technology. The technology is expected to be used in social media platforms is the driving factor this market.
                  • mobile devices (for virtual conferencing) is the driving factor this market.
                  • and car devices is the driving factor this market.
                  • as well as in retail and healthcare. With millions of people using AR every day is the driving factor this market.
                  • the technology requires the transfer of large amounts of data and massive processing power to deliver information in real time. Capturing large amounts of data and achieving meaningful results requires significant investment is the driving factor this market.
                  • with several companies investing in AR technology and entering partnerships and acquisitions.Investors are increasingly recognizing AR gaming as a high-potential frontier within the broader immersive tech ecosystem. These investments are not limited to game development alone; they also extend to AR hardware is the driving factor this market.
                  • spatial computing platforms is the driving factor this market.
                  • and enabling technologies like AI is the driving factor this market.
                  • 5G is the driving factor this market.
                  • and cloud rendering. This holistic funding approach is creating a more robust and scalable infrastructure for AR gaming experiences.For instance is the driving factor this market.
                  • in recent years is the driving factor this market.
                  • companies like Meta is the driving factor this market.
                  • Apple is the driving factor this market.
                  • and Google have significantly ramped up their AR-related research and development spending. This has led to the development of more powerful AR development kits (like ARKit and ARCore) is the driving factor this market.
                  • as well as new hardware platforms that support richer is the driving factor this market.
                  • more interactive gameplay. These tools empower developers to create games that are not only visually compelling but also contextually aware and socially engaging.Moreover is the driving factor this market.
                  • the investment landscape is also seeing increased activity from entertainment and media conglomerates looking to diversify into interactive content. Strategic partnerships and acquisitions are becoming more common is the driving factor this market.
                  • with gaming studios being acquired for their AR capabilities or IP portfolios. Therefore is the driving factor this market.
                  • investments in AR technology by IT companies and AR gaming companies are expected to fuel the growth of the global Augmented reality (AR) gaming market during the forecast period. is the driving factor this market.

                  The Augmented Reality (Ar) Gaming market vendors should focus on grabbing business opportunities from the Mobile devices segment as it accounted for the largest market share in the base year.