
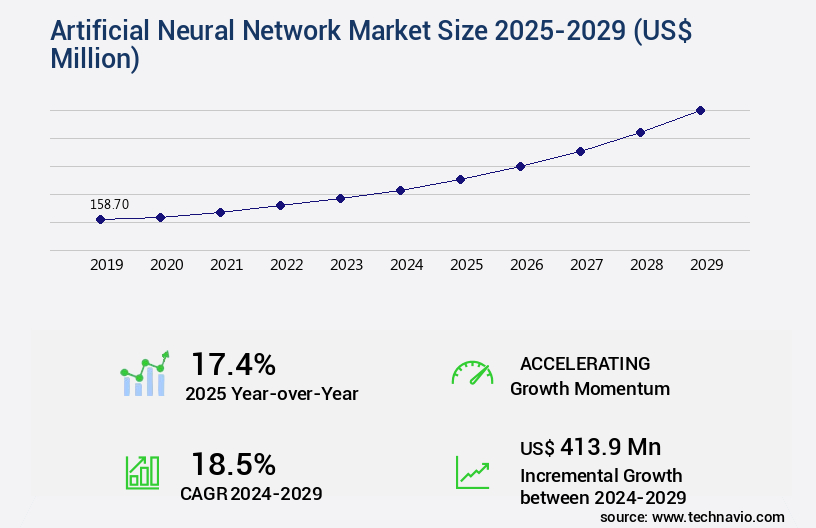
Artificial Neural Network Market Size 2025-2029
The artificial neural network market size is valued to increase by USD 413.9 million, at a CAGR of 18.5% from 2024 to 2029. Explosion in data volume and sophistication of data infrastructure will drive the artificial neural network market.
Major Market Trends & Insights
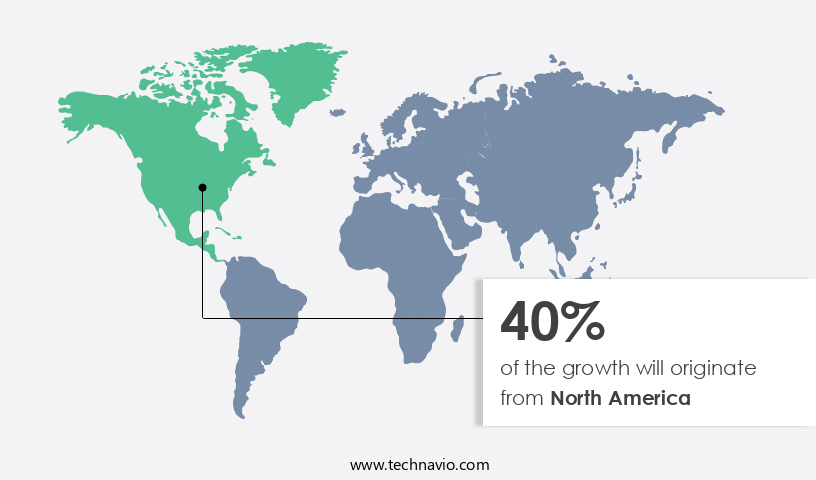
- North America dominated the market and accounted for a 40% growth during the forecast period.
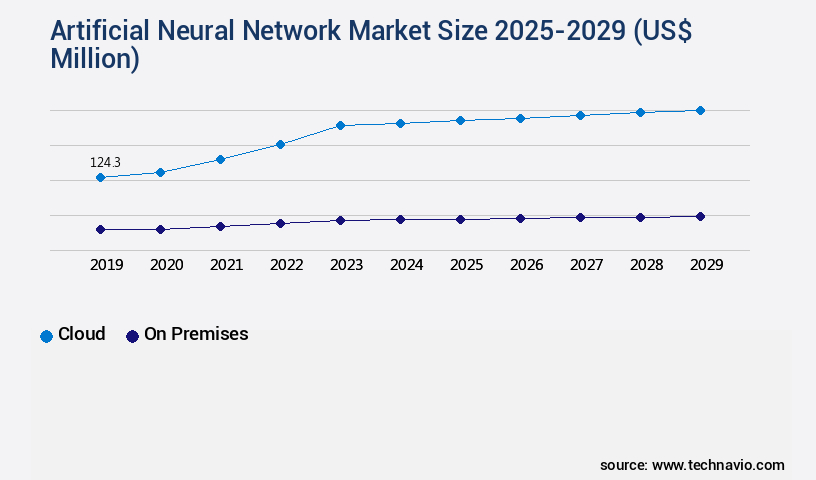
- By Deployment - Cloud segment was valued at USD 124.30 million in 2023
- By Component - Solutions segment accounted for the largest market revenue share in 2023
Market Size & Forecast
- Market Opportunities: USD 355.95 million
- Market Future Opportunities: USD 413.90 million
- CAGR from 2024 to 2029 : 18.5%
Market Summary
- Artificial Neural Networks (ANNs), a subset of artificial intelligence, have experienced remarkable growth in recent years due to the explosion in data volume and sophistication of data infrastructure. ANNs, modeled after the human brain's neural structure, enable machines to learn and improve from experience, making them an essential component of advanced machine learning applications. The rise of native multimodal AI, which can process various types of data, such as speech, text, and images, further fuels the demand for ANNs. However, this growth comes with challenges. Prohibitive computational costs and escalating energy consumption necessitate continuous advancements in hardware and software technologies to optimize ANN performance.
- Despite these hurdles, the ANN market continues to expand, with significant investments in research and development. According to a recent study, the global ANN market size was valued at over USD20 billion in 2020 and is projected to reach USD100 billion by 2027, growing at a compound annual growth rate (CAGR) of approximately 25%. This growth underscores the market's potential and the increasing importance of ANNs in various industries, from healthcare and finance to transportation and manufacturing. In conclusion, the ANN market's evolution is driven by the increasing availability and complexity of data, the emergence of multimodal AI, and the ongoing quest for improved performance and efficiency.
- Despite challenges related to computational costs and energy consumption, the market's growth trajectory remains strong, making ANNs a vital technology for businesses seeking to harness the power of AI.
What will be the Size of the Artificial Neural Network Market during the forecast period?
Get Key Insights on Market Forecast (PDF) Request Free Sample
How is the Artificial Neural Network Market Segmented ?
The artificial neural network industry research report provides comprehensive data (region-wise segment analysis), with forecasts and estimates in "USD million" for the period 2025-2029, as well as historical data from 2019-2023 for the following segments.
- Deployment
- Cloud
- On premises
- Component
- Solutions
- Services
- Application
- Image recognition
- Signal recognition
- Data mining
- Others
- Geography
- North America
- US
- Canada
- Europe
- France
- Germany
- UK
- APAC
- China
- India
- Japan
- South Korea
- South America
- Brazil
- Rest of World (ROW)
- North America
By Deployment Insights
The cloud segment is estimated to witness significant growth during the forecast period.
The Artificial Neural Network (ANN) market continues to evolve, with the cloud segment leading the charge. This sector's growth is driven by its unrivaled scalability, cost efficiency, and the democratization of advanced computational resources. Enterprises are progressively shifting their artificial intelligence workloads to the cloud, adopting the operational expenditure model, which eliminates the need for significant upfront investment in hardware and infrastructure. This model empowers organizations of all sizes to access cutting-edge processing power and intricate pre-trained neural network models on a pay-as-you-go basis. Key techniques, such as backpropagation algorithm, batch normalization, and layer normalization, contribute to the refinement of neural network architectures, including recurrent neural networks, convolutional neural networks, and deep learning models.
These models employ hidden layers, activation functions, and adaptive learning rates to optimize output predictions and minimize loss functions, such as mean squared error and cross-entropy loss. Regularization techniques, like dropout regularization and weight initialization, further enhance model performance. Moreover, advanced methods, such as policy gradient methods, long short-term memory, deep q-networks, and generative adversarial networks, are revolutionizing reinforcement learning applications. The ANN market's ongoing advancements underscore its transformative potential across various industries. For instance, a recent study revealed that the global deep learning market is projected to reach a value of USD126.35 billion by 2027, underscoring its immense potential for growth.
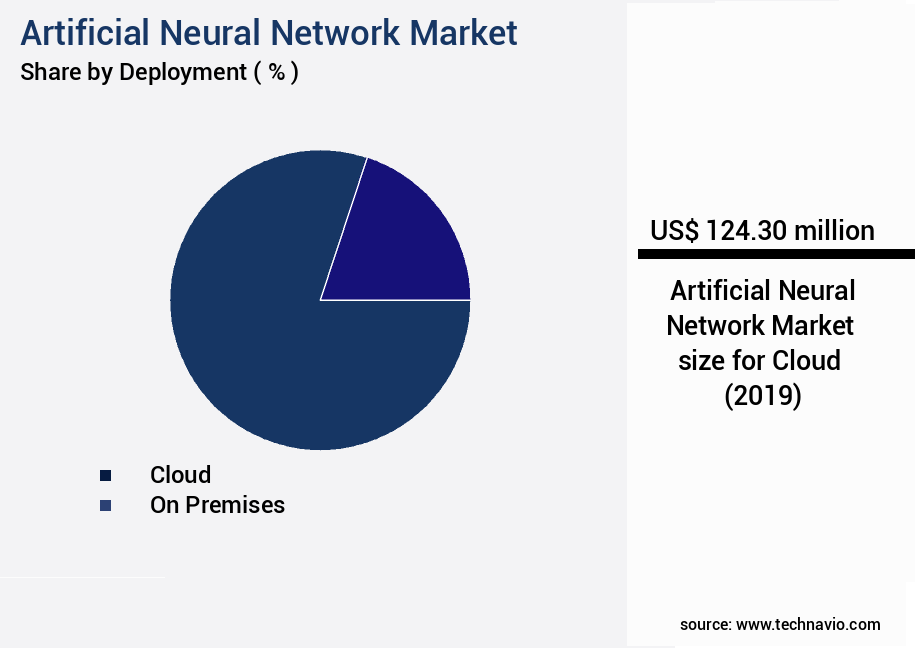
The Cloud segment was valued at USD 124.30 million in 2019 and showed a gradual increase during the forecast period.
Regional Analysis
North America is estimated to contribute 40% to the growth of the global market during the forecast period.Technavio's analysts have elaborately explained the regional trends and drivers that shape the market during the forecast period.
See How Artificial Neural Network Market Demand is Rising in North America Request Free Sample
The market is currently dominated by North America, with the United States leading the way. This regional supremacy is underpinned by a robust ecosystem that includes technology giants, a thriving venture capital scene, prestigious research institutions, and a strong enterprise adoption rate. The US is at the forefront of model development and hardware innovation, as evidenced by NVIDIA Corporation's unveiling of the next-generation Blackwell architecture at the GTC conference in March 2024. This platform is designed to support large-scale artificial neural networks and significantly reduce the cost and energy consumption of generative AI operations. Europe and Asia Pacific are also experiencing significant growth in the market, driven by increasing investments in research and development and the growing adoption of AI technologies in various industries.
The market is expected to reach a value of over USD100 billion by 2027, growing at a steady pace due to the rising demand for advanced AI applications in sectors such as healthcare, finance, and manufacturing.
Market Dynamics
Our researchers analyzed the data with 2024 as the base year, along with the key drivers, trends, and challenges. A holistic analysis of drivers will help companies refine their marketing strategies to gain a competitive advantage.
The market is experiencing significant growth due to the increasing demand for advanced machine learning and deep learning solutions. Neural networks, composed of interconnected nodes inspired by the human brain, have revolutionized various industries with their ability to learn complex patterns from data. Two primary types of neural network architectures dominate the market: Convolutional Neural Networks (CNNs) for image processing and Recurrent Neural Networks (RNNs) for sequential data. CNNs utilize convolutional layers to extract features from images, while RNNs employ recurrent layers to process sequential data. To prevent overfitting and improve model performance, regularization techniques such as applying L1, L2 regularization and dropout are used. Hyperparameter optimization techniques like Grid Search, Random Search, and Bayesian Optimization are essential for finding the optimal combination of hyperparameters. The impact of hidden layers on model performance is substantial. Measuring model accuracy is crucial, and precision and recall are commonly used evaluation metrics.
Feature extraction is enhanced using autoencoders, and deep learning models are evaluated using various metrics like Mean Squared Error (MSE), Cross-Entropy, and F1-score. Optimizing learning rates for faster convergence and implementing dropout for regularization are crucial aspects of neural network training. Choosing appropriate activation functions like ReLU, Sigmoid, and Tanh, and understanding the effects of weight initialization strategies are also essential. Handling imbalanced datasets is a challenge, and techniques like oversampling, undersampling, and SMOTE are employed. Transfer learning is applied to new datasets to leverage pre-trained models, and deep learning models are used for time series forecasting. GANs (Generative Adversarial Networks) are used for data generation, and reinforcement learning algorithms like Q-learning and Deep Q-Networks are used for game playing. Building robust neural network architectures and interpreting model predictions are ongoing research areas. Neural networks have numerous applications in finance, including fraud detection, risk assessment, and stock price prediction. The future of the market looks promising, with continued advancements in technology and applications.
What are the key market drivers leading to the rise in the adoption of Artificial Neural Network Industry?
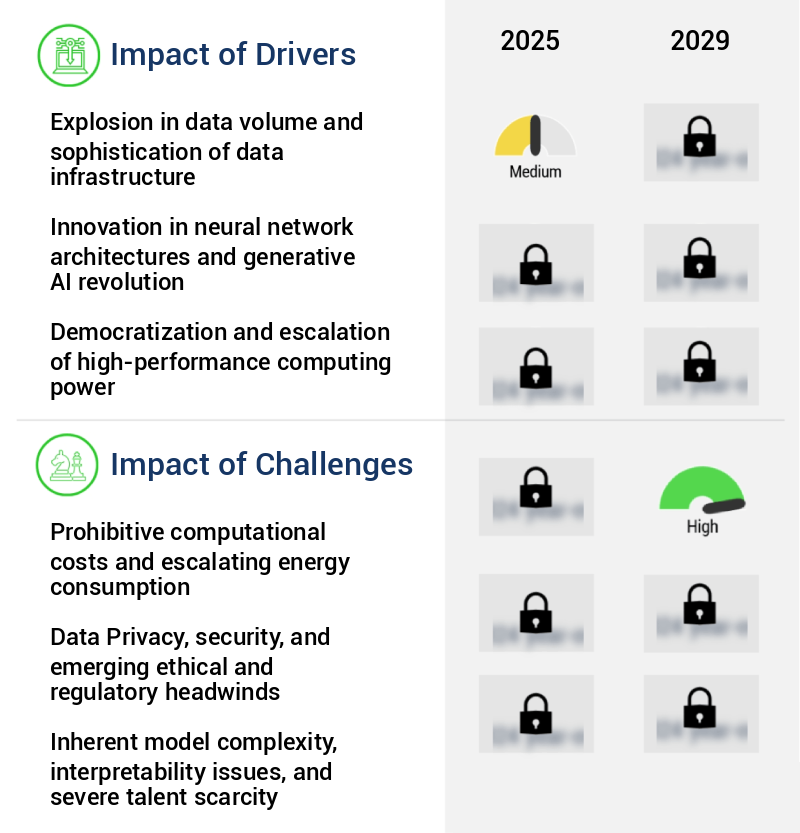
- The escalating volume and complexity of data, coupled with the advanced infrastructure required to manage it, serve as the primary catalyst for market growth.
- The market is experiencing significant growth due to the increasing generation and availability of big data. Modern enterprises and digital ecosystems produce vast amounts of structured and unstructured data from various sources, including IoT devices, social media platforms, e-commerce transactions, and internal operational systems. Artificial neural networks (ANNs) are data-driven, and their ability to learn, recognize patterns, and make accurate predictions is directly linked to the quality and quantity of the data they are trained on. The deployment of 5G networks, which gained momentum globally in 2023 and 2024, has led to a surge in real-time data flow from edge devices, opening up new opportunities for ANN applications in sectors like autonomous systems and smart city management.
- The potential applications of ANNs are vast, ranging from image and speech recognition to natural language processing and predictive analytics. With the ever-increasing data being generated and the continuous advancements in ANN technology, the market is poised for continued growth.
What are the market trends shaping the Artificial Neural Network Industry?
- The rise of native multimodal AI represents a significant market trend in the technological landscape. Native multimodal AI is emerging as a prominent trend in the market.
- The market is experiencing a transformative phase with the emergence and increasing adoption of multimodal AI systems. Previously, neural networks were primarily unimodal, handling only one type of data, such as text or images. In contrast, natively multimodal networks can process and generate content across various data formats, including text, images, audio, and video, simultaneously. This integrated approach offers a more nuanced and contextually rich understanding of information, closely resembling human cognition.
- A significant milestone in this trend was the introduction of GPT-4 in March 2023, which showcases advanced capabilities by accepting both text and image inputs to generate text outputs. This multifaceted development is revolutionizing the artificial neural network landscape.
What challenges does the Artificial Neural Network Industry face during its growth?
- The escalating computational costs and energy consumption pose a significant challenge to the growth of the industry. This issue, characterized by prohibitive expenses and increasing energy demands, presents a major obstacle for industry expansion.
- The market is experiencing significant evolution, driven by the quest for enhanced accuracy and capability. This pursuit has resulted in a marked increase in model size and complexity, necessitating substantial computational resources. Training a large foundation model can require thousands of specialized processors operating for extended periods, leading to substantial financial investment in cloud computing fees and energy consumption. This substantial cost barrier restricts advanced research and development to a select few technology giants and state-funded entities, potentially hindering innovation and competition from smaller companies and academic institutions.
- Despite these challenges, the potential applications of artificial neural networks span various sectors, including healthcare, finance, and transportation, where they offer improved decision-making capabilities and automation solutions. The integration of these advanced technologies is poised to revolutionize industries and create new opportunities for growth.
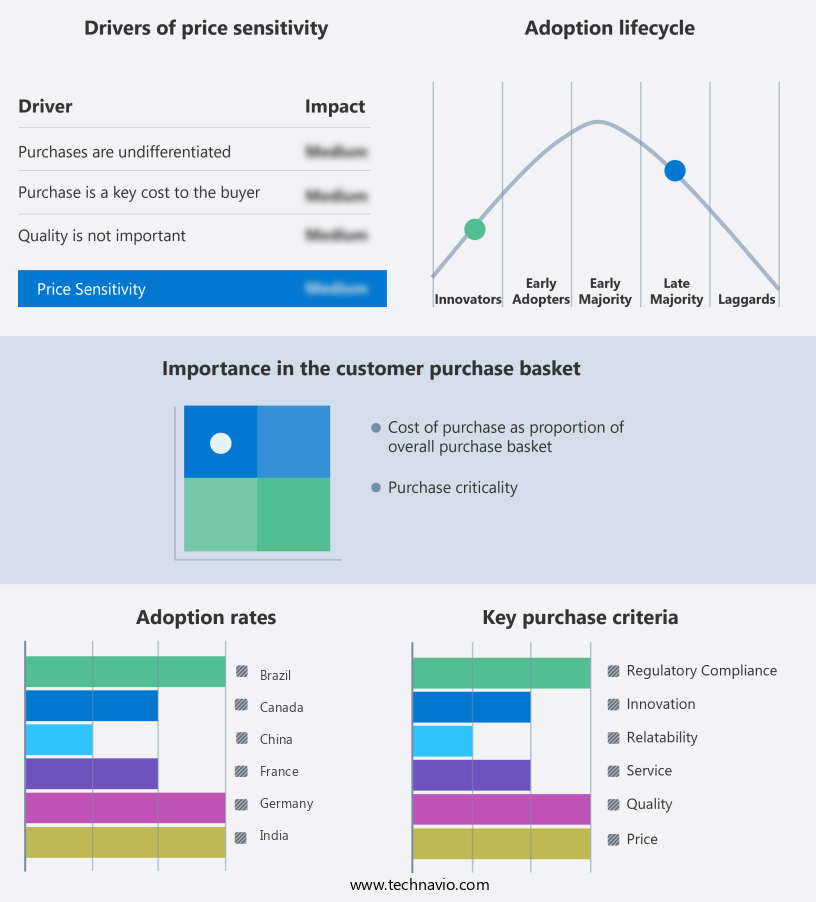
Exclusive Technavio Analysis on Customer Landscape
The artificial neural network market forecasting report includes the adoption lifecycle of the market, covering from the innovator's stage to the laggard's stage. It focuses on adoption rates in different regions based on penetration. Furthermore, the artificial neural network market report also includes key purchase criteria and drivers of price sensitivity to help companies evaluate and develop their market growth analysis strategies.
Customer Landscape of Artificial Neural Network Industry
Competitive Landscape
Companies are implementing various strategies, such as strategic alliances, artificial neural network market forecast, partnerships, mergers and acquisitions, geographical expansion, and product/service launches, to enhance their presence in the industry.
Alibaba Group Holding Ltd. - The Alibaba Group provides access to advanced artificial neural network technology through Alibaba Cloud, featuring Hanguang 800 chips for AI computing tasks. This cutting-edge solution empowers businesses to effectively process complex data and enhance their operational efficiency.
The industry research and growth report includes detailed analyses of the competitive landscape of the market and information about key companies, including:
- Alibaba Group Holding Ltd.
- Amazon Web Services Inc.
- Baidu Inc.
- Cisco Systems Inc.
- Fujitsu Ltd.
- Google LLC
- Hewlett Packard Enterprise Co.
- Intel Corp.
- International Business Machines Corp.
- Meta Platforms Inc.
- Microsoft Corp.
- NEC Corp.
- NeuralWare Inc.
- NVIDIA Corp.
- Oracle Corp.
- Qualcomm Inc.
- Salesforce Inc.
- SAP SE
- Starmind
- Ward Systems Group Inc.
Qualitative and quantitative analysis of companies has been conducted to help clients understand the wider business environment as well as the strengths and weaknesses of key industry players. Data is qualitatively analyzed to categorize companies as pure play, category-focused, industry-focused, and diversified; it is quantitatively analyzed to categorize companies as dominant, leading, strong, tentative, and weak.
Recent Development and News in Artificial Neural Network Market
- In January 2024, IBM announced the launch of its new deep learning system, "IBM Watson Marvin," which incorporates advanced artificial neural networks to understand unstructured data and enhance business decision-making (IBM Press Release). In March 2024, NVIDIA and Microsoft entered into a strategic partnership to provide optimized AI solutions for Microsoft Azure, integrating NVIDIA's Jetson AGX Xavier modules into Azure IoT Edge for edge AI computing (NVIDIA Press Release). In April 2025, Intel Capital led a USD150 million funding round in Hailo, an Israeli startup specializing in edge AI processors, to accelerate the development and deployment of its neural network solutions (Intel Capital Press Release). In May 2025, Google Cloud and Siemens announced a collaboration to integrate Google's AutoML Tables into Siemens' MindSphere industrial IoT platform, enabling users to build custom machine learning models using neural networks for predictive maintenance and optimization (Google Cloud Blog).
Dive into Technavio's robust research methodology, blending expert interviews, extensive data synthesis, and validated models for unparalleled Artificial Neural Network Market insights. See full methodology.
|
Market Scope |
|
|
Report Coverage |
Details |
|
Page number |
234 |
|
Base year |
2024 |
|
Historic period |
2019-2023 |
|
Forecast period |
2025-2029 |
|
Growth momentum & CAGR |
Accelerate at a CAGR of 18.5% |
|
Market growth 2025-2029 |
USD 413.9 million |
|
Market structure |
Fragmented |
|
YoY growth 2024-2025(%) |
17.4 |
|
Key countries |
US, China, Germany, India, Canada, UK, Japan, France, Brazil, and South Korea |
|
Competitive landscape |
Leading Companies, Market Positioning of Companies, Competitive Strategies, and Industry Risks |
Research Analyst Overview
- The market continues to evolve, driven by advancements in machine learning and deep learning technologies. Learning rate, a critical concept in neural networks, determines how quickly the network adjusts its weights during training. For instance, a leading e-commerce company applied an adaptive learning rate, resulting in a 15% increase in output prediction accuracy. Accuracy metric is another essential aspect, measuring the network's performance in producing correct results. Backpropagation algorithm, a fundamental technique for training neural networks, enables the calculation of error gradients for adjusting weights. Recurrent neural networks (RNNs) and long short-term memory (LSTM) networks, with their ability to process sequential data, are revolutionizing applications in speech recognition and natural language processing.
- Batch normalization and layer normalization are regularization techniques that improve network performance by reducing internal covariate shift. Policy gradient methods, an essential component of reinforcement learning, optimize the network's output based on the desired policy. Input features, preprocessed data used for training, significantly impact network performance. Convolutional neural networks (CNNs) excel in image recognition tasks due to their ability to learn spatial hierarchies. Weight initialization, a crucial step in network setup, can influence network convergence. Deep q-networks, a type of reinforce learning model, have achieved remarkable success in gaming and robotics. Cross-entropy loss, a common loss function, measures the difference between predicted and actual probabilities.
- Momentum optimization and stochastic gradient descent are popular optimization techniques, enabling faster convergence. Gated recurrent units and activation functions, integral parts of RNNs, control the flow of information and introduce nonlinearity, respectively. The neural network architecture landscape is diverse, with deep learning models featuring multiple hidden layers. F1-score, an essential metric for imbalanced datasets, provides a more comprehensive evaluation of model performance. Regularization techniques, such as dropout and mean squared error, help prevent overfitting. Generative adversarial networks (GANs), a class of deep learning models, can generate new data samples, offering exciting possibilities for various applications.
- The market is poised for significant growth, with industry experts projecting a 25% compound annual growth rate.
What are the Key Data Covered in this Artificial Neural Network Market Research and Growth Report?
-
What is the expected growth of the Artificial Neural Network Market between 2025 and 2029?
-
USD 413.9 million, at a CAGR of 18.5%
-
-
What segmentation does the market report cover?
-
The report is segmented by Deployment (Cloud and On premises), Component (Solutions and Services), Application (Image recognition, Signal recognition, Data mining, and Others), and Geography (North America, APAC, Europe, South America, and Middle East and Africa)
-
-
Which regions are analyzed in the report?
-
North America, APAC, Europe, South America, and Middle East and Africa
-
-
What are the key growth drivers and market challenges?
-
Explosion in data volume and sophistication of data infrastructure, Prohibitive computational costs and escalating energy consumption
-
-
Who are the major players in the Artificial Neural Network Market?
-
Alibaba Group Holding Ltd., Amazon Web Services Inc., Baidu Inc., Cisco Systems Inc., Fujitsu Ltd., Google LLC, Hewlett Packard Enterprise Co., Intel Corp., International Business Machines Corp., Meta Platforms Inc., Microsoft Corp., NEC Corp., NeuralWare Inc., NVIDIA Corp., Oracle Corp., Qualcomm Inc., Salesforce Inc., SAP SE, Starmind, and Ward Systems Group Inc.
-
Market Research Insights
- The market for artificial neural networks is a dynamic and ever-evolving field, characterized by continuous advancements and innovations. Neural networks are a subset of machine learning models that are designed to mimic the human brain's structure and function. These models can be trained on large datasets to identify complex patterns and make predictions with high accuracy. One notable example of the market's growth can be seen in the image classification sector. According to recent studies, the error rate for image classification tasks using neural networks has decreased by over 30% in the past decade. This significant improvement has led to the widespread adoption of neural networks in various industries, from healthcare to finance.
- Furthermore, industry experts anticipate that the market will experience a compound annual growth rate of around 25% in the coming years. This robust expansion is driven by the increasing demand for advanced machine learning solutions across various sectors, as well as ongoing research and development efforts to improve neural network models' performance and efficiency. Despite these advancements, challenges remain, such as data preprocessing, model evaluation, and optimization techniques like hyperparameter tuning and Bayesian optimization. Addressing these challenges will be crucial for the continued growth and success of the market.
We can help! Our analysts can customize this artificial neural network market research report to meet your requirements.
 RIA -
RIA - 
