Automated Guided Vehicle (AGV) Software Market Analysis APAC, North America, Europe, South America, Middle East and Africa - US, China, Japan, Germany, UK - Size and Forecast 2024-2028

Automated Guided Vehicle (AGV) Software Market Analysis APAC, North America, Europe, South America, Middle East and Africa - US, China, Japan, Germany, UK - Size and Forecast 2024-2028

Published: Jan 2024 179 Pages SKU: IRTNTR41331

Market Overview at a Glance

$450.49 Mn
Market Opportunity
9.88%
CAGR
8.07
YoY growth 2023-2024(%)

Automated Guided Vehicle (AGV) Software Market Size 2024-2028

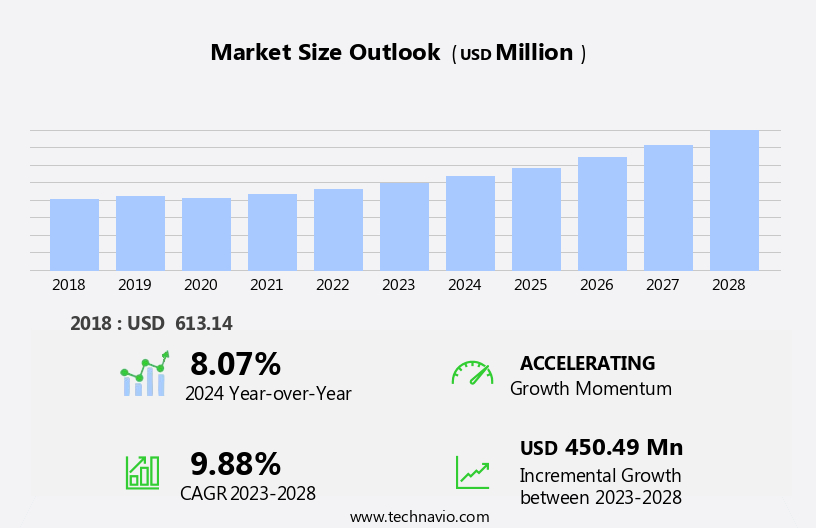
The automated guided vehicle (agv) software market size is forecast to increase by USD 450.49 million at a CAGR of 9.88% between 2023 and 2028.

  • The market is experiencing significant growth, driven primarily by the expanding e-commerce industry and the integration of Industry 4.0 with IoT technologies. These trends are transforming logistics and manufacturing processes, leading to increased demand for AGV systems to automate material handling and streamline operations. However, resistance to adopt new technologies related to AGV software poses a challenge for market growth. Companies must invest in education and training to overcome this obstacle and effectively communicate the benefits of AGV software to potential customers.
  • By capitalizing on these market opportunities and addressing the challenges, organizations can optimize their supply chain operations, enhance productivity, and gain a competitive edge in their industries.

What will be the Size of the Automated Guided Vehicle (AGV) Software Market during the forecast period?

Automated Guided Vehicle (AGV) Software Market Size

 Request Free Sample

  • The AGV software market continues to evolve, driven by advancements in technology and increasing adoption across various sectors. User experience (UX) and artificial intelligence (AI) are key focus areas, with mapping software and path planning integrating seamlessly to optimize material handling in warehouses. Predictive maintenance and hardware compatibility are essential for ensuring AGVs operate efficiently, while 3D vision and support services enhance safety and performance. Deep learning and machine learning algorithms enable AGVs to adapt to changing environments and traffic patterns. Fleet management and traffic management systems provide real-time monitoring and remote control capabilities, while cloud-based platforms offer on-demand access and scalability.
  • Obstacle avoidance and safety protocols are crucial components, ensuring AGVs navigate complex warehouse environments safely. Software-as-a-service (SaaS) deployment models offer flexibility and cost savings, while laser scanning technology enhances mapping accuracy and precision. The AGV software market's continuous dynamism is reflected in its integration of UI, maintenance contracts, and advanced features like deep learning and real-time monitoring. Applications span industries, including food and beverage, where AGVs optimize inventory management and streamline production processes. In the evolving landscape, AGV software providers must stay agile, integrating new technologies and adapting to changing customer needs. The market's future promises further innovation, with ongoing advancements in AI, machine learning, and data analytics shaping the future of AGV navigation and material handling.

How is this Automated Guided Vehicle (AGV) Software Industry segmented?

The automated guided vehicle (agv) software industry research report provides comprehensive data (region-wise segment analysis), with forecasts and estimates in "USD million" for the period 2024-2028, as well as historical data from 2018-2022 for the following segments.

  • Type
    • In-built vehicle software
    • Integrated software
  • End-user
    • Distribution and logistics
    • Food and beverages
    • Automotive
    • Retail
    • Others
  • Geography
    • North America
      • US
    • Europe
      • Germany
      • UK
    • APAC
      • China
      • Japan
    • Rest of World (ROW)

    By Type Insights

    The in-built vehicle software segment is estimated to witness significant growth during the forecast period.

    The in-built vehicle software market for Automated Guided Vehicles (AGVs) is experiencing significant growth, surpassing the average rate of expansion in the global market. This upward trend can be attributed to the increasing adoption of AGVs in industries such as manufacturing, distribution and logistics, retail, and automotive. AGVs, including unit load carriers, tow vehicles, pallet trucks, and assembly line machines, rely on in-built navigation and management software for guidance on the shop floor and efficient transportation operations. The software is installed directly into the AGVs and facilitates seamless interaction between the vehicle and its environment. User experience (UX) plays a crucial role in the design of AGV software, ensuring intuitive interfaces and easy-to-use features for operators.

    Artificial intelligence (AI) and machine learning algorithms are integrated into the software for predictive maintenance, optimizing warehouse layouts, and enhancing fleet management. Deep learning techniques enable obstacle avoidance and traffic management, while 3D vision technology improves safety protocols and path planning. In addition, AGV software offers various deployment options, including on-premise and Software-as-a-Service (SaaS), catering to diverse industry needs. Real-time monitoring and cloud-based platforms provide valuable data analytics for continuous process improvement. Maintenance contracts and support services ensure optimal performance and longevity of the AGVs. The market is also witnessing the integration of advanced technologies like laser scanning and safety protocols to further enhance the capabilities of AGV software.

    Overall, the in-built vehicle software market for AGVs is a dynamic and evolving landscape, driven by the ongoing integration of innovative technologies and the growing demand for automation in various industries.

    Automated Guided Vehicle (AGV) Software Market Size

    Request Free Sample

    The In-built vehicle software segment was valued at USD 359.24 million in 2018 and showed a gradual increase during the forecast period.

    Regional Analysis

    APAC is estimated to contribute 39% to the growth of the global market during the forecast period.Technavio’s analysts have elaborately explained the regional trends and drivers that shape the market during the forecast period.

    Automated Guided Vehicle (AGV) Software Market Share by Geography

     Request Free Sample

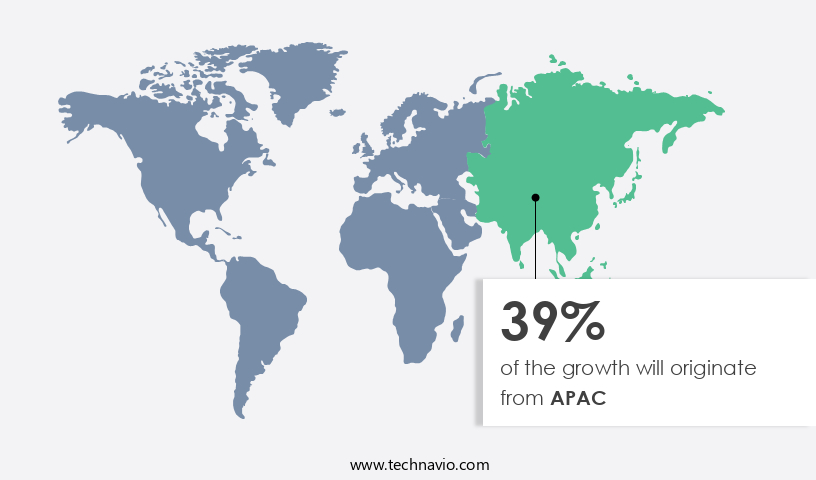
    The market in Asia Pacific (APAC) is experiencing significant growth due to the increasing adoption of advanced technologies and the influx of small and medium-sized enterprises (SMEs) in the region. While APAC is expected to record substantial growth in the AGV software market during the forecast period, it currently lags behind North America and Europe due to the late adoption of technologies and the overall maturity of the industrial sector. China is the dominant player in the APAC AGV software market, with Japan and South Korea also making strides in industrial automation. AGV software solutions are integral to material handling and warehouse optimization, enabling efficient fleet management, traffic management, and obstacle avoidance.

    User experience (UX) and user interface (UI) design play crucial roles in ensuring seamless integration with hardware, including 3D vision, laser scanning, and safety protocols. Machine learning and predictive maintenance are key features that enhance the value of AGV software, providing real-time monitoring and predictive analytics. Artificial intelligence (AI) and deep learning algorithms are increasingly being integrated into AGV software for path planning and obstacle avoidance, enhancing overall performance and safety. Support services and maintenance contracts ensure smooth operations, while software-as-a-service (SaaS) and on-premise deployment options cater to varying business needs. The food and beverage industry is a significant end-user of AGV software, with applications ranging from material handling to inventory management and fleet optimization.

    The AGV software market in APAC is poised for growth, with a focus on enhancing operational efficiency, reducing costs, and improving safety. The integration of advanced technologies, such as AI, machine learning, and predictive maintenance, is expected to drive market growth and provide a competitive edge to businesses in the region.

    Market Dynamics

    Our researchers analyzed the data with 2023 as the base year, along with the key drivers, trends, and challenges. A holistic analysis of drivers will help companies refine their marketing strategies to gain a competitive advantage.

    What are the key market drivers leading to the rise in the adoption of Automated Guided Vehicle (AGV) Software Industry?

    • The e-commerce sector's continuous growth serves as the primary catalyst for market expansion. 

    • The global market for Automated Guided Vehicle (AGV) software is experiencing significant growth due to the expanding e-commerce sector. As more consumers opt for online shopping, businesses are expanding their order processing capabilities in warehouses and distribution centers. The number of these facilities has grown rapidly in recent years, with major markets including China, India, the US, the UK, Germany, France, and Japan. The global e-commerce industry is growing at an annual rate exceeding 10%, driven by the increasing penetration of internet connectivity and the convenience it offers. For instance, the e-commerce market in India is projected to grow at a Compound Annual Growth Rate (CAGR) of over 20% during the forecast period.
    • AGV software plays a crucial role in optimizing the operations of these facilities by enabling remote control and real-time monitoring of vehicles through a cloud-based platform. Additionally, safety protocols and data analytics features enhance efficiency and productivity. Laser scanning technology ensures accurate navigation and collision avoidance, while safety protocols prevent accidents and ensure the safety of workers and goods. In conclusion, the growing e-commerce industry and the resulting expansion of warehouses and distribution centers are driving the demand for AGV software. The technology's ability to improve efficiency, productivity, and safety makes it an essential investment for businesses in this sector.

    What are the market trends shaping the Automated Guided Vehicle (AGV) Software Industry?

    • The integration of Industry 4.0 and the Internet of Things (IoT) is becoming a significant market trend. This convergence represents the next evolution in industrial manufacturing, enhancing operational efficiency and productivity.

    • The market is experiencing significant growth in the context of the ongoing industrial revolution, with a focus on automation and data exchange in manufacturing and material handling processes. AGV systems, which utilize machine learning and artificial intelligence for navigation, are integral to this trend. These systems enable the seamless movement of materials within a factory environment with minimal human intervention. AGV software plays a crucial role in optimizing warehouse operations by integrating various machines, devices, and sensors into a unified system. This integration allows for real-time monitoring and control of the entire manufacturing process.
    • Moreover, the use of mapping software and user experience (UX) design enhances the efficiency and accuracy of AGV navigation. Machine learning algorithms are employed to analyze data from various sources and make informed decisions, leading to improved productivity and reduced errors. The integration of AGV software into Industry 4.0-compliant factories also enables decentralized decision-making, further enhancing operational efficiency. In conclusion, the adoption of AGV software is a key component of the industrial revolution, providing numerous benefits in terms of material handling, warehouse optimization, and data analysis. The integration of machine learning and artificial intelligence, along with user experience design and mapping software, ensures a harmonious and immersive experience for operators and enhances overall factory performance.

    What challenges does the Automated Guided Vehicle (AGV) Software Industry face during its growth?

    • The implementation of new AGV software technologies encounters significant resistance within the industry, posing a substantial challenge to its growth. 

    • In today's business landscape, many industries, including manufacturing, retail, transportation and logistics, and healthcare, are grappling with the challenges of adopting modern technologies for warehouse management. Traditional manual methods have long been the norm, but the emergence of advanced technologies is making the transition to automated systems increasingly necessary. These new technologies bring with them a heightened level of responsibility for companies, as they must keep up with the latest innovations to remain competitive. One such technology is Automated Guided Vehicle (AGV) software. AGV systems utilize predictive maintenance capabilities to minimize downtime and maximize efficiency.
    • Hardware compatibility is essential to ensure seamless integration with existing warehouse infrastructure. Advanced features such as 3D vision and deep learning algorithms enhance the system's capabilities, while user-friendly interfaces simplify operation. Moreover, robust support services are crucial to ensure the smooth functioning of AGV systems. Maintenance contracts provide peace of mind, ensuring that any issues are addressed promptly. As the adoption of AGV software continues to grow, companies must carefully consider these factors to make an informed decision and successfully implement these advanced systems.

    Exclusive Customer Landscape

    The automated guided vehicle (agv) software market forecasting report includes the adoption lifecycle of the market, covering from the innovator’s stage to the laggard’s stage. It focuses on adoption rates in different regions based on penetration. Furthermore, the automated guided vehicle (agv) software market report also includes key purchase criteria and drivers of price sensitivity to help companies evaluate and develop their market growth analysis strategies.

    Automated Guided Vehicle (AGV) Software Market Share by Geography

     Customer Landscape

    Key Companies & Market Insights

    Companies are implementing various strategies, such as strategic alliances, automated guided vehicle (agv) software market forecast, partnerships, mergers and acquisitions, geographical expansion, and product/service launches, to enhance their presence in the industry.

    Alstef Group SAS - This company specializes in providing automated guided vehicle (AGV) systems, featuring interconnected conveyor networks and complementary technologies. These integrated solutions enhance production efficiency and support quality control processes. The AGVs navigate autonomously through the transit network, ensuring seamless material handling and optimizing overall logistics operations. By combining advanced automation with complementary systems, this company delivers comprehensive, efficient, and adaptable supply chain solutions.

    The industry research and growth report includes detailed analyses of the competitive landscape of the market and information about key companies, including:

    • Alstef Group SAS
    • Balyo SA
    • Daifuku Co. Ltd
    • Danaher Corp.
    • E80 GROUP SPA
    • Gotting KG
    • Honeywell International Inc.
    • Hyster Yale Materials Handling Inc.
    • John Bean Technologies Corp.
    • KION GROUP AG
    • KMH Fleet Solutions
    • KUKA AG
    • Murata Machinery Ltd.
    • Oceaneering International Inc.
    • Scott Technology Ltd.
    • Seegrid Corp.
    • TALUMIS BV
    • TGW LOGISTICS GROUP GmbH
    • Toyota Industries Corp.
    • SSI Schafer IT Solutions GmbH

    Qualitative and quantitative analysis of companies has been conducted to help clients understand the wider business environment as well as the strengths and weaknesses of key industry players. Data is qualitatively analyzed to categorize companies as pure play, category-focused, industry-focused, and diversified; it is quantitatively analyzed to categorize companies as dominant, leading, strong, tentative, and weak.

    Recent Development and News in Automated Guided Vehicle (AGV) Software Market

    • In February 2024, Swisslog, a leading global automation solutions provider, announced the launch of its new SynQ Lite software for AGVs. This lightweight and cost-effective solution aims to cater to small and medium-sized warehouses, broadening Swisslog's AGV software offerings and expanding its customer base (Swisslog Press Release).
    • In May 2025, Kion Group, a leading industrial automation company, acquired the AGV software business of Dematic, a leading global supplier of automated material handling solutions. This strategic acquisition enabled Kion to strengthen its AGV software capabilities and enhance its market position (Kion Group Press Release).
    • In August 2024, Siemens announced the deployment of its new AGV software, Siemens SIMATIC AGV, at a major automotive manufacturer in Europe. The advanced software features real-time data analytics and predictive maintenance capabilities, significantly improving operational efficiency and reducing downtime (Siemens Press Release).
    • In November 2025, Cisco and Honeywell collaborated to integrate Cisco's IoT technology with Honeywell's Mission Critical Network Services and AGV software. This partnership aimed to provide enhanced connectivity and data analytics for AGVs, enabling real-time monitoring and predictive maintenance (Cisco Press Release).

    Research Analyst Overview

    The market is experiencing significant growth, driven by the increasing demand for order fulfillment and picking and packing automation in various industries. Collaborative robots (cobots) and human-robot collaboration are key trends, enabling process optimization and productivity gains through data visualization and predictive analytics. Industrial automation solutions, including AGVs, are integral to digital transformation, with fleet optimization, remote monitoring, and cost savings being major incentives. Security features, such as collision avoidance and RFID (radio-frequency identification), ensure safe and efficient operations. Smart factories leverage system integration, production efficiency, and performance tracking, while energy efficiency and remote diagnostics enhance sustainability and maintenance. Autonomous navigation and sensor fusion improve industrial robots' capabilities, enhancing assembly lines and path optimization.

    AGV software market players focus on providing advanced features like real-time performance tracking, autonomous navigation, and system integration to meet evolving industry demands. Conveyor systems and supply chain management are also benefiting from AGV software's capabilities, further expanding its reach in the industrial landscape.

    Dive into Technavio’s robust research methodology, blending expert interviews, extensive data synthesis, and validated models for unparalleled Automated Guided Vehicle (AGV) Software Market insights. See full methodology.

    Market Scope

    Report Coverage

    Details

    Page number

    179

    Base year

    2023

    Historic period

    2018-2022

    Forecast period

    2024-2028

    Growth momentum & CAGR

    Accelerate at a CAGR of 9.88%

    Market growth 2024-2028

    USD 450.49 million

    Market structure

    Fragmented

    YoY growth 2023-2024(%)

    8.07

    Key countries

    US, China, Japan, Germany, and UK

    Competitive landscape

    Leading Companies, Market Positioning of Companies, Competitive Strategies, and Industry Risks

    Request Free Sample

    What are the Key Data Covered in this Automated Guided Vehicle (AGV) Software Market Research and Growth Report?

    • CAGR of the Automated Guided Vehicle (AGV) Software industry during the forecast period
    • Detailed information on factors that will drive the growth and forecasting between 2024 and 2028
    • Precise estimation of the size of the market and its contribution of the industry in focus to the parent market
    • Accurate predictions about upcoming growth and trends and changes in consumer behaviour
    • Growth of the market across APAC, North America, Europe, South America, and Middle East and Africa
    • Thorough analysis of the market’s competitive landscape and detailed information about companies
    • Comprehensive analysis of factors that will challenge the automated guided vehicle (agv) software market growth of industry companies

    We can help! Our analysts can customize this automated guided vehicle (agv) software market research report to meet your requirements.

    Get in touch


    1 Executive Summary

    • 1.1 Market overview
      • Exhibit 01: Executive Summary – Chart on Market Overview
      • Exhibit 02: Executive Summary – Data Table on Market Overview
      • Exhibit 03: Executive Summary – Chart on Global Market Characteristics
      • Exhibit 04: Executive Summary – Chart on Market by Geography
      • Exhibit 05: Executive Summary – Chart on Market Segmentation by Type
      • Exhibit 06: Executive Summary – Chart on Market Segmentation by End-user
      • Exhibit 07: Executive Summary – Chart on Incremental Growth
      • Exhibit 08: Executive Summary – Data Table on Incremental Growth
      • Exhibit 09: Executive Summary – Chart on Vendor Market Positioning

    2 Market Landscape

    • 2.1 Market ecosystem
      • Exhibit 10: Parent market
      • Exhibit 11: Market Characteristics

    3 Market Sizing

    • 3.1 Market definition
      • Exhibit 12: Offerings of vendors included in the market definition
    • 3.2 Market segment analysis
      • Exhibit 13: Market segments
    • 3.3 Market size 2023
      • 3.4 Market outlook: Forecast for 2023-2028
        • Exhibit 14: Chart on Global - Market size and forecast 2023-2028 ($ million)
        • Exhibit 15: Data Table on Global - Market size and forecast 2023-2028 ($ million)
        • Exhibit 16: Chart on Global Market: Year-over-year growth 2023-2028 (%)
        • Exhibit 17: Data Table on Global Market: Year-over-year growth 2023-2028 (%)

      4 Historic Market Size

      • 4.1 Global automated guided vehicle software 2018 - 2022
        • Exhibit 18: Historic Market Size – Data Table on global automated guided vehicle software 2018 - 2022 ($ million)
      • 4.2 Type Segment Analysis 2018 - 2022
        • Exhibit 19: Historic Market Size – Type Segment 2018 - 2022 ($ million)
      • 4.3 End-user Segment Analysis 2018 - 2022
        • Exhibit 20: Historic Market Size – End-user Segment 2018 - 2022 ($ million)
      • 4.4 Geography Segment Analysis 2018 - 2022
        • Exhibit 21: Historic Market Size – Geography Segment 2018 - 2022 ($ million)
      • 4.5 Country Segment Analysis 2018 - 2022
        • Exhibit 22: Historic Market Size – Country Segment 2018 - 2022 ($ million)

      5 Five Forces Analysis

      • 5.1 Five forces summary
        • Exhibit 23: Five forces analysis - Comparison between 2023 and 2028
      • 5.2 Bargaining power of buyers
        • Exhibit 24: Chart on Bargaining power of buyers – Impact of key factors 2023 and 2028
      • 5.3 Bargaining power of suppliers
        • Exhibit 25: Bargaining power of suppliers – Impact of key factors in 2023 and 2028
      • 5.4 Threat of new entrants
        • Exhibit 26: Threat of new entrants – Impact of key factors in 2023 and 2028
      • 5.5 Threat of substitutes
        • Exhibit 27: Threat of substitutes – Impact of key factors in 2023 and 2028
      • 5.6 Threat of rivalry
        • Exhibit 28: Threat of rivalry – Impact of key factors in 2023 and 2028
      • 5.7 Market condition
        • Exhibit 29: Chart on Market condition - Five forces 2023 and 2028

      6 Market Segmentation by Type

      • 6.1 Market segments
        • Exhibit 30: Chart on Type - Market share 2023-2028 (%)
        • Exhibit 31: Data Table on Type - Market share 2023-2028 (%)
      • 6.2 Comparison by Type
        • Exhibit 32: Chart on Comparison by Type
        • Exhibit 33: Data Table on Comparison by Type
      • 6.3 In-built vehicle software - Market size and forecast 2023-2028
        • Exhibit 34: Chart on In-built vehicle software - Market size and forecast 2023-2028 ($ million)
        • Exhibit 35: Data Table on In-built vehicle software - Market size and forecast 2023-2028 ($ million)
        • Exhibit 36: Chart on In-built vehicle software - Year-over-year growth 2023-2028 (%)
        • Exhibit 37: Data Table on In-built vehicle software - Year-over-year growth 2023-2028 (%)
      • 6.4 Integrated software - Market size and forecast 2023-2028
        • Exhibit 38: Chart on Integrated software - Market size and forecast 2023-2028 ($ million)
        • Exhibit 39: Data Table on Integrated software - Market size and forecast 2023-2028 ($ million)
        • Exhibit 40: Chart on Integrated software - Year-over-year growth 2023-2028 (%)
        • Exhibit 41: Data Table on Integrated software - Year-over-year growth 2023-2028 (%)
      • 6.5 Market opportunity by Type
        • Exhibit 42: Market opportunity by Type ($ million)
        • Exhibit 43: Data Table on Market opportunity by Type ($ million)

      7 Market Segmentation by End-user

      • 7.1 Market segments
        • Exhibit 44: Chart on End-user - Market share 2023-2028 (%)
        • Exhibit 45: Data Table on End-user - Market share 2023-2028 (%)
      • 7.2 Comparison by End-user
        • Exhibit 46: Chart on Comparison by End-user
        • Exhibit 47: Data Table on Comparison by End-user
      • 7.3 Distribution and logistics - Market size and forecast 2023-2028
        • Exhibit 48: Chart on Distribution and logistics - Market size and forecast 2023-2028 ($ million)
        • Exhibit 49: Data Table on Distribution and logistics - Market size and forecast 2023-2028 ($ million)
        • Exhibit 50: Chart on Distribution and logistics - Year-over-year growth 2023-2028 (%)
        • Exhibit 51: Data Table on Distribution and logistics - Year-over-year growth 2023-2028 (%)
      • 7.4 Food and beverages - Market size and forecast 2023-2028
        • Exhibit 52: Chart on Food and beverages - Market size and forecast 2023-2028 ($ million)
        • Exhibit 53: Data Table on Food and beverages - Market size and forecast 2023-2028 ($ million)
        • Exhibit 54: Chart on Food and beverages - Year-over-year growth 2023-2028 (%)
        • Exhibit 55: Data Table on Food and beverages - Year-over-year growth 2023-2028 (%)
      • 7.5 Automotive - Market size and forecast 2023-2028
        • Exhibit 56: Chart on Automotive - Market size and forecast 2023-2028 ($ million)
        • Exhibit 57: Data Table on Automotive - Market size and forecast 2023-2028 ($ million)
        • Exhibit 58: Chart on Automotive - Year-over-year growth 2023-2028 (%)
        • Exhibit 59: Data Table on Automotive - Year-over-year growth 2023-2028 (%)
      • 7.6 Retail - Market size and forecast 2023-2028
        • Exhibit 60: Chart on Retail - Market size and forecast 2023-2028 ($ million)
        • Exhibit 61: Data Table on Retail - Market size and forecast 2023-2028 ($ million)
        • Exhibit 62: Chart on Retail - Year-over-year growth 2023-2028 (%)
        • Exhibit 63: Data Table on Retail - Year-over-year growth 2023-2028 (%)
      • 7.7 Others - Market size and forecast 2023-2028
        • Exhibit 64: Chart on Others - Market size and forecast 2023-2028 ($ million)
        • Exhibit 65: Data Table on Others - Market size and forecast 2023-2028 ($ million)
        • Exhibit 66: Chart on Others - Year-over-year growth 2023-2028 (%)
        • Exhibit 67: Data Table on Others - Year-over-year growth 2023-2028 (%)
      • 7.8 Market opportunity by End-user
        • Exhibit 68: Market opportunity by End-user ($ million)
        • Exhibit 69: Data Table on Market opportunity by End-user ($ million)

      8 Customer Landscape

      • 8.1 Customer landscape overview
        • Exhibit 70: Analysis of price sensitivity, lifecycle, customer purchase basket, adoption rates, and purchase criteria

      9 Geographic Landscape

      • 9.1 Geographic segmentation
        • Exhibit 71: Chart on Market share by geography 2023-2028 (%)
        • Exhibit 72: Data Table on Market share by geography 2023-2028 (%)
      • 9.2 Geographic comparison
        • Exhibit 73: Chart on Geographic comparison
        • Exhibit 74: Data Table on Geographic comparison
      • 9.3 APAC - Market size and forecast 2023-2028
        • Exhibit 75: Chart on APAC - Market size and forecast 2023-2028 ($ million)
        • Exhibit 76: Data Table on APAC - Market size and forecast 2023-2028 ($ million)
        • Exhibit 77: Chart on APAC - Year-over-year growth 2023-2028 (%)
        • Exhibit 78: Data Table on APAC - Year-over-year growth 2023-2028 (%)
      • 9.4 North America - Market size and forecast 2023-2028
        • Exhibit 79: Chart on North America - Market size and forecast 2023-2028 ($ million)
        • Exhibit 80: Data Table on North America - Market size and forecast 2023-2028 ($ million)
        • Exhibit 81: Chart on North America - Year-over-year growth 2023-2028 (%)
        • Exhibit 82: Data Table on North America - Year-over-year growth 2023-2028 (%)
      • 9.5 Europe - Market size and forecast 2023-2028
        • Exhibit 83: Chart on Europe - Market size and forecast 2023-2028 ($ million)
        • Exhibit 84: Data Table on Europe - Market size and forecast 2023-2028 ($ million)
        • Exhibit 85: Chart on Europe - Year-over-year growth 2023-2028 (%)
        • Exhibit 86: Data Table on Europe - Year-over-year growth 2023-2028 (%)
      • 9.6 South America - Market size and forecast 2023-2028
        • Exhibit 87: Chart on South America - Market size and forecast 2023-2028 ($ million)
        • Exhibit 88: Data Table on South America - Market size and forecast 2023-2028 ($ million)
        • Exhibit 89: Chart on South America - Year-over-year growth 2023-2028 (%)
        • Exhibit 90: Data Table on South America - Year-over-year growth 2023-2028 (%)
      • 9.7 Middle East and Africa - Market size and forecast 2023-2028
        • Exhibit 91: Chart on Middle East and Africa - Market size and forecast 2023-2028 ($ million)
        • Exhibit 92: Data Table on Middle East and Africa - Market size and forecast 2023-2028 ($ million)
        • Exhibit 93: Chart on Middle East and Africa - Year-over-year growth 2023-2028 (%)
        • Exhibit 94: Data Table on Middle East and Africa - Year-over-year growth 2023-2028 (%)
      • 9.8 US - Market size and forecast 2023-2028
        • Exhibit 95: Chart on US - Market size and forecast 2023-2028 ($ million)
        • Exhibit 96: Data Table on US - Market size and forecast 2023-2028 ($ million)
        • Exhibit 97: Chart on US - Year-over-year growth 2023-2028 (%)
        • Exhibit 98: Data Table on US - Year-over-year growth 2023-2028 (%)
      • 9.9 China - Market size and forecast 2023-2028
        • Exhibit 99: Chart on China - Market size and forecast 2023-2028 ($ million)
        • Exhibit 100: Data Table on China - Market size and forecast 2023-2028 ($ million)
        • Exhibit 101: Chart on China - Year-over-year growth 2023-2028 (%)
        • Exhibit 102: Data Table on China - Year-over-year growth 2023-2028 (%)
      • 9.10 Germany - Market size and forecast 2023-2028
        • Exhibit 103: Chart on Germany - Market size and forecast 2023-2028 ($ million)
        • Exhibit 104: Data Table on Germany - Market size and forecast 2023-2028 ($ million)
        • Exhibit 105: Chart on Germany - Year-over-year growth 2023-2028 (%)
        • Exhibit 106: Data Table on Germany - Year-over-year growth 2023-2028 (%)
      • 9.11 Japan - Market size and forecast 2023-2028
        • Exhibit 107: Chart on Japan - Market size and forecast 2023-2028 ($ million)
        • Exhibit 108: Data Table on Japan - Market size and forecast 2023-2028 ($ million)
        • Exhibit 109: Chart on Japan - Year-over-year growth 2023-2028 (%)
        • Exhibit 110: Data Table on Japan - Year-over-year growth 2023-2028 (%)
      • 9.12 UK - Market size and forecast 2023-2028
        • Exhibit 111: Chart on UK - Market size and forecast 2023-2028 ($ million)
        • Exhibit 112: Data Table on UK - Market size and forecast 2023-2028 ($ million)
        • Exhibit 113: Chart on UK - Year-over-year growth 2023-2028 (%)
        • Exhibit 114: Data Table on UK - Year-over-year growth 2023-2028 (%)
      • 9.13 Market opportunity by geography
        • Exhibit 115: Market opportunity by geography ($ million)
        • Exhibit 116: Data Tables on Market opportunity by geography ($ million)

      10 Drivers, Challenges, and Trends

      • 10.1 Market drivers
        • 10.2 Market challenges
          • 10.3 Impact of drivers and challenges
            • Exhibit 117: Impact of drivers and challenges in 2023 and 2028
          • 10.4 Market trends

            11 Vendor Landscape

            • 11.1 Overview
              • 11.2 Vendor landscape
                • Exhibit 118: Overview on Criticality of inputs and Factors of differentiation
              • 11.3 Landscape disruption
                • Exhibit 119: Overview on factors of disruption
              • 11.4 Industry risks
                • Exhibit 120: Impact of key risks on business

              12 Vendor Analysis

              • 12.1 Vendors covered
                • Exhibit 121: Vendors covered
              • 12.2 Market positioning of vendors
                • Exhibit 122: Matrix on vendor position and classification
              • 12.3 Alstef Group SAS
                • Exhibit 123: Alstef Group SAS - Overview
                • Exhibit 124: Alstef Group SAS - Product / Service
                • Exhibit 125: Alstef Group SAS - Key offerings
              • 12.4 Balyo SA
                • Exhibit 126: Balyo SA - Overview
                • Exhibit 127: Balyo SA - Product / Service
                • Exhibit 128: Balyo SA - Key offerings
              • 12.5 Daifuku Co. Ltd
                • Exhibit 129: Daifuku Co. Ltd - Overview
                • Exhibit 130: Daifuku Co. Ltd - Product / Service
                • Exhibit 131: Daifuku Co. Ltd - Key offerings
              • 12.6 Danaher Corp.
                • Exhibit 132: Danaher Corp. - Overview
                • Exhibit 133: Danaher Corp. - Business segments
                • Exhibit 134: Danaher Corp. - Key news
                • Exhibit 135: Danaher Corp. - Key offerings
                • Exhibit 136: Danaher Corp. - Segment focus
              • 12.7 E80 GROUP SPA
                • Exhibit 137: E80 GROUP SPA - Overview
                • Exhibit 138: E80 GROUP SPA - Product / Service
                • Exhibit 139: E80 GROUP SPA - Key offerings
              • 12.8 Gotting KG
                • Exhibit 140: Gotting KG - Overview
                • Exhibit 141: Gotting KG - Product / Service
                • Exhibit 142: Gotting KG - Key offerings
              • 12.9 Honeywell International Inc.
                • Exhibit 143: Honeywell International Inc. - Overview
                • Exhibit 144: Honeywell International Inc. - Business segments
                • Exhibit 145: Honeywell International Inc. - Key news
                • Exhibit 146: Honeywell International Inc. - Key offerings
                • Exhibit 147: Honeywell International Inc. - Segment focus
              • 12.10 Hyster Yale Materials Handling Inc.
                • Exhibit 148: Hyster Yale Materials Handling Inc. - Overview
                • Exhibit 149: Hyster Yale Materials Handling Inc. - Business segments
                • Exhibit 150: Hyster Yale Materials Handling Inc. - Key offerings
                • Exhibit 151: Hyster Yale Materials Handling Inc. - Segment focus
              • 12.11 John Bean Technologies Corp.
                • Exhibit 152: John Bean Technologies Corp. - Overview
                • Exhibit 153: John Bean Technologies Corp. - Business segments
                • Exhibit 154: John Bean Technologies Corp. - Key offerings
                • Exhibit 155: John Bean Technologies Corp. - Segment focus
              • 12.12 KION GROUP AG
                • Exhibit 156: KION GROUP AG - Overview
                • Exhibit 157: KION GROUP AG - Business segments
                • Exhibit 158: KION GROUP AG - Key offerings
                • Exhibit 159: KION GROUP AG - Segment focus
              • 12.13 KUKA AG
                • Exhibit 160: KUKA AG - Overview
                • Exhibit 161: KUKA AG - Business segments
                • Exhibit 162: KUKA AG - Key offerings
                • Exhibit 163: KUKA AG - Segment focus
              • 12.14 Murata Machinery Ltd.
                • Exhibit 164: Murata Machinery Ltd. - Overview
                • Exhibit 165: Murata Machinery Ltd. - Business segments
                • Exhibit 166: Murata Machinery Ltd. - Key offerings
                • Exhibit 167: Murata Machinery Ltd. - Segment focus
              • 12.15 SSI Schafer IT Solutions GmbH
                • Exhibit 168: SSI Schafer IT Solutions GmbH - Overview
                • Exhibit 169: SSI Schafer IT Solutions GmbH - Product / Service
                • Exhibit 170: SSI Schafer IT Solutions GmbH - Key offerings
              • 12.16 TGW LOGISTICS GROUP GmbH
                • Exhibit 171: TGW LOGISTICS GROUP GmbH - Overview
                • Exhibit 172: TGW LOGISTICS GROUP GmbH - Product / Service
                • Exhibit 173: TGW LOGISTICS GROUP GmbH - Key offerings
              • 12.17 Toyota Industries Corp.
                • Exhibit 174: Toyota Industries Corp. - Overview
                • Exhibit 175: Toyota Industries Corp. - Business segments
                • Exhibit 176: Toyota Industries Corp. - Key news
                • Exhibit 177: Toyota Industries Corp. - Key offerings
                • Exhibit 178: Toyota Industries Corp. - Segment focus

              13 Appendix

              • 13.1 Scope of the report
                • 13.2 Inclusions and exclusions checklist
                  • Exhibit 179: Inclusions checklist
                  • Exhibit 180: Exclusions checklist
                • 13.3 Currency conversion rates for US$
                  • Exhibit 181: Currency conversion rates for US$
                • 13.4 Research methodology
                  • Exhibit 182: Research methodology
                  • Exhibit 183: Validation techniques employed for market sizing
                  • Exhibit 184: Information sources
                • 13.5 List of abbreviations
                  • Exhibit 185: List of abbreviations

                Research Methodology

                Technavio presents a detailed picture of the market by way of study, synthesis, and summation of data from multiple sources. The analysts have presented the various facets of the market with a particular focus on identifying the key industry influencers. The data thus presented is comprehensive, reliable, and the result of extensive research, both primary and secondary.

                INFORMATION SOURCES

                Primary sources

                • Manufacturers and suppliers
                • Channel partners
                • Industry experts
                • Strategic decision makers

                Secondary sources

                • Industry journals and periodicals
                • Government data
                • Financial reports of key industry players
                • Historical data
                • Press releases

                DATA ANALYSIS

                Data Synthesis

                • Collation of data
                • Estimation of key figures
                • Analysis of derived insights

                Data Validation

                • Triangulation with data models
                • Reference against proprietary databases
                • Corroboration with industry experts

                REPORT WRITING

                Qualitative

                • Market drivers
                • Market challenges
                • Market trends
                • Five forces analysis

                Quantitative

                • Market size and forecast
                • Market segmentation
                • Geographical insights
                • Competitive landscape

                Interested in this report?

                Get your sample now to see our research methodology and insights!

                Download Now

                Frequently Asked Questions

                Automated Guided Vehicle (AGV) Software market growth will increase by $ 450.49 mn during 2024-2028.

                The Automated Guided Vehicle (AGV) Software market is expected to grow at a CAGR of 9.88% during 2024-2028.

                Automated Guided Vehicle (AGV) Software market is segmented by Type( In-built vehicle software, Integrated software) End-user( Distribution and logistics, Food and beverages, Automotive, Retail, Others)

                Alstef Group SAS, Balyo SA, Daifuku Co. Ltd, Danaher Corp., E80 GROUP SPA, Gotting KG, Honeywell International Inc., Hyster Yale Materials Handling Inc., John Bean Technologies Corp., KION GROUP AG, KMH Fleet Solutions, KUKA AG, Murata Machinery Ltd., Oceaneering International Inc., Scott Technology Ltd., Seegrid Corp., TALUMIS BV, TGW LOGISTICS GROUP GmbH, Toyota Industries Corp., SSI Schafer IT Solutions GmbH are a few of the key vendors in the Automated Guided Vehicle (AGV) Software market.

                APAC will register the highest growth rate of 39% among the other regions. Therefore, the Automated Guided Vehicle (AGV) Software market in APAC is expected to garner significant business opportunities for the vendors during the forecast period.

                US, China, Japan, Germany, UK

                • Growing e-commerce industryThe growing e-commerce industry is one of the major drivers for the widespread adoption of AGV software globally. With an increasing number of users looking to buy products online is the driving factor this market.
                • vendors need to expand their order processing capacities in warehouses and distribution centers. The number of warehouses and distribution centers has increased rapidly over the last few years. The global e-commerce industry has been recording an annual growth rate of more than 10%. China is the driving factor this market.
                • India is the driving factor this market.
                • the US is the driving factor this market.
                • the UK is the driving factor this market.
                • Germany is the driving factor this market.
                • France is the driving factor this market.
                • and Japan are the largest markets for e-commerce and are recording rapid growth. For instance is the driving factor this market.
                • the e-commerce industry in India is expected to grow at a CAGR of more than 20% during the forecast period. In the US is the driving factor this market.
                • the e-commerce industry is growing at a higher rate than the retail industry. The increasing vendor capacity to deliver items in the shortest possible time is the driving factor this market.
                • maintain accuracy in order processing to minimize product returns is the driving factor this market.
                • and offer services with low costs is driving the growth of the global automated guided vehicle software market. For instance is the driving factor this market.
                • Amazon.com (through Amazon Prime) offers its members free two-day shipping. Vendors are able to achieve this target by incorporating AGV software in their operations. The demand for AGVs and AGV software has increased because of the significant growth of the e-commerce industry. These factors will drive the growth of the global automated guided vehicle software market during the forecast period. is the driving factor this market.

                The Automated Guided Vehicle (AGV) Software market vendors should focus on grabbing business opportunities from the In-built vehicle software segment as it accounted for the largest market share in the base year.