Automotive Aftermarket E-retailing Market Analysis, Size, and Forecast 2026-2030: North America (US, Canada, and Mexico), Europe (Germany, UK, and France), APAC (China, India, and Japan), South America (Brazil and Argentina), Middle East and Africa (UAE, Saudi Arabia, and South Africa), and Rest of World (ROW)

Automotive Aftermarket E-retailing Market Analysis, Size, and Forecast 2026-2030:
North America (US, Canada, and Mexico), Europe (Germany, UK, and France), APAC (China, India, and Japan), South America (Brazil and Argentina), Middle East and Africa (UAE, Saudi Arabia, and South Africa), and Rest of World (ROW)

Published: Mar 2026 293 Pages SKU: IRTNTR40628

Market Overview at a Glance

$98.66 B
Market Opportunity
16.2%
CAGR 2025 - 2030
39.9%
North America Growth
$26.21 B
Wheels and tires segment 2024

Automotive Aftermarket E-retailing Market Size 2026-2030

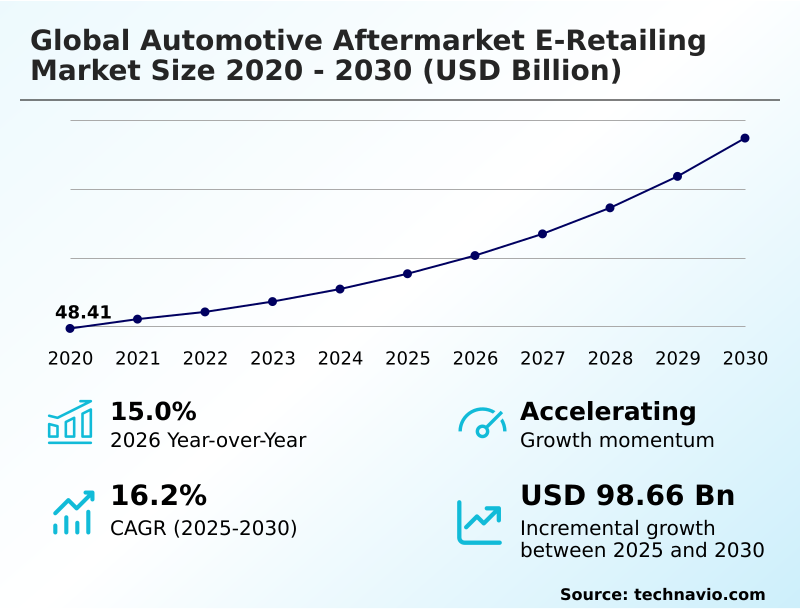
The automotive aftermarket e-retailing market size is valued to increase by USD 98.66 billion, at a CAGR of 16.2% from 2025 to 2030. Increasing average age of vehicles and extended ownership cycles will drive the automotive aftermarket e-retailing market.

Major Market Trends & Insights

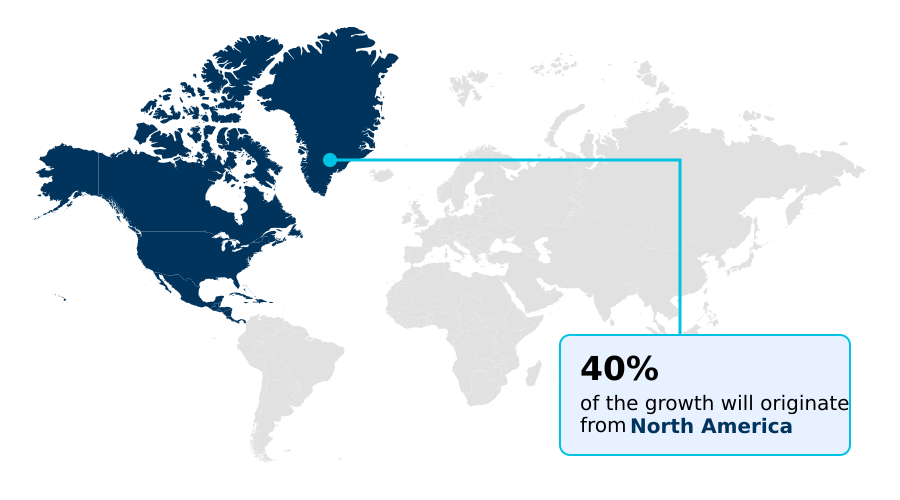
  • North America dominated the market and accounted for a 39.9% growth during the forecast period.
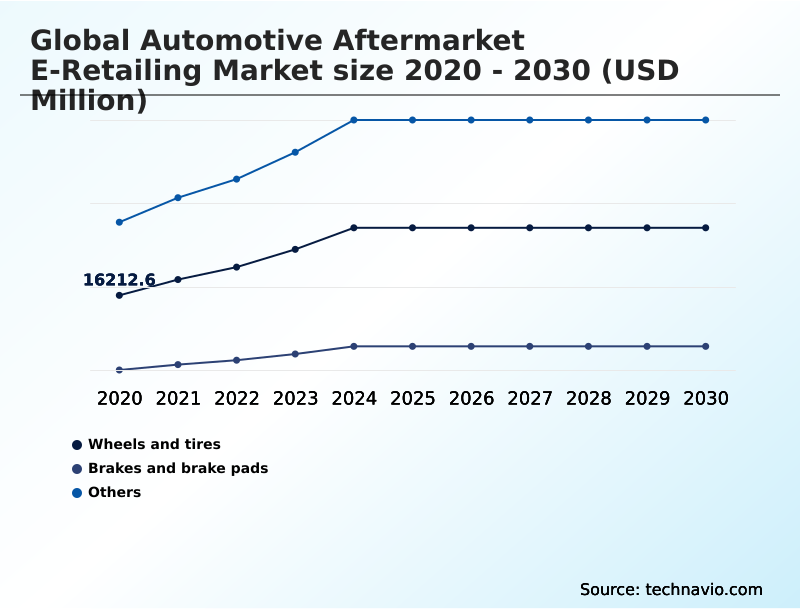
  • By Product - Wheels and tires segment was valued at USD 26.21 billion in 2024
  • By Customer Type - DIY customers segment accounted for the largest market revenue share in 2024

Market Size & Forecast

  • Market Opportunities: USD 138.44 billion
  • Market Future Opportunities: USD 98.66 billion
  • CAGR from 2025 to 2030 : 16.2%

Market Summary

  • The automotive aftermarket e-retailing market is undergoing a significant transformation, driven by shifts in consumer purchasing behavior and technological advancements. The migration from traditional channels to digital platforms is fueled by demands for convenience, price transparency, and extensive selection. This digital shift empowers both the do-it-yourself consumer and professional installers, who leverage online resources for informed decision-making.
  • Technology is a critical enabler, with innovations like VIN lookup tools, AI-powered diagnostic tool, and adherence to ACES and PIES standards improving part-to-vehicle compatibility and reducing transaction friction. For instance, a B2B procurement platform integrating a digital parts catalog management system allows independent garages to reduce part sourcing time by up to 40%, directly boosting technician productivity.
  • However, this evolution brings challenges, including intense competition that puts pressure on margins and the logistical complexities of managing reverse logistics costs. The proliferation of the electric vehicle aftermarket introduces new component categories, requiring specialized knowledge and supply chains to meet emerging demands effectively. This dynamic environment necessitates continuous investment in technology and operational efficiency.

What will be the Size of the Automotive Aftermarket E-retailing Market during the forecast period?

Get Key Insights on Market Forecast (PDF) Request Free Sample

How is the Automotive Aftermarket E-retailing Market Segmented?

The automotive aftermarket e-retailing industry research report provides comprehensive data (region-wise segment analysis), with forecasts and estimates in "USD million" for the period 2026-2030, as well as historical data from 2020-2024 for the following segments.

  • Product
    • Wheels and tires
    • Brakes and brake pads
    • Others
  • Customer type
    • DIY customers
    • Professional customers
  • Vehicle type
    • Passenger cars
    • Light commercial vehicles
    • Heavy commercial vehicles
  • Geography
    • North America
      • US
      • Canada
      • Mexico
    • Europe
      • Germany
      • UK
      • France
    • APAC
      • China
      • India
      • Japan
    • South America
      • Brazil
      • Argentina
    • Middle East and Africa
      • UAE
      • Saudi Arabia
      • South Africa
    • Rest of World (ROW)

By Product Insights

The wheels and tires segment is estimated to witness significant growth during the forecast period.

The wheels and tires segment constitutes a foundational, high-volume category within the automotive aftermarket e-retailing market. Growth is driven by non-discretionary replacement needs and consumer demand for vehicle personalization, which is addressed through an expansive online parts catalog.

Digital channels provide enhanced price transparency and product information, disrupting traditional purchasing funnels. A critical enabler is the ship-to-installer model, which resolves logistical challenges for consumers by delivering products directly to heavy-duty repair facilities or local garages.

Ensuring part-to-vehicle compatibility remains a key focus, as platforms using a fitment intelligence suite have demonstrated a 40% reduction in costly returns.

This focus on accurate parts compatibility check, supported by robust digital parts catalog management, is essential for maintaining customer trust and operational efficiency in online tire and wheel sales and for brake system components online.

Request Free Sample

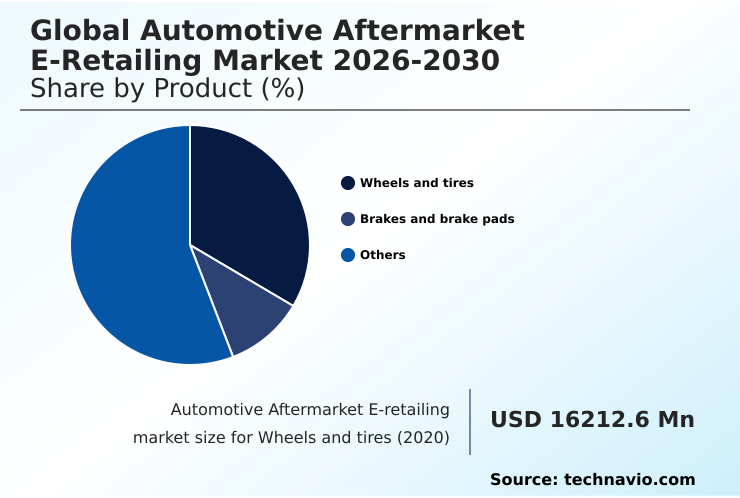
The Wheels and tires segment was valued at USD 26.21 billion in 2024 and showed a gradual increase during the forecast period.

Request Free Sample

Regional Analysis

North America is estimated to contribute 39.9% to the growth of the global market during the forecast period.Technavio’s analysts have elaborately explained the regional trends and drivers that shape the market during the forecast period.

See How Automotive Aftermarket E-retailing Market Demand is Rising in North America Request Free Sample

The market's geographic landscape is characterized by diverse maturity levels and growth drivers. North America leads, contributing nearly 39.9% of incremental growth, supported by a mature DIY culture and sophisticated B2B e-commerce solutions.

Here, the ship-to-installer business model is well-established for both light commercial vehicles and heavy commercial vehicles. In contrast, APAC is the fastest-growing region, where a mobile-first, DIFM-centric approach prevails, fostering innovative online-to-offline business model and B2B2C segments.

Europe's fragmented market is heavily influenced by regulatory pressures like right to repair legislation, which promotes competition and transparency.

The success of online parts marketplace platforms in emerging economies is increasingly tied to providing a professional installer network, catering to a customer base that prioritizes service over DIY.

This regional variation requires adaptable strategies, from offering high-performance accessories in affluent markets to ensuring parts availability through a robust automotive aftermarket supply chain globally.
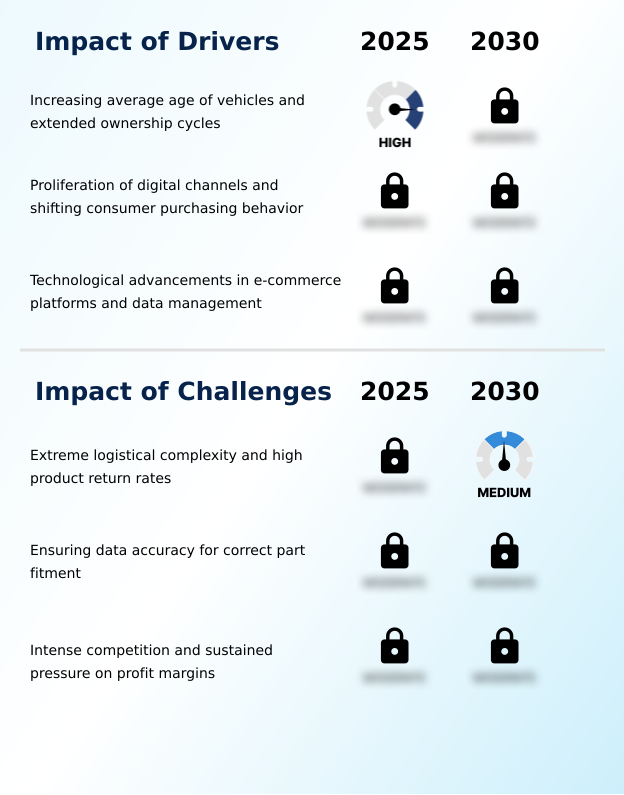
Market Dynamics

Our researchers analyzed the data with 2025 as the base year, along with the key drivers, trends, and challenges. A holistic analysis of drivers will help companies refine their marketing strategies to gain a competitive advantage.

  • The digital transformation of automotive repair is intensifying competition and margins in online parts sales, compelling companies to refine their go-to-market strategies. A successful omnichannel strategy for auto parts retailers is now essential, blending digital convenience with physical accessibility to enhance the overall customer experience in aftermarket e-retailing.
  • Central to this is the use of AI for accurate vehicle fitment, a critical tool for managing high return rates in e-retailing and ensuring data accuracy for correct part fitment. Platforms that guarantee part compatibility through advanced VIN lookup for guaranteed part compatibility report return rates up to 40% lower than competitors.
  • This technological focus extends to B2B e-commerce for professional installers, with a clear trend toward integrating e-retailing with service networks to create a seamless workflow. The future of EV parts in e-retailing is a significant growth frontier, demanding specialized e-retailing for electric vehicles as the parc evolves.
  • The underlying supply chain for online auto parts must adapt to handle both traditional components and new EV technologies. Furthermore, the role of marketplaces in auto e-retailing continues to expand, facilitating cross-border trade in aftermarket parts and driving the growth of private label parts online, which is increasingly influenced by mobile commerce for automotive aftermarket.
  • Predictive analytics for parts demand is becoming crucial for inventory management.

What are the key market drivers leading to the rise in the adoption of Automotive Aftermarket E-retailing Industry?

  • The increasing average age of vehicles and extended ownership cycles are key drivers for the market's growth.

  • Market expansion is propelled by technological enablement and evolving consumer habits. The broad adoption of aftermarket parts data standards, including ACES and PIES standards, alongside robust VIN lookup tools that use the vehicle identification number, has dramatically improved order accuracy.
  • E-commerce platform integration within omni-channel strategies allows traditional retailers to compete effectively in automotive digital retail, with some achieving a 20% lift in sales through unified online and in-store experiences.
  • The do-it-yourself consumer is better supported than ever with extensive DIY auto repair resources. For recurring purchases, the subscription model for parts is gaining traction, increasing customer retention by up to 18%.
  • This digital shift, facilitated by secure online payment gateways and the availability of remanufactured parts, makes the market more accessible and efficient for all participants.

What are the market trends shaping the Automotive Aftermarket E-retailing Industry?

  • The proliferation of AI-driven fitment and vehicle personalization platforms represents a significant upcoming market trend. These technologies are set to redefine the customer experience by ensuring accuracy and tailoring product recommendations.

  • Key trends are reshaping the market by enhancing precision and service integration. The deployment of an AI-powered diagnostic tool and predictive maintenance alerts is transforming reactive repairs into proactive service, with platforms reporting a 25% reduction in unplanned vehicle downtime for users.
  • These AI-driven parts recommendation systems, coupled with visual search technologies, improve customer fitment guarantee and enrich the user experience. The expansion of the electric vehicle aftermarket is creating a new ecosystem for EV-specific components and specialized diagnostic tools.
  • Simultaneously, the integration of do-it-for-me service networks directly into e-commerce platforms is capturing a new customer segment, boosting order values by an average of 40% when a service is bundled. The use of augmented reality applications for DIY assistance further reduces friction, empowering a wider consumer base with accessible automotive repair data.

What challenges does the Automotive Aftermarket E-retailing Industry face during its growth?

  • Extreme logistical complexity and high product return rates represent a key challenge affecting the industry's growth.

  • Significant operational challenges persist, primarily centered on logistics and intense competition. The complexity of the aftermarket logistics network makes supply chain optimization a continuous priority, as reverse logistics costs associated with high online auto parts return rates can erode profitability by over 15%. The necessity for rapid fulfillment drives investment in last-mile delivery solutions, yet this increases operational overhead.
  • Concurrently, intense price competition, amplified by the growth of private-label parts and the ease of cross-border e-commerce, puts constant pressure on margins. The customer acquisition cost in e-commerce continues to rise, making retention critical.
  • For B2B players, effective fleet maintenance procurement requires flawless execution in automotive e-commerce logistics to meet the stringent uptime demands of commercial clients, where any delay directly impacts revenue.

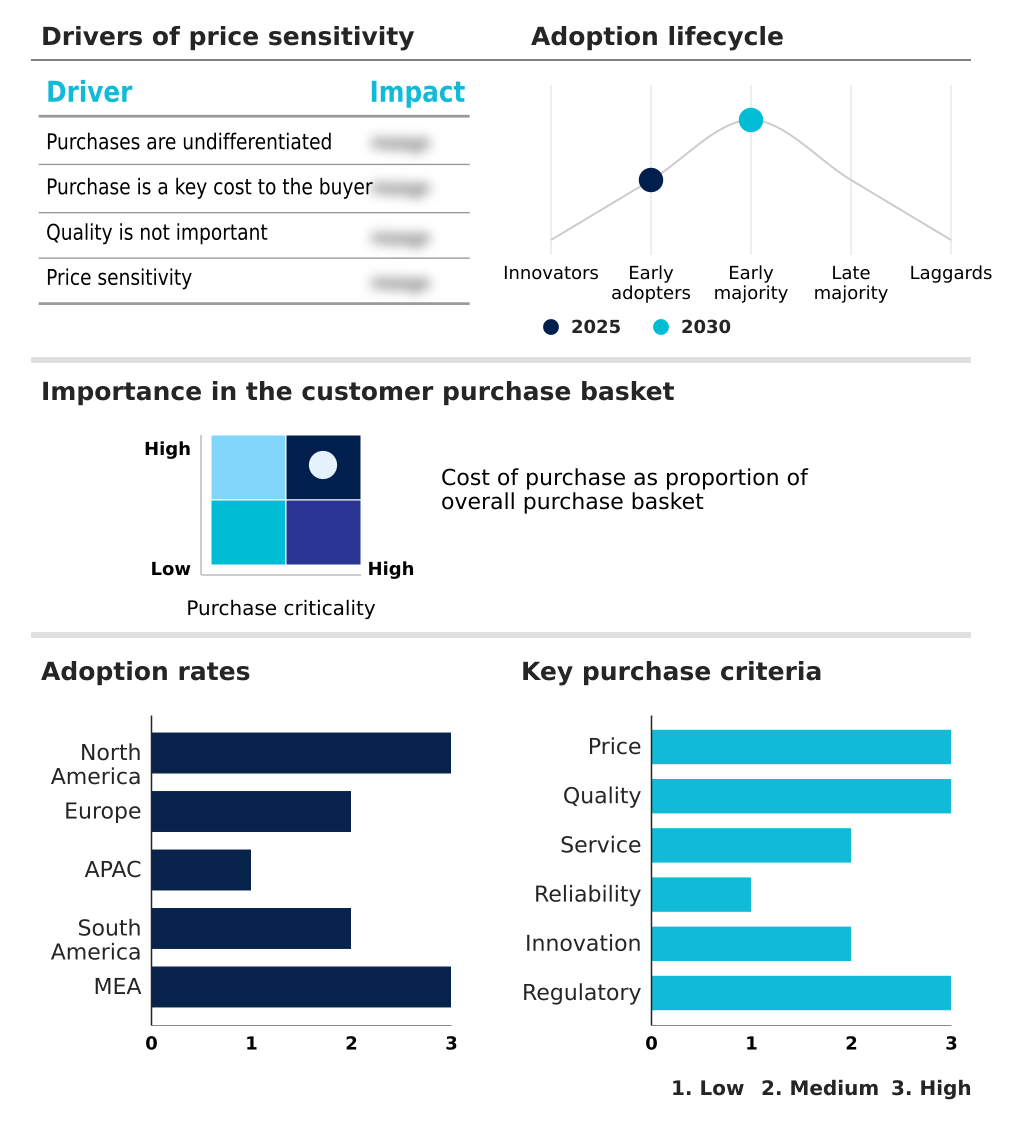
Exclusive Technavio Analysis on Customer Landscape

The automotive aftermarket e-retailing market forecasting report includes the adoption lifecycle of the market, covering from the innovator’s stage to the laggard’s stage. It focuses on adoption rates in different regions based on penetration. Furthermore, the automotive aftermarket e-retailing market report also includes key purchase criteria and drivers of price sensitivity to help companies evaluate and develop their market growth analysis strategies.

Customer Landscape of Automotive Aftermarket E-retailing Industry

Competitive Landscape

Companies are implementing various strategies, such as strategic alliances, automotive aftermarket e-retailing market forecast, partnerships, mergers and acquisitions, geographical expansion, and product/service launches, to enhance their presence in the industry.

1A Auto Inc. - Delivering broad vehicle coverage through an affordable and extensive catalog of both OEM and aftermarket components.

The industry research and growth report includes detailed analyses of the competitive landscape of the market and information about key companies, including:

  • 1A Auto Inc.
  • Advance Auto Parts Inc.
  • Amazon.com Inc.
  • AutoZone Inc.
  • Buy Auto Parts
  • CarParts.com Inc.
  • Delticom AG
  • DENSO Corp.
  • DHL International GmbH
  • eBay Inc.
  • Flipkart Internet Pvt. Ltd.
  • General Motors Co.
  • Genuine Parts Co.
  • Icahn Automotive Group LLC
  • ID Auto Inc.
  • Keystone Automotive Inc.
  • RockAuto LLC
  • Sana Commerce
  • Tekion Corp.
  • Tire Rack

Qualitative and quantitative analysis of companies has been conducted to help clients understand the wider business environment as well as the strengths and weaknesses of key industry players. Data is qualitatively analyzed to categorize companies as pure play, category-focused, industry-focused, and diversified; it is quantitatively analyzed to categorize companies as dominant, leading, strong, tentative, and weak.

Recent Development and News in Automotive aftermarket e-retailing market

  • In April 2025, Amazon.com expanded its automotive services by partnering with the Bosch Car Service network in Europe, enabling customers to bundle parts purchases with installation appointments.
  • In August 2024, a global e-commerce marketplace integrated a new AI-powered diagnostic tool, allowing users to input vehicle symptoms to receive probable causes and a curated list of necessary replacement parts.
  • In October 2024, a major international automotive data standards organization released a comprehensive update to its vehicle classification system to better accommodate electric vehicle configurations, requiring e-retailers to undertake significant data validation projects.
  • In May 2025, Daimler Truck AG enhanced its Service-Connect platform with a Predictive Parts module that uses AI to anticipate component failures and automatically pre-order replacement parts to the nearest service center.

Dive into Technavio’s robust research methodology, blending expert interviews, extensive data synthesis, and validated models for unparalleled Automotive Aftermarket E-retailing Market insights. See full methodology.

Market Scope
Page number 293
Base year 2025
Historic period 2020-2024
Forecast period 2026-2030
Growth momentum & CAGR Accelerate at a CAGR of 16.2%
Market growth 2026-2030 USD 98658.8 million
Market structure Fragmented
YoY growth 2025-2026(%) 15.0%
Key countries US, Canada, Mexico, Germany, UK, France, Italy, Spain, The Netherlands, China, India, Japan, South Korea, Australia, Indonesia, Brazil, Argentina, Chile, UAE, Saudi Arabia, South Africa, Turkey and Israel
Competitive landscape Leading Companies, Market Positioning of Companies, Competitive Strategies, and Industry Risks

Request Free Sample

Research Analyst Overview

  • The market's evolution is driven by the sophisticated integration of digital technologies to address longstanding industry challenges. Ensuring part-to-vehicle compatibility, a primary hurdle, is now being systematically addressed by deploying VIN lookup tools and adhering to ACES and PIES standards, managed through advanced B2B e-commerce solutions.
  • The rise of the electric vehicle aftermarket is compelling a strategic pivot, necessitating investment in specialized diagnostic tools and new supply chain optimization models, a decision now central to boardroom strategy. Omni-channel strategies are becoming the competitive baseline, combining digital procurement platforms with physical logistics like click-and-collect services.
  • This integration allows for a 35% improvement in inventory turnover for retailers leveraging predictive maintenance alerts. The market is bifurcated, serving the do-it-yourself consumer with visual search technologies and augmented reality applications, while supporting professional heavy-duty repair facilities with tools that guarantee a parts compatibility check.
  • From mobile mechanic services to the growth of remanufactured parts and private-label parts, technology is the core enabler.

What are the Key Data Covered in this Automotive Aftermarket E-retailing Market Research and Growth Report?

  • What is the expected growth of the Automotive Aftermarket E-retailing Market between 2026 and 2030?

    • USD 98.66 billion, at a CAGR of 16.2%

  • What segmentation does the market report cover?

    • The report is segmented by Product (Wheels and tires, Brakes and brake pads, and Others), Customer Type (DIY customers, and Professional customers), Vehicle Type (Passenger cars, Light commercial vehicles, and Heavy commercial vehicles) and Geography (North America, Europe, APAC, South America, Middle East and Africa)

  • Which regions are analyzed in the report?

    • North America, Europe, APAC, South America and Middle East and Africa

  • What are the key growth drivers and market challenges?

    • Increasing average age of vehicles and extended ownership cycles, Extreme logistical complexity and high product return rates

  • Who are the major players in the Automotive Aftermarket E-retailing Market?

    • 1A Auto Inc., Advance Auto Parts Inc., Amazon.com Inc., AutoZone Inc., Buy Auto Parts, CarParts.com Inc., Delticom AG, DENSO Corp., DHL International GmbH, eBay Inc., Flipkart Internet Pvt. Ltd., General Motors Co., Genuine Parts Co., Icahn Automotive Group LLC, ID Auto Inc., Keystone Automotive Inc., RockAuto LLC, Sana Commerce, Tekion Corp. and Tire Rack

Market Research Insights

  • The market is shaped by a fundamental shift in consumer behavior toward digital channels, with over half of vehicle owners now initiating parts searches online. This digital-first approach, supported by robust automotive repair data and advanced e-commerce platform integration, caters to both DIY enthusiasts and professional installers.
  • The use of a vehicle identification number for lookups has become standard, enhancing accuracy in digital parts catalog management. Innovations in AI-driven parts recommendation engines have improved order accuracy by up to 25%, significantly reducing returns. Concurrently, integrated B2B parts procurement platforms are streamlining operations for service centers, increasing technician productivity by over 15% by providing real-time inventory visibility.
  • This convergence of technology and consumer expectation drives the evolution of parts and accessories e-retailing.

We can help! Our analysts can customize this automotive aftermarket e-retailing market research report to meet your requirements.

Get in touch

1. Executive Summary

1.1 Market overview

Executive Summary - Chart on Market Overview
Executive Summary - Data Table on Market Overview
Executive Summary - Chart on Global Market Characteristics
Executive Summary - Chart on Market by Geography
Executive Summary - Chart on Market Segmentation by Product
Executive Summary - Chart on Market Segmentation by Customer Type
Executive Summary - Chart on Market Segmentation by Vehicle Type
Executive Summary - Chart on Incremental Growth
Executive Summary - Data Table on Incremental Growth
Executive Summary - Chart on Company Market Positioning

2. Technavio Analysis

2.1 Analysis of price sensitivity, lifecycle, customer purchase basket, adoption rates, and purchase criteria

2.2 Criticality of inputs and Factors of differentiation

Chart on Overview on criticality of inputs and factors of differentiation

2.3 Factors of disruption

Chart on Overview on factors of disruption

2.4 Impact of drivers and challenges

Chart on Impact of drivers and challenges in 2025 and 2030

3. Market Landscape

3.1 Market ecosystem

Chart on Parent Market
Data Table on - Parent Market

3.2 Market characteristics

Chart on Market characteristics analysis

3.3 Value chain analysis

Chart on Value chain analysis

4. Market Sizing

4.1 Market definition

Data Table on Offerings of companies included in the market definition

4.2 Market segment analysis

Market segments

4.3 Market size 2025

4.4 Market outlook: Forecast for 2025-2030

Chart on Global - Market size and forecast 2025-2030 ($ million)
Data Table on Global - Market size and forecast 2025-2030 ($ million)
Chart on Global Market: Year-over-year growth 2025-2030 (%)
Data Table on Global Market: Year-over-year growth 2025-2030 (%)

5. Historic Market Size

5.1 Global Automotive Aftermarket E-Retailing Market 2020 - 2024

Historic Market Size - Data Table on Global Automotive Aftermarket E-Retailing Market 2020 - 2024 ($ million)

5.2 Product segment analysis 2020 - 2024

Historic Market Size - Product Segment 2020 - 2024 ($ million)

5.3 Customer Type segment analysis 2020 - 2024

Historic Market Size - Customer Type Segment 2020 - 2024 ($ million)

5.4 Vehicle Type segment analysis 2020 - 2024

Historic Market Size - Vehicle Type Segment 2020 - 2024 ($ million)

5.5 Geography segment analysis 2020 - 2024

Historic Market Size - Geography Segment 2020 - 2024 ($ million)

5.6 Country segment analysis 2020 - 2024

Historic Market Size - Country Segment 2020 - 2024 ($ million)

6. Qualitative Analysis

6.1 Impact of AI in global automotive aftermarket e-retailing market

7. Five Forces Analysis

7.1 Five forces summary

Five forces analysis - Comparison between 2025 and 2030

7.2 Bargaining power of buyers

Bargaining power of buyers - Impact of key factors 2025 and 2030

7.3 Bargaining power of suppliers

Bargaining power of suppliers - Impact of key factors in 2025 and 2030

7.4 Threat of new entrants

Threat of new entrants - Impact of key factors in 2025 and 2030

7.5 Threat of substitutes

Threat of substitutes - Impact of key factors in 2025 and 2030

7.6 Threat of rivalry

Threat of rivalry - Impact of key factors in 2025 and 2030

7.7 Market condition

Chart on Market condition - Five forces 2025 and 2030

8. Market Segmentation by Product

8.1 Market segments

Chart on Product - Market share 2025-2030 (%)
Data Table on Product - Market share 2025-2030 (%)

8.2 Comparison by Product

Chart on Comparison by Product
Data Table on Comparison by Product

8.3 Wheels and tires - Market size and forecast 2025-2030

Chart on Wheels and tires - Market size and forecast 2025-2030 ($ million)
Data Table on Wheels and tires - Market size and forecast 2025-2030 ($ million)
Chart on Wheels and tires - Year-over-year growth 2025-2030 (%)
Data Table on Wheels and tires - Year-over-year growth 2025-2030 (%)

8.4 Brakes and brake pads - Market size and forecast 2025-2030

Chart on Brakes and brake pads - Market size and forecast 2025-2030 ($ million)
Data Table on Brakes and brake pads - Market size and forecast 2025-2030 ($ million)
Chart on Brakes and brake pads - Year-over-year growth 2025-2030 (%)
Data Table on Brakes and brake pads - Year-over-year growth 2025-2030 (%)

8.5 Others - Market size and forecast 2025-2030

Chart on Others - Market size and forecast 2025-2030 ($ million)
Data Table on Others - Market size and forecast 2025-2030 ($ million)
Chart on Others - Year-over-year growth 2025-2030 (%)
Data Table on Others - Year-over-year growth 2025-2030 (%)

8.6 Market opportunity by Product

Market opportunity by Product ($ million)
Data Table on Market opportunity by Product ($ million)

9. Market Segmentation by Customer Type

9.1 Market segments

Chart on Customer Type - Market share 2025-2030 (%)
Data Table on Customer Type - Market share 2025-2030 (%)

9.2 Comparison by Customer Type

Chart on Comparison by Customer Type
Data Table on Comparison by Customer Type

9.3 DIY customers - Market size and forecast 2025-2030

Chart on DIY customers - Market size and forecast 2025-2030 ($ million)
Data Table on DIY customers - Market size and forecast 2025-2030 ($ million)
Chart on DIY customers - Year-over-year growth 2025-2030 (%)
Data Table on DIY customers - Year-over-year growth 2025-2030 (%)

9.4 Professional customers - Market size and forecast 2025-2030

Chart on Professional customers - Market size and forecast 2025-2030 ($ million)
Data Table on Professional customers - Market size and forecast 2025-2030 ($ million)
Chart on Professional customers - Year-over-year growth 2025-2030 (%)
Data Table on Professional customers - Year-over-year growth 2025-2030 (%)

9.5 Market opportunity by Customer Type

Market opportunity by Customer Type ($ million)
Data Table on Market opportunity by Customer Type ($ million)

10. Market Segmentation by Vehicle Type

10.1 Market segments

Chart on Vehicle Type - Market share 2025-2030 (%)
Data Table on Vehicle Type - Market share 2025-2030 (%)

10.2 Comparison by Vehicle Type

Chart on Comparison by Vehicle Type
Data Table on Comparison by Vehicle Type

10.3 Passenger cars - Market size and forecast 2025-2030

Chart on Passenger cars - Market size and forecast 2025-2030 ($ million)
Data Table on Passenger cars - Market size and forecast 2025-2030 ($ million)
Chart on Passenger cars - Year-over-year growth 2025-2030 (%)
Data Table on Passenger cars - Year-over-year growth 2025-2030 (%)

10.4 Light commercial vehicles - Market size and forecast 2025-2030

Chart on Light commercial vehicles - Market size and forecast 2025-2030 ($ million)
Data Table on Light commercial vehicles - Market size and forecast 2025-2030 ($ million)
Chart on Light commercial vehicles - Year-over-year growth 2025-2030 (%)
Data Table on Light commercial vehicles - Year-over-year growth 2025-2030 (%)

10.5 Heavy commercial vehicles - Market size and forecast 2025-2030

Chart on Heavy commercial vehicles - Market size and forecast 2025-2030 ($ million)
Data Table on Heavy commercial vehicles - Market size and forecast 2025-2030 ($ million)
Chart on Heavy commercial vehicles - Year-over-year growth 2025-2030 (%)
Data Table on Heavy commercial vehicles - Year-over-year growth 2025-2030 (%)

10.6 Market opportunity by Vehicle Type

Market opportunity by Vehicle Type ($ million)
Data Table on Market opportunity by Vehicle Type ($ million)

11. Customer Landscape

11.1 Customer landscape overview

Analysis of price sensitivity, lifecycle, customer purchase basket, adoption rates, and purchase criteria

12. Geographic Landscape

12.1 Geographic segmentation

Chart on Market share by geography 2025-2030 (%)
Data Table on Market share by geography 2025-2030 (%)

12.2 Geographic comparison

Chart on Geographic comparison
Data Table on Geographic comparison

12.3 North America - Market size and forecast 2025-2030

Chart on North America - Market size and forecast 2025-2030 ($ million)
Data Table on North America - Market size and forecast 2025-2030 ($ million)
Chart on North America - Year-over-year growth 2025-2030 (%)
Data Table on North America - Year-over-year growth 2025-2030 (%)
Chart on Regional Comparison - North America
Data Table on Regional Comparison - North America

12.3.1 US - Market size and forecast 2025-2030

Chart on US - Market size and forecast 2025-2030 ($ million)
Data Table on US - Market size and forecast 2025-2030 ($ million)
Chart on US - Year-over-year growth 2025-2030 (%)
Data Table on US - Year-over-year growth 2025-2030 (%)

12.3.2 Canada - Market size and forecast 2025-2030

Chart on Canada - Market size and forecast 2025-2030 ($ million)
Data Table on Canada - Market size and forecast 2025-2030 ($ million)
Chart on Canada - Year-over-year growth 2025-2030 (%)
Data Table on Canada - Year-over-year growth 2025-2030 (%)

12.3.3 Mexico - Market size and forecast 2025-2030

Chart on Mexico - Market size and forecast 2025-2030 ($ million)
Data Table on Mexico - Market size and forecast 2025-2030 ($ million)
Chart on Mexico - Year-over-year growth 2025-2030 (%)
Data Table on Mexico - Year-over-year growth 2025-2030 (%)

12.4 Europe - Market size and forecast 2025-2030

Chart on Europe - Market size and forecast 2025-2030 ($ million)
Data Table on Europe - Market size and forecast 2025-2030 ($ million)
Chart on Europe - Year-over-year growth 2025-2030 (%)
Data Table on Europe - Year-over-year growth 2025-2030 (%)
Chart on Regional Comparison - Europe
Data Table on Regional Comparison - Europe

12.4.1 Germany - Market size and forecast 2025-2030

Chart on Germany - Market size and forecast 2025-2030 ($ million)
Data Table on Germany - Market size and forecast 2025-2030 ($ million)
Chart on Germany - Year-over-year growth 2025-2030 (%)
Data Table on Germany - Year-over-year growth 2025-2030 (%)

12.4.2 UK - Market size and forecast 2025-2030

Chart on UK - Market size and forecast 2025-2030 ($ million)
Data Table on UK - Market size and forecast 2025-2030 ($ million)
Chart on UK - Year-over-year growth 2025-2030 (%)
Data Table on UK - Year-over-year growth 2025-2030 (%)

12.4.3 France - Market size and forecast 2025-2030

Chart on France - Market size and forecast 2025-2030 ($ million)
Data Table on France - Market size and forecast 2025-2030 ($ million)
Chart on France - Year-over-year growth 2025-2030 (%)
Data Table on France - Year-over-year growth 2025-2030 (%)

12.4.4 Italy - Market size and forecast 2025-2030

Chart on Italy - Market size and forecast 2025-2030 ($ million)
Data Table on Italy - Market size and forecast 2025-2030 ($ million)
Chart on Italy - Year-over-year growth 2025-2030 (%)
Data Table on Italy - Year-over-year growth 2025-2030 (%)

12.4.5 Spain - Market size and forecast 2025-2030

Chart on Spain - Market size and forecast 2025-2030 ($ million)
Data Table on Spain - Market size and forecast 2025-2030 ($ million)
Chart on Spain - Year-over-year growth 2025-2030 (%)
Data Table on Spain - Year-over-year growth 2025-2030 (%)

12.4.6 The Netherlands - Market size and forecast 2025-2030

Chart on The Netherlands - Market size and forecast 2025-2030 ($ million)
Data Table on The Netherlands - Market size and forecast 2025-2030 ($ million)
Chart on The Netherlands - Year-over-year growth 2025-2030 (%)
Data Table on The Netherlands - Year-over-year growth 2025-2030 (%)

12.5 APAC - Market size and forecast 2025-2030

Chart on APAC - Market size and forecast 2025-2030 ($ million)
Data Table on APAC - Market size and forecast 2025-2030 ($ million)
Chart on APAC - Year-over-year growth 2025-2030 (%)
Data Table on APAC - Year-over-year growth 2025-2030 (%)
Chart on Regional Comparison - APAC
Data Table on Regional Comparison - APAC

12.5.1 China - Market size and forecast 2025-2030

Chart on China - Market size and forecast 2025-2030 ($ million)
Data Table on China - Market size and forecast 2025-2030 ($ million)
Chart on China - Year-over-year growth 2025-2030 (%)
Data Table on China - Year-over-year growth 2025-2030 (%)

12.5.2 India - Market size and forecast 2025-2030

Chart on India - Market size and forecast 2025-2030 ($ million)
Data Table on India - Market size and forecast 2025-2030 ($ million)
Chart on India - Year-over-year growth 2025-2030 (%)
Data Table on India - Year-over-year growth 2025-2030 (%)

12.5.3 Japan - Market size and forecast 2025-2030

Chart on Japan - Market size and forecast 2025-2030 ($ million)
Data Table on Japan - Market size and forecast 2025-2030 ($ million)
Chart on Japan - Year-over-year growth 2025-2030 (%)
Data Table on Japan - Year-over-year growth 2025-2030 (%)

12.5.4 South Korea - Market size and forecast 2025-2030

Chart on South Korea - Market size and forecast 2025-2030 ($ million)
Data Table on South Korea - Market size and forecast 2025-2030 ($ million)
Chart on South Korea - Year-over-year growth 2025-2030 (%)
Data Table on South Korea - Year-over-year growth 2025-2030 (%)

12.5.5 Australia - Market size and forecast 2025-2030

Chart on Australia - Market size and forecast 2025-2030 ($ million)
Data Table on Australia - Market size and forecast 2025-2030 ($ million)
Chart on Australia - Year-over-year growth 2025-2030 (%)
Data Table on Australia - Year-over-year growth 2025-2030 (%)

12.5.6 Indonesia - Market size and forecast 2025-2030

Chart on Indonesia - Market size and forecast 2025-2030 ($ million)
Data Table on Indonesia - Market size and forecast 2025-2030 ($ million)
Chart on Indonesia - Year-over-year growth 2025-2030 (%)
Data Table on Indonesia - Year-over-year growth 2025-2030 (%)

12.6 South America - Market size and forecast 2025-2030

Chart on South America - Market size and forecast 2025-2030 ($ million)
Data Table on South America - Market size and forecast 2025-2030 ($ million)
Chart on South America - Year-over-year growth 2025-2030 (%)
Data Table on South America - Year-over-year growth 2025-2030 (%)
Chart on Regional Comparison - South America
Data Table on Regional Comparison - South America

12.6.1 Brazil - Market size and forecast 2025-2030

Chart on Brazil - Market size and forecast 2025-2030 ($ million)
Data Table on Brazil - Market size and forecast 2025-2030 ($ million)
Chart on Brazil - Year-over-year growth 2025-2030 (%)
Data Table on Brazil - Year-over-year growth 2025-2030 (%)

12.6.2 Argentina - Market size and forecast 2025-2030

Chart on Argentina - Market size and forecast 2025-2030 ($ million)
Data Table on Argentina - Market size and forecast 2025-2030 ($ million)
Chart on Argentina - Year-over-year growth 2025-2030 (%)
Data Table on Argentina - Year-over-year growth 2025-2030 (%)

12.6.3 Chile - Market size and forecast 2025-2030

Chart on Chile - Market size and forecast 2025-2030 ($ million)
Data Table on Chile - Market size and forecast 2025-2030 ($ million)
Chart on Chile - Year-over-year growth 2025-2030 (%)
Data Table on Chile - Year-over-year growth 2025-2030 (%)

12.7 Middle East and Africa - Market size and forecast 2025-2030

Chart on Middle East and Africa - Market size and forecast 2025-2030 ($ million)
Data Table on Middle East and Africa - Market size and forecast 2025-2030 ($ million)
Chart on Middle East and Africa - Year-over-year growth 2025-2030 (%)
Data Table on Middle East and Africa - Year-over-year growth 2025-2030 (%)
Chart on Regional Comparison - Middle East and Africa
Data Table on Regional Comparison - Middle East and Africa

12.7.1 UAE - Market size and forecast 2025-2030

Chart on UAE - Market size and forecast 2025-2030 ($ million)
Data Table on UAE - Market size and forecast 2025-2030 ($ million)
Chart on UAE - Year-over-year growth 2025-2030 (%)
Data Table on UAE - Year-over-year growth 2025-2030 (%)

12.7.2 Saudi Arabia - Market size and forecast 2025-2030

Chart on Saudi Arabia - Market size and forecast 2025-2030 ($ million)
Data Table on Saudi Arabia - Market size and forecast 2025-2030 ($ million)
Chart on Saudi Arabia - Year-over-year growth 2025-2030 (%)
Data Table on Saudi Arabia - Year-over-year growth 2025-2030 (%)

12.7.3 South Africa - Market size and forecast 2025-2030

Chart on South Africa - Market size and forecast 2025-2030 ($ million)
Data Table on South Africa - Market size and forecast 2025-2030 ($ million)
Chart on South Africa - Year-over-year growth 2025-2030 (%)
Data Table on South Africa - Year-over-year growth 2025-2030 (%)

12.7.4 Turkey - Market size and forecast 2025-2030

Chart on Turkey - Market size and forecast 2025-2030 ($ million)
Data Table on Turkey - Market size and forecast 2025-2030 ($ million)
Chart on Turkey - Year-over-year growth 2025-2030 (%)
Data Table on Turkey - Year-over-year growth 2025-2030 (%)

12.7.5 Israel - Market size and forecast 2025-2030

Chart on Israel - Market size and forecast 2025-2030 ($ million)
Data Table on Israel - Market size and forecast 2025-2030 ($ million)
Chart on Israel - Year-over-year growth 2025-2030 (%)
Data Table on Israel - Year-over-year growth 2025-2030 (%)

12.8 Market opportunity by geography

Market opportunity by geography ($ million)
Data Tables on Market opportunity by geography ($ million)

13. Drivers, Challenges, and Opportunity

13.1 Market drivers

Increasing average age of vehicles and extended ownership cycles
Proliferation of digital channels and shifting consumer purchasing behavior
Technological advancements in e-commerce platforms and data management

13.2 Market challenges

Extreme logistical complexity and high product return rates
Ensuring data accuracy for correct part fitment
Intense competition and sustained pressure on profit margins

13.3 Impact of drivers and challenges

Impact of drivers and challenges in 2025 and 2030

13.4 Market opportunities

Proliferation of AI-driven fitment and vehicle personalization platforms
Seamless integration of e-retailing with do-it-for-me service networks
Emergence of specialized e-retailing for electric vehicle aftermarket

14. Competitive Landscape

14.1 Overview

14.2

Overview on criticality of inputs and factors of differentiation

14.3 Landscape disruption

Overview on factors of disruption

14.4 Industry risks

Impact of key risks on business

15. Competitive Analysis

15.1 Companies profiled

Companies covered

15.2 Company ranking index

15.3 Market positioning of companies

Matrix on companies position and classification

15.4 1A Auto Inc.

1A Auto Inc. - Overview
1A Auto Inc. - Product / Service
1A Auto Inc. - Key offerings
SWOT

15.5 Amazon.com Inc.

Amazon.com Inc. - Overview
Amazon.com Inc. - Business segments
Amazon.com Inc. - Key news
Amazon.com Inc. - Key offerings
Amazon.com Inc. - Segment focus
SWOT

15.6 AutoZone Inc.

AutoZone Inc. - Overview
AutoZone Inc. - Product / Service
AutoZone Inc. - Key offerings
SWOT

15.7 Buy Auto Parts

Buy Auto Parts - Overview
Buy Auto Parts - Product / Service
Buy Auto Parts - Key offerings
SWOT

15.8 CarParts.com Inc.

CarParts.com Inc. - Overview
CarParts.com Inc. - Product / Service
CarParts.com Inc. - Key offerings
SWOT

15.9 DENSO Corp.

DENSO Corp. - Overview
DENSO Corp. - Business segments
DENSO Corp. - Key news
DENSO Corp. - Key offerings
DENSO Corp. - Segment focus
SWOT

15.10 DHL International GmbH

DHL International GmbH - Overview
DHL International GmbH - Business segments
DHL International GmbH - Key news
DHL International GmbH - Key offerings
DHL International GmbH - Segment focus
SWOT

15.11 eBay Inc.

eBay Inc. - Overview
eBay Inc. - Product / Service
eBay Inc. - Key offerings
SWOT

15.12 Flipkart Internet Pvt. Ltd.

Flipkart Internet Pvt. Ltd. - Overview
Flipkart Internet Pvt. Ltd. - Product / Service
Flipkart Internet Pvt. Ltd. - Key offerings
SWOT

15.13 General Motors Co.

General Motors Co. - Overview
General Motors Co. - Business segments
General Motors Co. - Key news
General Motors Co. - Key offerings
General Motors Co. - Segment focus
SWOT

15.14 Genuine Parts Co.

Genuine Parts Co. - Overview
Genuine Parts Co. - Business segments
Genuine Parts Co. - Key offerings
Genuine Parts Co. - Segment focus
SWOT

15.15 Icahn Automotive Group LLC

Icahn Automotive Group LLC - Overview
Icahn Automotive Group LLC - Product / Service
Icahn Automotive Group LLC - Key offerings
SWOT

15.16 RockAuto LLC

RockAuto LLC - Overview
RockAuto LLC - Product / Service
RockAuto LLC - Key offerings
SWOT

15.17 Sana Commerce

Sana Commerce - Overview
Sana Commerce - Product / Service
Sana Commerce - Key offerings
SWOT

15.18 Tekion Corp.

Tekion Corp. - Overview
Tekion Corp. - Product / Service
Tekion Corp. - Key offerings
SWOT

16. Appendix

16.1 Scope of the report

Market definition
Objectives
Notes and caveats

16.2 Inclusions and exclusions checklist

Inclusions checklist
Exclusions checklist

16.3 Currency conversion rates for US$

16.4 Research methodology

16.5 Data procurement

Information sources

16.6 Data validation

16.7 Validation techniques employed for market sizing

16.8 Data synthesis

16.9 360 degree market analysis

16.10 List of abbreviations

Research Methodology

Technavio presents a detailed picture of the market by way of study, synthesis, and summation of data from multiple sources. The analysts have presented the various facets of the market with a particular focus on identifying the key industry influencers. The data thus presented is comprehensive, reliable, and the result of extensive research, both primary and secondary.

INFORMATION SOURCES

Primary sources

  • Manufacturers and suppliers
  • Channel partners
  • Industry experts
  • Strategic decision makers

Secondary sources

  • Industry journals and periodicals
  • Government data
  • Financial reports of key industry players
  • Historical data
  • Press releases

DATA ANALYSIS

Data Synthesis

  • Collation of data
  • Estimation of key figures
  • Analysis of derived insights

Data Validation

  • Triangulation with data models
  • Reference against proprietary databases
  • Corroboration with industry experts

REPORT WRITING

Qualitative

  • Market drivers
  • Market challenges
  • Market trends
  • Five forces analysis

Quantitative

  • Market size and forecast
  • Market segmentation
  • Geographical insights
  • Competitive landscape

Interested in this report?

Get your sample now to see our research methodology and insights!

Download Now

Frequently Asked Questions

Automotive Aftermarket E-retailing market growth will increase by USD 98658.8 million during 2026-2030.

The Automotive Aftermarket E-retailing market is expected to grow at a CAGR of 16.2% during 2026-2030.

Automotive Aftermarket E-retailing market is segmented by Product (Wheels and tires, Brakes and brake pads, Others) Customer type (DIY customers, Professional customers) Vehicle type (Passenger cars, Light commercial vehicles, Heavy commercial vehicles)

1A Auto Inc., Advance Auto Parts Inc., Amazon.com Inc., AutoZone Inc., Buy Auto Parts, CarParts.com Inc., Delticom AG, DENSO Corp., DHL International GmbH, eBay Inc., Flipkart Internet Pvt. Ltd., General Motors Co., Genuine Parts Co., Icahn Automotive Group LLC, ID Auto Inc., Keystone Automotive Inc., RockAuto LLC, Sana Commerce, Tekion Corp., Tire Rack are a few of the key vendors in the Automotive Aftermarket E-retailing market.

North America will register the highest growth rate of 39.9% among the other regions. Therefore, the Automotive Aftermarket E-retailing market in North America is expected to garner significant business opportunities for the vendors during the forecast period.

US, Canada, Mexico, Germany, UK, France, Italy, Spain, The Netherlands, China, India, Japan, South Korea, Australia, Indonesia, Brazil, Argentina, Chile, UAE, Saudi Arabia, South Africa, Turkey, Israel

  • Increasing average age of vehicles and extended ownership cycles is the driving factor this market.

The Automotive Aftermarket E-retailing market vendors should focus on grabbing business opportunities from the Product segment as it accounted for the largest market share in the base year.
RIA - Research AI Assistant
Ask RIA