Automotive Cabin Air Quality Sensor Market Analysis APAC, Europe, North America, South America, Middle East and Africa - China, US, Japan, India, Germany - Size and Forecast 2024-2028

Automotive Cabin Air Quality Sensor Market Analysis APAC, Europe, North America, South America, Middle East and Africa - China, US, Japan, India, Germany - Size and Forecast 2024-2028

Published: Aug 2024 178 Pages SKU: IRTNTR44252

Market Overview at a Glance

$370.6 Mn
Market Opportunity
12.27%
CAGR
10.59
YoY growth 2023-2024(%)

Global Automotive Cabin Air Quality Sensor Market 2024-2028

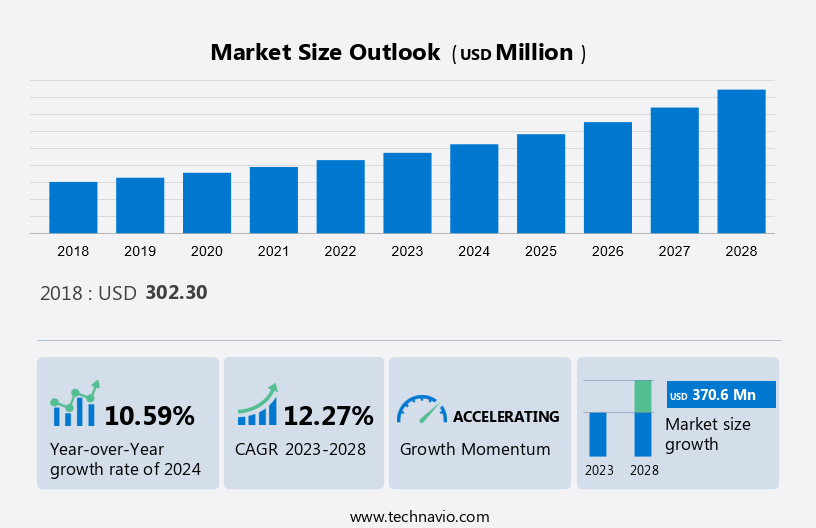
The Global Automotive Cabin Air Quality Sensor Market size is forecast to increase by USD 370.6 million at a CAGR of 12.27% between 2023 and 2028. The Global Automotive Cabin Air Quality Sensor Market is shaped by various factors. Heightened awareness regarding the detrimental impacts of air pollution drives the demand of these sensors in vehicles. Additionally, the integration of advanced air quality systems (AQS) enhances indoor air quality, spurring market growth. Moreover, the shift in production to low-cost countries fuels their adoption in automotive manufacturing, reflecting the market's global reach and adaptability to industry trends. This market research and growth report also includes an in-depth analysis of drivers, trends, and challenges. Furthermore, the report includes historic market data from 2018 to 2022.

What will be the Size of the Automotive Cabin Air Quality Sensor Market During the Forecast Period?

Automotive Cabin Air Quality Sensor Market Size

To learn more about this report, View Report Sample

Market Segmentation

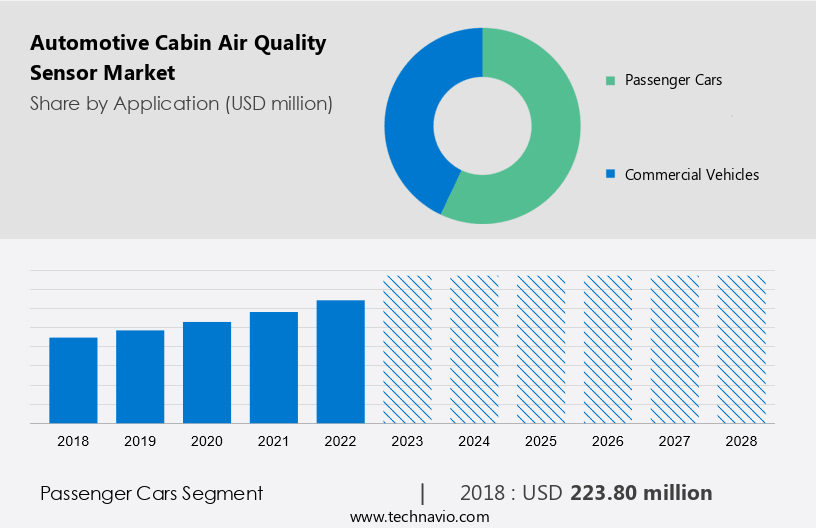
The passenger cars segment is estimated to witness significant growth during the forecast period.  There is an increasing focus by passenger car manufacturers on expanding their product portfolios by launching new variants.. For example,  in March 2020, Hyundai Motor Co. (Hyundai Motor) launched the new version of its SUV, Creta, in India, which features an in-built smart air purification system.  There is an increasing focus by several market players to increase their sales by opening new outlets.

Automotive Cabin Air Quality Sensor Market Size

Get a glance at the market contribution of various segments View the PDF Sample

The passenger cars segment was the largest segment and was valued at USD 223.8 million in 2018. There is a rising penetration of EVs in the passenger car segment. Some of the main factors that are driving the penetration of EVs include the benefits provided by the government (in terms of tax exemption and subsidies for OEMs as well as consumers), the initiatives being taken to reduce the emissions of greenhouse gases, stringent carbon emission norms, increased participation of foreign as well as regional players. As a result, it increased the preference for EVs among consumers. As a result, it will significantly contribute to the growth of the market as these vehicles have high electronic content, and cabin AQS will be an integral component to ensure efficient indoor air quality inside the vehicle cabin. Hence, such factors are expected to fuel the growth of this segment which in turn will drive the market growth during the forecast period.

Key Regions

Automotive Cabin Air Quality Sensor Market Share by Geography

For more insights on the market share of various regions Download PDF Sample now!

APAC is estimated to contribute 45% to the growth of the global market during the forecast period. Technavio's analysts have elaborately explained the regional trends and drivers that shape the market during the forecast period. One of the main countries in APAC that is significantly contributing to the market growth in APAC is China due to the high adoption of luxury cars in the region.

Moreover, the main factors that are fuelling the demand for luxury cars in APAC are the increasing income levels and the expansion of the middle class in emerging economies, such as India and Indonesia. Furthermore, there is significant competition among the automotive OEMs that manufacture passenger cars in the region which is positively impacting the market growth in the region. Hence, such factors are driving the market growth in APAC during the forecast period.

Market Dynamics and Customer Landscape

The market is a significant industry that focuses on providing solutions for ensuring good air quality within the vehicle's cabin. With increasing concerns over air pollution and poor air quality, the demand for effective cabin air quality sensors is on the rise. These sensors help detect and measure pollutants such as carbon monoxide, hydrogen, volatile organic substances, and fine particles, including air particulate matter. Cars, especially those with internal combustion engines, contribute to vehicular emissions, which can negatively impact cabin air quality. Electric vehicles and autonomous vehicles also face challenges related to battery emissions and air filtration system efficiency. The market for automotive cabin air quality sensors is driven by factors like increasing awareness of health risks associated with poor air quality, stringent regulations, and the growing demand for energy efficiency in air conditioning systems. Key players in this market include Tier 1 automotive suppliers, and the market is expected to grow significantly due to the increasing production of automobiles and the need to address pollutant concentrations in the cabin. The market is segmented based on air quality sensors, air filtration systems, air conditioning systems, and vehicle types. Pressure sensors, temperature sensors, and airflow sensors are essential components of cabin air quality sensors, while obstruction and energy efficiency are critical factors influencing the market's growth. Cloud-based solutions are also gaining popularity in the automotive production sector.

Key Market Driver

One of the key factors driving the market growth is the AQS aiding in improving indoor air quality, particularly with AQS systems aiding in enhancing indoor air quality. The primary function of the AQS lies in regulating the quality of internal air within an automotive cabin, contributing significantly to the reduction of in-car emissions. Traffic congestion stands out as one of the major sources of air pollution, alongside emissions from private households and industries. Passenger cars, in particular, are susceptible to varying levels of pollution, underscoring the increasing adoption of indoor air quality solutions (IAQS) aimed at purifying the air within automotive cabins. These advancements in technology cater to addressing health impacts associated with air pollution, such as asthma and cancer, by monitoring and mitigating harmful pollutants like carbon monoxide, unburned hydrocarbons, volatile organic compounds (VOCs), ozone, and particulate emissions.

Integral to the AQS system is its integration with the vehicle air conditioning system, controlling interior temperature and recirculation flap position, and regulating fan speed to optimize air quality. Leveraging MEMS-based sensor solutions and neural network-trained firmware, AQS systems are equipped to detect and analyze pollutant levels, humidity, and temperature in real time. Cloud-based technology further enhances AQS capabilities by providing access to real-time and predicted data, facilitating informed decision-making. This integration of artificial intelligence with AQS systems not only ensures optimal quality but also supports the development of electric vehicles (EVs) and autonomous vehicles (AVs) equipped with advanced HVAC systems. As such, the automotive cabin AQS market is poised for substantial growth during the forecast period, driven by the continuous advancement in technology and the increasing demand for healthier automotive cabin environments.

Significant Market Trends

A key factor shaping the market growth is the growing adoption of multi-functional car air purifiers. There is a growing trend in the market to develop multi-functional, compact, and simple user interface products to enhance the quality and designs of cars. In addition, several market players are providing multi-functional car air purifiers consisting of an air conditioner to cool, a fan to circulate air, a dehumidifier to remove moisture, and purifiers for the removal of contaminants from the cabin air.

Moreover, there is an increasing investment by some of the prominent market players in order to come up with more augmented products that freshen the air with desirable fragrances. In addition, multi-functional car purifiers are also being provided by players. Hence, such factors are expected to positively impact the market. Therefore, it is expected to fuel the market growth during the forecast period.

Major Market Challenge

The high cost of HVAC systems is one of the key challenges hindering the market growth. The high cost of  HVAC systems significantly influences the increased cost associated with AQS. The main purpose of the HVAC system is that it helps to reduce humidity and ventilation. In addition, they help to maintain controlled temperatures inside automotive cabins.

However, there is a significant cost associated with the HVAC systems despite the various functionalities. Some of the key costs include installation, product cost as well as the cost associated with HVAC compressor replacements. Hence, such factors are negatively impacting the market. therefore, it is expected to hinder the market growth during the market forecast period.

Customer Landscape

The market research report includes the adoption lifecycle of the market, covering from the innovator's stage to the laggard's stage. It focuses on adoption rates in different regions based on penetration. Furthermore, the report also includes key purchase criteria and drivers of price sensitivity to help companies evaluate and develop their growth strategies.

Automotive Cabin Air Quality Sensor Market Share by Geography

Global Automotive Cabin Air-Quality Sensor Market Customer Landscape

Who are the Major Market Companies?

Companies are implementing various strategies, such as strategic alliances, partnerships, mergers and acquisitions, geographical expansion, and product/service launches, to enhance their presence in the market.

Amphenol Corp: The company offers automotive cabin air-quality sensor products such as air quality sensor solutions which provide a range of of applications, such as offices, classrooms, and residential properties.

The research report also includes detailed analyses of the competitive landscape of the market and information about 20 market companies, including:

  • ams OSRAM AG
  • Asahi Kasei Corp.
  • Axetris AG
  • Faurecia SE
  • Hanon Systems
  • Honeywell International Inc.
  • NEW COSMOS ELECTRIC Co. Ltd.
  • Nissha Co. Ltd.
  • OMRON Corp.
  • Origins Technology Ltd.
  • Panasonic Holdings Corp.
  • paragon GmbH and Co. KGaA
  • Prana Air
  • Prodrive Technologies BV
  • Sensata Technologies Inc.
  • Sensirion AG
  • Standard Motor Products Inc.
  • UST Umweltsensortechnik GmbH
  • Valeo SA

Qualitative and quantitative analysis of companies has been conducted to help clients understand the wider business environment as well as the strengths and weaknesses of key market players. Data is qualitatively analyzed to categorize companies as pure play, category-focused, industry-focused, and diversified; it is quantitatively analyzed to categorize companies as dominant, leading, strong, tentative, and weak.

Segment Overview

The market report provides comprehensive data (region wise segment analysis), with forecasts and estimates in "USD Million" for the period 2024 to 2028, as well as historical data from 2018 to 2022 for the following segments

  • Application Outlook 
    • Passenger cars
    • Commercial vehicles
  • End-user Outlook
    • OEM
    • Aftermarket
  • Geography Outlook 
    • North America
      • The U.S.
      • Canada
    • Europe
      • The U.K.
      • Germany
      • France
      • Rest of Europe
    • APAC
      • China
      • India
    • South America
      • Chile
      • Argentina
      • Brazil
    • Middle East & Africa
      • Saudi Arabia
      • South Africa
      • Rest of the Middle East & Africa

Market Analyst Overview

The market is gaining significant attention due to the increasing concern for Air pollution and Poor air quality. Cars are a major contributor to this issue as Vehicle emissions, including Carbon monoxide, Hydrogen, Pollutants, and Ultrafine gases, pose health risks to Vehicle occupants. Electric vehicles (EVs) and Autonomous vehicles (AVs) are the future of transportation, but they too face challenges related to cabin air quality. HVAC systems play a crucial role in maintaining good air quality in vehicles. However, Energy consumption is a concern, leading to the development of Aftermarket sensors and advanced technologies like Artificial intelligence and Machine learning. Passenger well-being is a priority for OEMs, leading to the integration of advanced filter technology, Selective catalytic reduction, Exhaust gas circulation, and other pollution targets. These advancements offer Health benefits, ensuring the safety and comfort of vehicle occupants. The Automotive Cabin Air Quality Sensor market is expected to grow significantly due to the increasing focus on passenger safety and the need to comply with pollution regulations. The Supply chain network, Warranties, and After-sales support are also crucial factors driving market growth.

Industry  Scope

Report Coverage

Details

Page number

178

Base year

2023

Historic period

2018 - 2022

Forecast period

2024-2028

Growth momentum & CAGR

Accelerate at a CAGR of 12.27%

Market growth 2024-2028

USD 370.6 million

Market structure

Fragmented

YoY growth 2023-2024(%)

10.59

Regional analysis

APAC, Europe, North America, South America, and Middle East and Africa

Performing market contribution

APAC at 45%

Key countries

China, US, Japan, India, and Germany

Competitive landscape

Leading Companies, Market Positioning of Companies, Competitive Strategies, and Industry Risks

Key companies profiled

Amphenol Corp., ams OSRAM AG, Asahi Kasei Corp., Axetris AG, Faurecia SE, Hanon Systems, Honeywell International Inc., NEW COSMOS ELECTRIC Co. Ltd., Nissha Co. Ltd., OMRON Corp., Origins Technology Ltd., Panasonic Holdings Corp., paragon GmbH and Co. KGaA, Prana Air, Prodrive Technologies BV, Sensata Technologies Inc., Sensirion AG, Standard Motor Products Inc., UST Umweltsensortechnik GmbH, and Valeo SA

Market dynamics

Parent market analysis, Market growth inducers and obstacles, Fast-growing and slow-growing segment analysis, Market growth and Forecasting, COVID 19 impact and recovery analysis and future consumer dynamics, Market condition analysis for forecast period

Customization purview

If our report has not included the data that you are looking for, you can reach out to our analysts and get segments customized.

View PDF Sample

What are the Key Data Covered in this Market Research Report?

  • CAGR of the market during the forecast period
  • Detailed information on factors that will drive the market growth and forecasting between 2023 and 2027
  • Precise estimation of the market  size and its contribution to the market in focus on the parent market
  • Accurate predictions about upcoming trends and changes in consumer behavior
  • Market growth analysis across APAC, Europe, North America, South America, and the Middle East and Africa
  • A thorough analysis of the market's competitive landscape and detailed information about companies
  • Market forecasting of factors that will challenge the growth of market companies

We can help! Our analysts can customize this market research report to meet your requirements. 

Get in touch

1 Executive Summary

  • 1.1 Market overview
    • Executive Summary - Chart on Market Overview
    • Executive Summary - Data Table on Market Overview
    • Executive Summary - Chart on Global Market Characteristics
    • Executive Summary - Chart on Market by Geography
    • Executive Summary - Chart on Market Segmentation by Application
    • Executive Summary - Chart on Market Segmentation by End-user
    • Executive Summary - Chart on Incremental Growth
    • Executive Summary - Data Table on Incremental Growth
    • Executive Summary - Chart on Company Market Positioning

2 Market Landscape

  • 2.1 Market ecosystem
    • Parent Market
    • Data Table on - Parent Market
  • 2.2 Market characteristics
    • Market characteristics analysis
  • 2.3 Value chain analysis
    • Value Chain Analysis

3 Market Sizing

  • 3.1 Market definition
    • Offerings of companies included in the market definition
  • 3.2 Market segment analysis
    • Market segments
  • 3.3 Market size 2023
    • 3.4 Market outlook: Forecast for 2023-2028
      • Chart on Global - Market size and forecast 2023-2028 ($ million)
      • Data Table on Global - Market size and forecast 2023-2028 ($ million)
      • Chart on Global Market: Year-over-year growth 2023-2028 (%)
      • Data Table on Global Market: Year-over-year growth 2023-2028 (%)

    4 Historic Market Size

    • 4.1 Global Automotive Cabin Air Quality Sensor Market 2018 - 2022
      • Historic Market Size - Data Table on Global Automotive Cabin Air Quality Sensor Market 2018 - 2022 ($ million)
    • 4.2 Application segment analysis 2018 - 2022
      • Historic Market Size - Application Segment 2018 - 2022 ($ million)
    • 4.3 End-user segment analysis 2018 - 2022
      • Historic Market Size - End-user Segment 2018 - 2022 ($ million)
    • 4.4 Geography segment analysis 2018 - 2022
      • Historic Market Size - Geography Segment 2018 - 2022 ($ million)
    • 4.5 Country segment analysis 2018 - 2022
      • Historic Market Size - Country Segment 2018 - 2022 ($ million)

    5 Five Forces Analysis

    • 5.1 Five forces summary
      • Five forces analysis - Comparison between 2023 and 2028
    • 5.2 Bargaining power of buyers
      • Bargaining power of buyers - Impact of key factors 2023 and 2028
    • 5.3 Bargaining power of suppliers
      • Bargaining power of suppliers - Impact of key factors in 2023 and 2028
    • 5.4 Threat of new entrants
      • Threat of new entrants - Impact of key factors in 2023 and 2028
    • 5.5 Threat of substitutes
      • Threat of substitutes - Impact of key factors in 2023 and 2028
    • 5.6 Threat of rivalry
      • Threat of rivalry - Impact of key factors in 2023 and 2028
    • 5.7 Market condition
      • Chart on Market condition - Five forces 2023 and 2028

    6 Market Segmentation by Application

    • 6.1 Market segments
      • Chart on Application - Market share 2023-2028 (%)
      • Data Table on Application - Market share 2023-2028 (%)
    • 6.2 Comparison by Application
      • Chart on Comparison by Application
      • Data Table on Comparison by Application
    • 6.3 Passenger cars - Market size and forecast 2023-2028
      • Chart on Passenger cars - Market size and forecast 2023-2028 ($ million)
      • Data Table on Passenger cars - Market size and forecast 2023-2028 ($ million)
      • Chart on Passenger cars - Year-over-year growth 2023-2028 (%)
      • Data Table on Passenger cars - Year-over-year growth 2023-2028 (%)
    • 6.4 Commercial vehicles - Market size and forecast 2023-2028
      • Chart on Commercial vehicles - Market size and forecast 2023-2028 ($ million)
      • Data Table on Commercial vehicles - Market size and forecast 2023-2028 ($ million)
      • Chart on Commercial vehicles - Year-over-year growth 2023-2028 (%)
      • Data Table on Commercial vehicles - Year-over-year growth 2023-2028 (%)
    • 6.5 Market opportunity by Application
      • Market opportunity by Application ($ million)
      • Data Table on Market opportunity by Application ($ million)

    7 Market Segmentation by End-user

    • 7.1 Market segments
      • Chart on End-user - Market share 2023-2028 (%)
      • Data Table on End-user - Market share 2023-2028 (%)
    • 7.2 Comparison by End-user
      • Chart on Comparison by End-user
      • Data Table on Comparison by End-user
    • 7.3 OEM - Market size and forecast 2023-2028
      • Chart on OEM - Market size and forecast 2023-2028 ($ million)
      • Data Table on OEM - Market size and forecast 2023-2028 ($ million)
      • Chart on OEM - Year-over-year growth 2023-2028 (%)
      • Data Table on OEM - Year-over-year growth 2023-2028 (%)
    • 7.4 Aftermarket - Market size and forecast 2023-2028
      • Chart on Aftermarket - Market size and forecast 2023-2028 ($ million)
      • Data Table on Aftermarket - Market size and forecast 2023-2028 ($ million)
      • Chart on Aftermarket - Year-over-year growth 2023-2028 (%)
      • Data Table on Aftermarket - Year-over-year growth 2023-2028 (%)
    • 7.5 Market opportunity by End-user
      • Market opportunity by End-user ($ million)
      • Data Table on Market opportunity by End-user ($ million)

    8 Customer Landscape

    • 8.1 Customer landscape overview
      • Analysis of price sensitivity, lifecycle, customer purchase basket, adoption rates, and purchase criteria

    9 Geographic Landscape

    • 9.1 Geographic segmentation
      • Chart on Market share by geography 2023-2028 (%)
      • Data Table on Market share by geography 2023-2028 (%)
    • 9.2 Geographic comparison
      • Chart on Geographic comparison
      • Data Table on Geographic comparison
    • 9.3 APAC - Market size and forecast 2023-2028
      • Chart on APAC - Market size and forecast 2023-2028 ($ million)
      • Data Table on APAC - Market size and forecast 2023-2028 ($ million)
      • Chart on APAC - Year-over-year growth 2023-2028 (%)
      • Data Table on APAC - Year-over-year growth 2023-2028 (%)
    • 9.4 Europe - Market size and forecast 2023-2028
      • Chart on Europe - Market size and forecast 2023-2028 ($ million)
      • Data Table on Europe - Market size and forecast 2023-2028 ($ million)
      • Chart on Europe - Year-over-year growth 2023-2028 (%)
      • Data Table on Europe - Year-over-year growth 2023-2028 (%)
    • 9.5 North America - Market size and forecast 2023-2028
      • Chart on North America - Market size and forecast 2023-2028 ($ million)
      • Data Table on North America - Market size and forecast 2023-2028 ($ million)
      • Chart on North America - Year-over-year growth 2023-2028 (%)
      • Data Table on North America - Year-over-year growth 2023-2028 (%)
    • 9.6 South America - Market size and forecast 2023-2028
      • Chart on South America - Market size and forecast 2023-2028 ($ million)
      • Data Table on South America - Market size and forecast 2023-2028 ($ million)
      • Chart on South America - Year-over-year growth 2023-2028 (%)
      • Data Table on South America - Year-over-year growth 2023-2028 (%)
    • 9.7 Middle East and Africa - Market size and forecast 2023-2028
      • Chart on Middle East and Africa - Market size and forecast 2023-2028 ($ million)
      • Data Table on Middle East and Africa - Market size and forecast 2023-2028 ($ million)
      • Chart on Middle East and Africa - Year-over-year growth 2023-2028 (%)
      • Data Table on Middle East and Africa - Year-over-year growth 2023-2028 (%)
    • 9.8 China - Market size and forecast 2023-2028
      • Chart on China - Market size and forecast 2023-2028 ($ million)
      • Data Table on China - Market size and forecast 2023-2028 ($ million)
      • Chart on China - Year-over-year growth 2023-2028 (%)
      • Data Table on China - Year-over-year growth 2023-2028 (%)
    • 9.9 US - Market size and forecast 2023-2028
      • Chart on US - Market size and forecast 2023-2028 ($ million)
      • Data Table on US - Market size and forecast 2023-2028 ($ million)
      • Chart on US - Year-over-year growth 2023-2028 (%)
      • Data Table on US - Year-over-year growth 2023-2028 (%)
    • 9.10 Japan - Market size and forecast 2023-2028
      • Chart on Japan - Market size and forecast 2023-2028 ($ million)
      • Data Table on Japan - Market size and forecast 2023-2028 ($ million)
      • Chart on Japan - Year-over-year growth 2023-2028 (%)
      • Data Table on Japan - Year-over-year growth 2023-2028 (%)
    • 9.11 India - Market size and forecast 2023-2028
      • Chart on India - Market size and forecast 2023-2028 ($ million)
      • Data Table on India - Market size and forecast 2023-2028 ($ million)
      • Chart on India - Year-over-year growth 2023-2028 (%)
      • Data Table on India - Year-over-year growth 2023-2028 (%)
    • 9.12 Germany - Market size and forecast 2023-2028
      • Chart on Germany - Market size and forecast 2023-2028 ($ million)
      • Data Table on Germany - Market size and forecast 2023-2028 ($ million)
      • Chart on Germany - Year-over-year growth 2023-2028 (%)
      • Data Table on Germany - Year-over-year growth 2023-2028 (%)
    • 9.13 Market opportunity by geography
      • Market opportunity by geography ($ million)
      • Data Tables on Market opportunity by geography ($ million)

    10 Drivers, Challenges, and Opportunity/Restraints

    • 10.1 Market drivers
      • 10.2 Market challenges
        • 10.3 Impact of drivers and challenges
          • Impact of drivers and challenges in 2023 and 2028
        • 10.4 Market opportunities/restraints

          11 Competitive Landscape

          • 11.1 Overview
            • 11.2 Competitive Landscape
              • Overview on criticality of inputs and factors of differentiation
            • 11.3 Landscape disruption
              • Overview on factors of disruption
            • 11.4 Industry risks
              • Impact of key risks on business

            12 Competitive Analysis

            • 12.1 Companies profiled
              • Companies covered
            • 12.2 Market positioning of companies
              • Matrix on companies position and classification
            • 12.3 Amphenol Corp.
              • Amphenol Corp. - Overview
              • Amphenol Corp. - Business segments
              • Amphenol Corp. - Key news
              • Amphenol Corp. - Key offerings
              • Amphenol Corp. - Segment focus
            • 12.4 ams OSRAM AG
              • ams OSRAM AG - Overview
              • ams OSRAM AG - Product / Service
              • ams OSRAM AG - Key offerings
            • 12.5 Asahi Kasei Corp.
              • Asahi Kasei Corp. - Overview
              • Asahi Kasei Corp. - Business segments
              • Asahi Kasei Corp. - Key news
              • Asahi Kasei Corp. - Key offerings
              • Asahi Kasei Corp. - Segment focus
            • 12.6 Axetris AG
              • Axetris AG - Overview
              • Axetris AG - Product / Service
              • Axetris AG - Key offerings
            • 12.7 Faurecia SE
              • Faurecia SE - Overview
              • Faurecia SE - Product / Service
              • Faurecia SE - Key news
              • Faurecia SE - Key offerings
            • 12.8 Hanon Systems
              • Hanon Systems - Overview
              • Hanon Systems - Business segments
              • Hanon Systems - Key news
              • Hanon Systems - Key offerings
              • Hanon Systems - Segment focus
            • 12.9 Honeywell International Inc.
              • Honeywell International Inc. - Overview
              • Honeywell International Inc. - Business segments
              • Honeywell International Inc. - Key news
              • Honeywell International Inc. - Key offerings
              • Honeywell International Inc. - Segment focus
            • 12.10 NEW COSMOS ELECTRIC Co. Ltd.
              • NEW COSMOS ELECTRIC Co. Ltd. - Overview
              • NEW COSMOS ELECTRIC Co. Ltd. - Product / Service
              • NEW COSMOS ELECTRIC Co. Ltd. - Key offerings
            • 12.11 OMRON Corp.
              • OMRON Corp. - Overview
              • OMRON Corp. - Business segments
              • OMRON Corp. - Key news
              • OMRON Corp. - Key offerings
              • OMRON Corp. - Segment focus
            • 12.12 Panasonic Holdings Corp.
              • Panasonic Holdings Corp. - Overview
              • Panasonic Holdings Corp. - Business segments
              • Panasonic Holdings Corp. - Key news
              • Panasonic Holdings Corp. - Key offerings
              • Panasonic Holdings Corp. - Segment focus
            • 12.13 paragon GmbH and Co. KGaA
              • paragon GmbH and Co. KGaA - Overview
              • paragon GmbH and Co. KGaA - Business segments
              • paragon GmbH and Co. KGaA - Key offerings
              • paragon GmbH and Co. KGaA - Segment focus
            • 12.14 Prodrive Technologies BV
              • Prodrive Technologies BV - Overview
              • Prodrive Technologies BV - Product / Service
              • Prodrive Technologies BV - Key offerings
            • 12.15 Sensata Technologies Inc.
              • Sensata Technologies Inc. - Overview
              • Sensata Technologies Inc. - Business segments
              • Sensata Technologies Inc. - Key news
              • Sensata Technologies Inc. - Key offerings
              • Sensata Technologies Inc. - Segment focus
            • 12.16 Sensirion AG
              • Sensirion AG - Overview
              • Sensirion AG - Product / Service
              • Sensirion AG - Key news
              • Sensirion AG - Key offerings
            • 12.17 Valeo SA
              • Valeo SA - Overview
              • Valeo SA - Business segments
              • Valeo SA - Key news
              • Valeo SA - Key offerings
              • Valeo SA - Segment focus

            13 Appendix

            • 13.1 Scope of the report
              • 13.2 Inclusions and exclusions checklist
                • Inclusions checklist
                • Exclusions checklist
              • 13.3 Currency conversion rates for US$
                • Currency conversion rates for US$
              • 13.4 Research methodology
                • Research methodology
              • 13.5 Data procurement
                • Information sources
              • 13.6 Data validation
                • Data validation
              • 13.7 Validation techniques employed for market sizing
                • Validation techniques employed for market sizing
              • 13.8 Data synthesis
                • Data synthesis
              • 360 degree market analysis
                • 360 degree market analysis
              • 13.10 List of abbreviations
                • List of abbreviations

              Research Methodology

              Technavio presents a detailed picture of the market by way of study, synthesis, and summation of data from multiple sources. The analysts have presented the various facets of the market with a particular focus on identifying the key industry influencers. The data thus presented is comprehensive, reliable, and the result of extensive research, both primary and secondary.

              INFORMATION SOURCES

              Primary sources

              • Manufacturers and suppliers
              • Channel partners
              • Industry experts
              • Strategic decision makers

              Secondary sources

              • Industry journals and periodicals
              • Government data
              • Financial reports of key industry players
              • Historical data
              • Press releases

              DATA ANALYSIS

              Data Synthesis

              • Collation of data
              • Estimation of key figures
              • Analysis of derived insights

              Data Validation

              • Triangulation with data models
              • Reference against proprietary databases
              • Corroboration with industry experts

              REPORT WRITING

              Qualitative

              • Market drivers
              • Market challenges
              • Market trends
              • Five forces analysis

              Quantitative

              • Market size and forecast
              • Market segmentation
              • Geographical insights
              • Competitive landscape

              Interested in this report?

              Get your sample now to see our research methodology and insights!

              Download Now

              Frequently Asked Questions

              Automotive Cabin Air Quality Sensor market growth will increase by $ 370.6 mn during 2024-2028.

              The Automotive Cabin Air Quality Sensor market is expected to grow at a CAGR of 12.27% during 2024-2028.

              Automotive Cabin Air Quality Sensor market is segmented by Application( Passenger cars, Commercial vehicles) End-user( OEM, Aftermarket, North America, South America, MEA)

              Amphenol Corp., ams OSRAM AG, Asahi Kasei Corp., Axetris AG, Faurecia SE, Hanon Systems, Honeywell International Inc., NEW COSMOS ELECTRIC Co. Ltd., Nissha Co. Ltd., OMRON Corp., Origins Technology Ltd., Panasonic Holdings Corp., paragon GmbH and Co. KGaA, Prana Air, Prodrive Technologies BV, Sensata Technologies Inc., Sensirion AG, Standard Motor Products Inc., UST Umweltsensortechnik GmbH, Valeo SA are a few of the key vendors in the Automotive Cabin Air Quality Sensor market.

              APAC will register the highest growth rate of 45% among the other regions. Therefore, the Automotive Cabin Air Quality Sensor market in APAC is expected to garner significant business opportunities for the vendors during the forecast period.

              China, US, Japan, India, Germany

              • Rising awareness about ill effects of air pollutionBefore users came to know about the benefits of cabin air filters is the driving factor this market.
              • they were simply an extra accessory. Customers with pollen allergy soon understood its benefits and started to spread the word. Later is the driving factor this market.
              • with the advancement of filter technology is the driving factor this market.
              • the filter was capable of filtering even odor and small pollutants. With the increase in health advantages is the driving factor this market.
              • users soon started buying vehicles with HVAC. This demand has made HVAC a common feature in all vehicles. Globally is the driving factor this market.
              • governments have played a crucial role in spreading awareness and restricting vehicular pollution by enforcing emission norms. These emission norms deal with the levels of carbon monoxide is the driving factor this market.
              • nitrogen oxide is the driving factor this market.
              • hydrocarbons and nitrogen oxides is the driving factor this market.
              • and atmospheric particulate matter in the air. Pressure from the government caused vehicle manufacturers to make changes in engine design for low emissions and include cabin air filters for passenger safety. It is easier for people to get exposed to air pollution in an open environment than in an enclosed area. Therefore is the driving factor this market.
              • the adoption of cabin AQS is growing in modern vehicles as the vehicle vulnerability to air pollution remains high while driving. Therefore is the driving factor this market.
              • rising awareness about the ill effects of air pollution will drive the growth of the global automotive cabin AQS market during the forecast period. is the driving factor this market.

              The Automotive Cabin Air Quality Sensor market vendors should focus on grabbing business opportunities from the Passenger cars segment as it accounted for the largest market share in the base year.
              RIA - Research AI Assistant
              Ask RIA