Automotive Chassis Market Analysis, Size, and Forecast 2025-2029: APAC (China, Japan, and India), Europe (Germany, UK, and France), North America (US, Canada, and Mexico), South America (Brazil and Argentina), Middle East and Africa (UAE, Saudi Arabia, and South Africa), and Rest of World (ROW)

Automotive Chassis Market Analysis, Size, and Forecast 2025-2029:
APAC (China, Japan, and India), Europe (Germany, UK, and France), North America (US, Canada, and Mexico), South America (Brazil and Argentina), Middle East and Africa (UAE, Saudi Arabia, and South Africa), and Rest of World (ROW)

Published: Dec 2025 293 Pages SKU: IRTNTR44014

Market Overview at a Glance

$35.39 B
Market Opportunity
10%
CAGR 2024 - 2029
54.2%
APAC Growth
$29.98 B
Monocoque chassis segment 2023

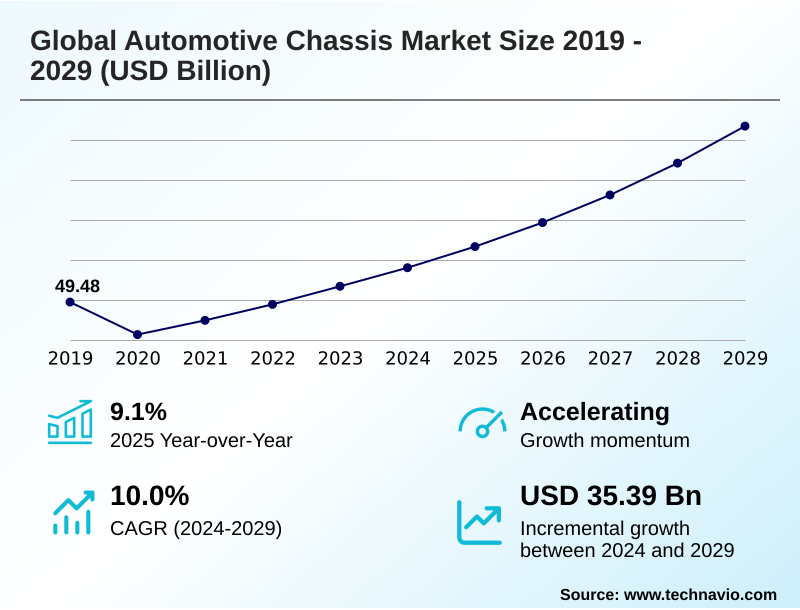
Automotive Chassis Market Size 2025-2029

The automotive chassis market size is valued to increase by USD 35.39 billion, at a CAGR of 10% from 2024 to 2029. Increasing adoption of advanced chassis design leads to the reduced weight of vehicles will drive the automotive chassis market.

Major Market Trends & Insights

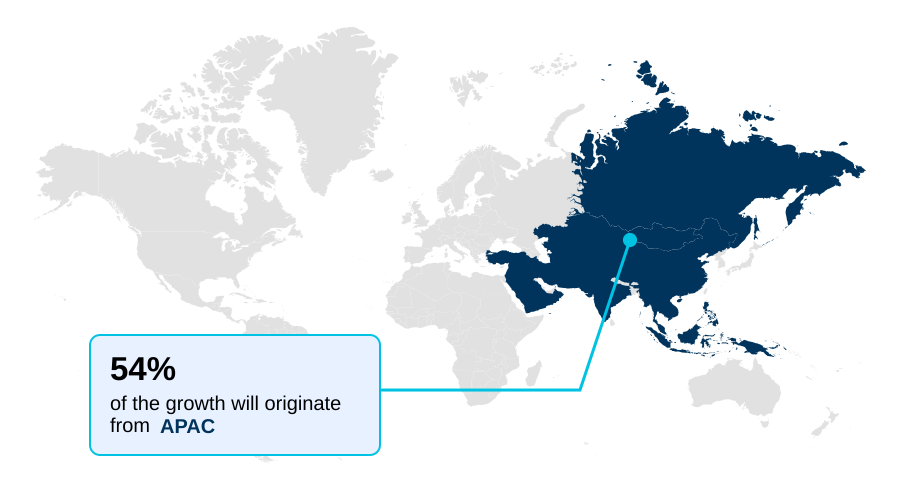
  • APAC dominated the market and accounted for a 54.2% growth during the forecast period.
  • By Type - Monocoque chassis segment was valued at USD 29.98 billion in 2023
  • By Application - Passenger cars segment accounted for the largest market revenue share in 2023

Market Size & Forecast

  • Market Opportunities: USD 43.99 billion
  • Market Future Opportunities: USD 35.39 billion
  • CAGR from 2024 to 2029 : 10%

Market Summary

  • The automotive chassis market is undergoing a fundamental transformation, driven by the shift to electric mobility and stricter emissions regulations. The demand for vehicle lightweighting is pushing manufacturers away from traditional steel-only structures toward advanced solutions involving a backbone chassis or spaceframe chassis.
  • This includes multi-material construction incorporating aluminum alloys and carbon fiber composites to improve the power-to-weight ratio without compromising torsional rigidity or crash energy absorption.
  • A key business scenario involves optimizing the supply chain for these varied materials; for instance, a manufacturer must manage the logistics of sourcing advanced high-strength steel from one supplier and carbon fiber reinforced plastic from another for a single modular platform architecture.
  • This complexity extends to manufacturing, where techniques like structural adhesive bonding and robotic spot welding must be adapted for different materials. The rise of skateboard chassis designs for electric vehicles further disrupts traditional body-on-frame concepts, integrating driveline components and EV battery enclosures into a single, scalable unit that redefines vehicle assembly and design possibilities.

What will be the Size of the Automotive Chassis Market during the forecast period?

Get Key Insights on Market Forecast (PDF) Request Free Sample

How is the Automotive Chassis Market Segmented?

The automotive chassis industry research report provides comprehensive data (region-wise segment analysis), with forecasts and estimates in "USD million" for the period 2025-2029, as well as historical data from 2019-2023 for the following segments.
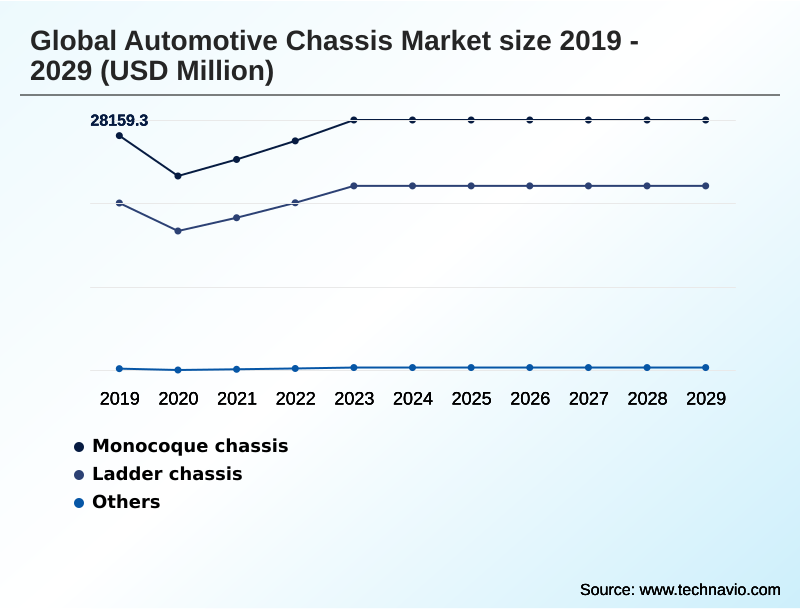
  • Type
    • Monocoque chassis
    • Ladder chassis
    • Others
  • Application
    • Passenger cars
    • Commercial vehicles
  • Material
    • Steel
    • Aluminum
    • Carbon fiber composites
  • Geography
    • APAC
      • China
      • Japan
      • India
    • Europe
      • Germany
      • UK
      • France
    • North America
      • US
      • Canada
      • Mexico
    • South America
      • Brazil
      • Argentina
    • Middle East and Africa
      • UAE
      • Saudi Arabia
      • South Africa
    • Rest of World (ROW)

By Type Insights

The monocoque chassis segment is estimated to witness significant growth during the forecast period.

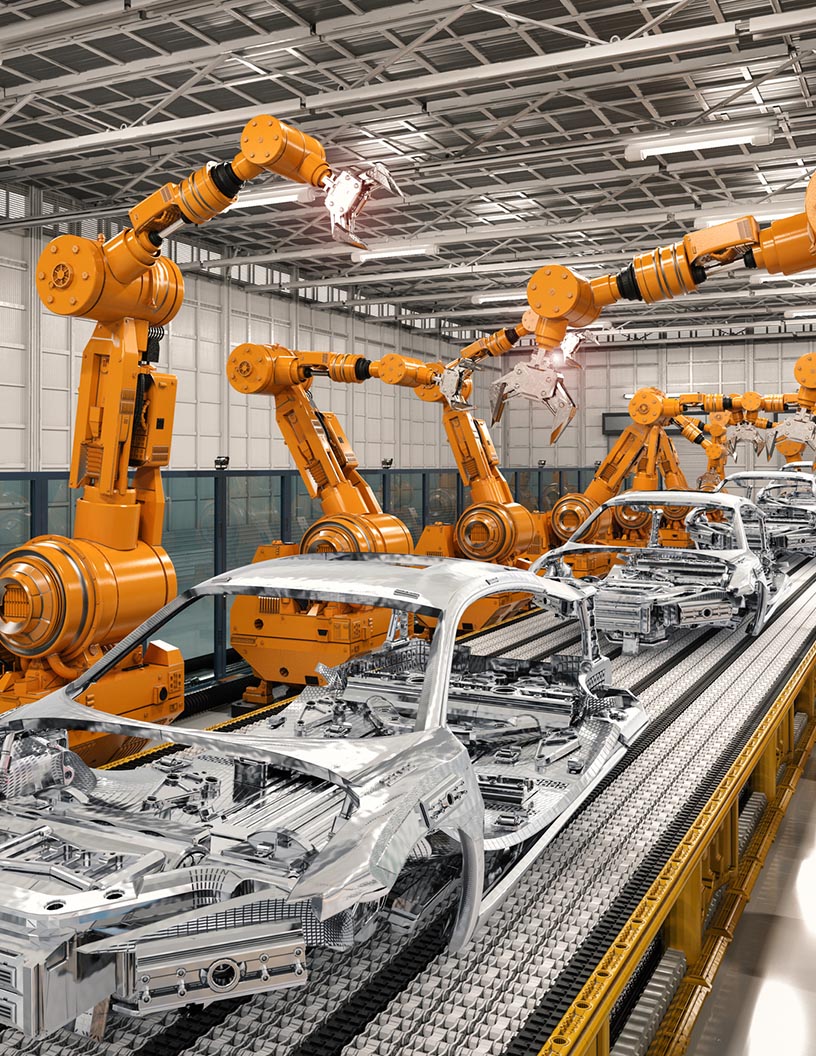
The monocoque chassis segment is defined by its unitary construction, where the body-in-white (BIW) structure and frame are a single piece, enhancing structural integrity.

This design, formed from stamped steel panels joined by robotic spot welding, is fundamental to mass-market vehicle manufacturing. It facilitates efficient, high-volume production, with automated lines reducing assembly times by over 20% compared to traditional methods, enabling just-in-time (JIT) production.

While offering superior crash protection, the design also allows for improved ride comfort engineering.

The continuous push for efficiency is driving innovation in materials to enhance the power-to-weight ratio, although the core principles of this cost-effective manufacturing process remain dominant, impacting platform lifecycle management across the passenger car sector.

Request Free Sample

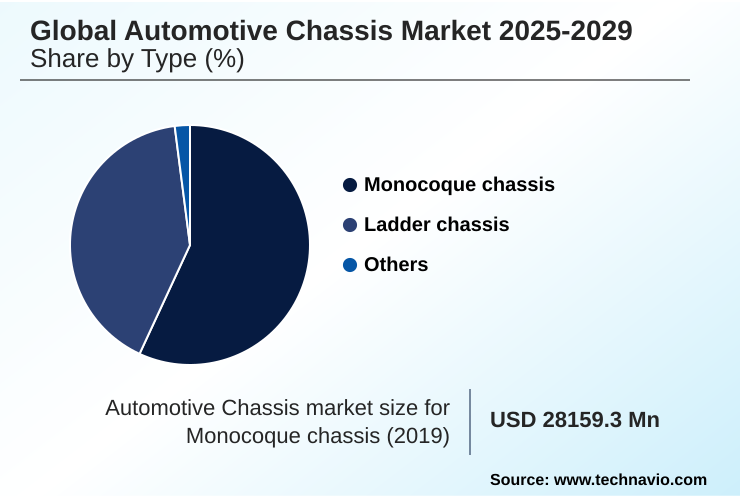
The Monocoque chassis segment was valued at USD 29.98 billion in 2023 and showed a gradual increase during the forecast period.

Request Free Sample

Regional Analysis

APAC is estimated to contribute 54.2% to the growth of the global market during the forecast period.Technavio’s analysts have elaborately explained the regional trends and drivers that shape the market during the forecast period.

See How Automotive Chassis Market Demand is Rising in APAC Request Free Sample

The geographic landscape is dominated by the APAC region, which accounts for over 54% of the market's incremental growth, driven by high vehicle adoption rates in China and India.

The region showcases a dual dynamic: high demand for traditional body-on-frame and ladder chassis designs for commercial vehicles and SUVs, alongside rapid adoption of advanced skateboard chassis for electric vehicles.

This transition to EVs in APAC is driving innovation in axle systems and the design of the EV battery enclosure.

In contrast, mature markets in Europe and North America focus on optimizing chassis system integration with features like advanced driver assistance integration and integrated braking solutions.

The strategic localization of manufacturing in APAC has enabled some OEMs to reduce supply chain costs by over 10%, highlighting the region's importance for both volume and operational efficiency.

Market Dynamics

Our researchers analyzed the data with 2024 as the base year, along with the key drivers, trends, and challenges. A holistic analysis of drivers will help companies refine their marketing strategies to gain a competitive advantage.

  • The strategic decisions facing automotive engineers today are increasingly complex, involving detailed analysis of monocoque versus ladder chassis for SUVs, where the trade-offs between on-road comfort and off-road ruggedness are critical. The cost-benefit of aluminum in chassis construction remains a key debate, balancing weight savings against material and fabrication expenses.
  • This is particularly relevant when considering carbon fiber monocoque production challenges, which, despite offering superior performance, involve high costs and complex manufacturing cycles. The impact of skateboard chassis on EV interior design is profound, liberating space once occupied by traditional drivetrain components. This shift necessitates new joining techniques for multi-material chassis to effectively bond aluminum, steel, and composites.
  • Concurrently, lightweighting strategies for commercial vehicles are being developed to improve fuel efficiency without sacrificing payload capacity, often involving advanced high-strength steel grade applications. Engineers focus on the role of subframes in noise vibration harshness reduction and enhancing torsional rigidity in performance cars.
  • A primary concern is chassis design for battery protection in EVs, demanding high structural integrity of hydroformed rails. The robotic welding impact on chassis quality is a constant area of improvement. Material selection for axle systems is crucial for durability, while chassis optimization for active suspension is key for dynamic handling. Steer-by-wire implications for chassis design are reshaping front-end architecture.
  • The shortened platform lifecycle impact on R&D costs, now representing over 5% more of a vehicle's total cost than a decade ago, puts pressure on development. Finally, the chassis material impact on crashworthiness and the body-on-frame vs unibody for towing debate remain central to vehicle engineering, as does optimizing power-to-weight ratio with composites for ultimate performance.

What are the key market drivers leading to the rise in the adoption of Automotive Chassis Industry?

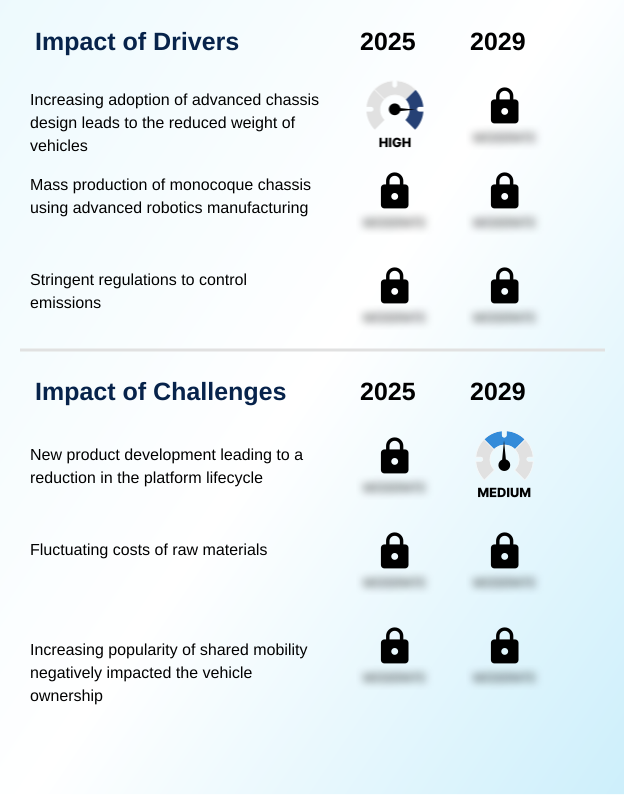
  • The increasing adoption of advanced chassis designs to achieve significant vehicle weight reduction is a primary driver of market growth.

  • Key market drivers are stringent emissions regulations and the mass production efficiencies of modern chassis designs.
  • The imperative for vehicle lightweighting is compelling the adoption of advanced high-strength steel (AHSS) and aluminum, which can reduce the weight of key structures like subframes and hydroformed components by up to 30% compared to conventional materials.
  • Virtual simulation optimization is crucial in this process, allowing engineers to conduct fatigue life analysis digitally, accelerating development. Concurrently, the use of robotic manufacturing for monocoque designs has increased production throughput by over 20%, making advanced designs more cost-effective.
  • This automation, combined with techniques like structural adhesive bonding, supports the complex mechatronic systems integration required for modern suspension modules.

What are the market trends shaping the Automotive Chassis Industry?

  • The growing popularity of carbon monocoque chassis is emerging as a significant market trend. This is driven by demand for lightweight and structurally sound frames, particularly in high-performance vehicles.

  • Emerging trends are centered on advanced materials and construction methods to enhance performance and efficiency. The development of multi-material chassis, which combines automotive-grade aluminum with carbon fiber composites, is gaining traction. This approach optimizes material placement, with some designs achieving a 15% increase in stiffness while simultaneously reducing weight.
  • The growing popularity of carbon fiber composites, particularly in high-performance vehicles, is notable; their use in a backbone chassis or tubular frame design can reduce the chassis weight by up to 40% compared to steel.
  • These innovations are coupled with the integration of electronic suspension systems featuring active damping technology, which improves vehicle dynamics control and allows for real-time adjustments to road conditions, creating a more responsive and refined driving experience.

What challenges does the Automotive Chassis Industry face during its growth?

  • Rapid new product development, which consequently shortens the vehicle platform lifecycle, presents a significant challenge to industry profitability and investment planning.

  • Significant market challenges stem from fluctuating raw material costs and rapid technological shifts. The price volatility of aluminum alloys, which can fluctuate by more than 10% quarterly, directly impacts the production cost of components like steering knuckles and cross-member designs. This uncertainty complicates budgeting for advanced structures like a spaceframe chassis.
  • Another challenge is the shortened product development cycle, which reduces the time available for extensive component durability testing. This pressure can affect the long-term reliability of systems such as electronic stability control and brake-by-wire systems. Ensuring consistent crash energy absorption and torsional rigidity across rapidly evolving platforms requires significant R&D investment, straining profitability for many suppliers in the ecosystem.

Exclusive Technavio Analysis on Customer Landscape

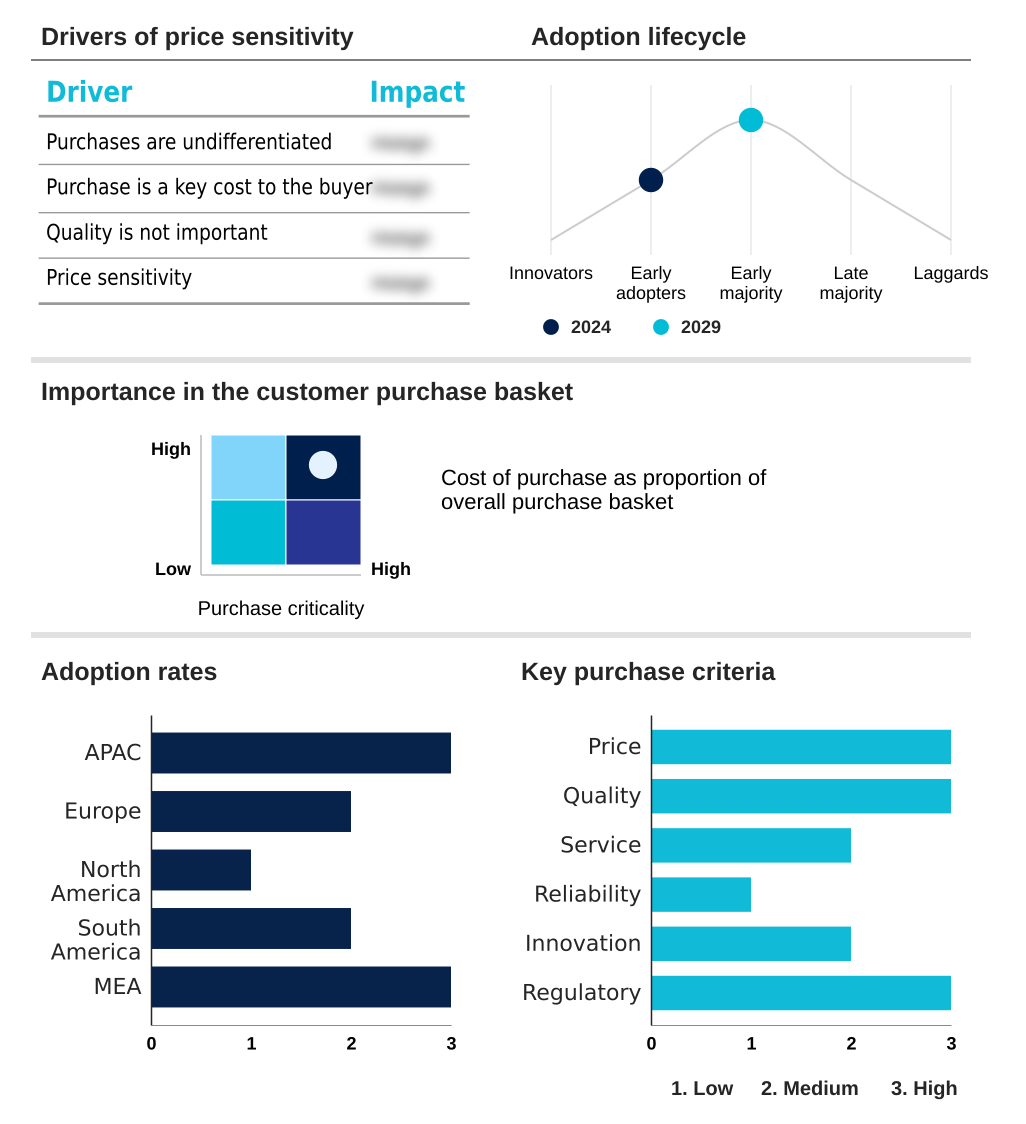
The automotive chassis market forecasting report includes the adoption lifecycle of the market, covering from the innovator’s stage to the laggard’s stage. It focuses on adoption rates in different regions based on penetration. Furthermore, the automotive chassis market report also includes key purchase criteria and drivers of price sensitivity to help companies evaluate and develop their market growth analysis strategies.

Customer Landscape of Automotive Chassis Industry

Competitive Landscape

Companies are implementing various strategies, such as strategic alliances, automotive chassis market forecast, partnerships, mergers and acquisitions, geographical expansion, and product/service launches, to enhance their presence in the industry.

AISIN Corp. - Analysis indicates a focus on integrated automotive chassis technologies, encompassing electronic suspension, advanced braking controls, and driver assistance system integration for enhanced vehicle dynamics.

The industry research and growth report includes detailed analyses of the competitive landscape of the market and information about key companies, including:

  • AISIN Corp.
  • ALF Engineering Pvt. Ltd.
  • American Axle and Manufacturing Inc.
  • Autokiniton US Holdings Inc.
  • Benteler International AG
  • BWI Group
  • CIE Automotive SA
  • Continental AG
  • DuPont de Nemours Inc.
  • FEV Group GmbH
  • Hyundai Motor Co.
  • KLT Automotive and Tubular Products Ltd.
  • Magna International Inc.
  • Rausch and Pausch SE
  • Schaeffler AG
  • Surin Automotive P Ltd.
  • Tenneco Inc.
  • ZF Friedrichshafen AG

Qualitative and quantitative analysis of companies has been conducted to help clients understand the wider business environment as well as the strengths and weaknesses of key industry players. Data is qualitatively analyzed to categorize companies as pure play, category-focused, industry-focused, and diversified; it is quantitatively analyzed to categorize companies as dominant, leading, strong, tentative, and weak.

Recent Development and News in Automotive chassis market

  • In September 2024, Agratas announced an investment of over USD 5.37 billion to construct a 40 GWh gigafactory in Somerset, aimed at supplying batteries for electric vehicle chassis manufacturing.
  • In November 2024, Hyundai Motors announced a substantial investment to expand its electric vehicle range and enhance its current vehicle platforms in India, focusing on localizing chassis development.
  • In January 2025, Stellantis detailed its STLA Large platform, a global, flexible BEV architecture designed to standardize modules and chassis components for upcoming full-size electric vehicles.
  • In May 2025, Jetour committed USD 123 million to establish a new vehicle assembly facility in Egypt, supporting the government's strategy to localize the automotive industry and chassis production.

Dive into Technavio’s robust research methodology, blending expert interviews, extensive data synthesis, and validated models for unparalleled Automotive Chassis Market insights. See full methodology.

Market Scope
Page number 293
Base year 2024
Historic period 2019-2023
Forecast period 2025-2029
Growth momentum & CAGR Accelerate at a CAGR of 10%
Market growth 2025-2029 USD 35393.0 million
Market structure Fragmented
YoY growth 2024-2025(%) 9.1%
Key countries China, Japan, India, South Korea, Australia, Indonesia, Germany, UK, France, Italy, Spain, The Netherlands, US, Canada, Mexico, Brazil, Argentina, Chile, UAE, Saudi Arabia, South Africa, Egypt and Nigeria
Competitive landscape Leading Companies, Market Positioning of Companies, Competitive Strategies, and Industry Risks

Request Free Sample

Research Analyst Overview

  • The automotive chassis market is undergoing a significant architectural shift, moving beyond traditional stamped steel panels and body-on-frame construction. The rise of electric vehicles is popularizing the skateboard chassis, which integrates driveline components and requires new approaches to achieve high torsional rigidity and structural integrity. For boardroom consideration, the choice of materials presents a strategic dilemma.
  • Continuing with advanced high-strength steel (AHSS) for subframes and hydroformed components minimizes capital expenditure on retooling. However, investing in manufacturing capabilities for aluminum alloys and carbon fiber composites is essential for future competitiveness in vehicle lightweighting and achieving a superior power-to-weight ratio.
  • Carbon fiber composites, for instance, offer a stiffness-to-weight ratio that is over five times that of steel, directly enhancing performance. This decision impacts everything from suspension modules and axle systems to steering knuckles.
  • Whether developing a monocoque chassis, ladder chassis, spaceframe chassis, or a specialized backbone chassis, the focus is on optimizing crash energy absorption and integrating electronic suspension systems and integrated braking solutions through advanced manufacturing like robotic spot welding.

What are the Key Data Covered in this Automotive Chassis Market Research and Growth Report?

  • What is the expected growth of the Automotive Chassis Market between 2025 and 2029?

    • USD 35.39 billion, at a CAGR of 10%

  • What segmentation does the market report cover?

    • The report is segmented by Type (Monocoque chassis, Ladder chassis, and Others), Application (Passenger cars, and Commercial vehicles), Material (Steel, Aluminum, and Carbon fiber composites) and Geography (APAC, Europe, North America, South America, Middle East and Africa)

  • Which regions are analyzed in the report?

    • APAC, Europe, North America, South America and Middle East and Africa

  • What are the key growth drivers and market challenges?

    • Increasing adoption of advanced chassis design leads to the reduced weight of vehicles, New product development leading to a reduction in the platform lifecycle

  • Who are the major players in the Automotive Chassis Market?

    • AISIN Corp., ALF Engineering Pvt. Ltd., American Axle and Manufacturing Inc., Autokiniton US Holdings Inc., Benteler International AG, BWI Group, CIE Automotive SA, Continental AG, DuPont de Nemours Inc., FEV Group GmbH, Hyundai Motor Co., KLT Automotive and Tubular Products Ltd., Magna International Inc., Rausch and Pausch SE, Schaeffler AG, Surin Automotive P Ltd., Tenneco Inc. and ZF Friedrichshafen AG

Market Research Insights

  • Market dynamics are shaped by a push for higher efficiency and performance, compelling a shift toward advanced modular platform architecture. This strategic move allows for greater flexibility, with some automakers reporting a 20% reduction in development time for new models.
  • The integration of mechatronic systems is central to this evolution, enabling technologies like active damping technology and active roll control for superior vehicle dynamics control. For instance, platforms incorporating these systems have demonstrated a 15% improvement in handling metrics during component durability testing. Furthermore, steer-by-wire systems are becoming more prevalent, creating new possibilities for chassis design and interior packaging.
  • These innovations reflect a market where chassis system integration is critical for delivering the safety and performance features that consumers demand.

We can help! Our analysts can customize this automotive chassis market research report to meet your requirements.

Get in touch

1. Executive Summary

1.1 Market overview

Executive Summary - Chart on Market Overview
Executive Summary - Data Table on Market Overview
Executive Summary - Chart on Global Market Characteristics
Executive Summary - Chart on Market by Geography
Executive Summary - Chart on Market Segmentation by Type
Executive Summary - Chart on Market Segmentation by Application
Executive Summary - Chart on Market Segmentation by Material
Executive Summary - Chart on Incremental Growth
Executive Summary - Data Table on Incremental Growth
Executive Summary - Chart on Company Market Positioning

2. Technavio Analysis

2.1 Analysis of price sensitivity, lifecycle, customer purchase basket, adoption rates, and purchase criteria

2.2 Criticality of inputs and Factors of differentiation

Chart on Overview on criticality of inputs and factors of differentiation

2.3 Factors of disruption

Chart on Overview on factors of disruption

2.4 Impact of drivers and challenges

Chart on Impact of drivers and challenges in 2024 and 2029

3. Market Landscape

3.1 Market ecosystem

Chart on Parent Market
Data Table on - Parent Market

3.2 Market characteristics

Chart on Market characteristics analysis

3.3 Value chain analysis

Chart on Value chain analysis

4. Market Sizing

4.1 Market definition

Data Table on Offerings of companies included in the market definition

4.2 Market segment analysis

Market segments

4.3 Market size 2024

4.4 Market outlook: Forecast for 2024-2029

Chart on Global - Market size and forecast 2024-2029 ($ million)
Data Table on Global - Market size and forecast 2024-2029 ($ million)
Chart on Global Market: Year-over-year growth 2024-2029 (%)
Data Table on Global Market: Year-over-year growth 2024-2029 (%)

5. Historic Market Size

5.1 Global Automotive Chassis Market 2019 - 2023

Historic Market Size - Data Table on Global Automotive Chassis Market 2019 - 2023 ($ million)

5.2 Type segment analysis 2019 - 2023

Historic Market Size - Type Segment 2019 - 2023 ($ million)

5.3 Application segment analysis 2019 - 2023

Historic Market Size - Application Segment 2019 - 2023 ($ million)

5.4 Material segment analysis 2019 - 2023

Historic Market Size - Material Segment 2019 - 2023 ($ million)

5.5 Geography segment analysis 2019 - 2023

Historic Market Size - Geography Segment 2019 - 2023 ($ million)

5.6 Country segment analysis 2019 - 2023

Historic Market Size - Country Segment 2019 - 2023 ($ million)

6. Qualitative Analysis

6.1 Impact of AI in global automotive chassis market

7. Five Forces Analysis

7.1 Five forces summary

Five forces analysis - Comparison between 2024 and 2029

7.2 Bargaining power of buyers

Bargaining power of buyers - Impact of key factors 2024 and 2029

7.3 Bargaining power of suppliers

Bargaining power of suppliers - Impact of key factors in 2024 and 2029

7.4 Threat of new entrants

Threat of new entrants - Impact of key factors in 2024 and 2029

7.5 Threat of substitutes

Threat of substitutes - Impact of key factors in 2024 and 2029

7.6 Threat of rivalry

Threat of rivalry - Impact of key factors in 2024 and 2029

7.7 Market condition

Chart on Market condition - Five forces 2024 and 2029

8. Market Segmentation by Type

8.1 Market segments

Chart on Type - Market share 2024-2029 (%)
Data Table on Type - Market share 2024-2029 (%)

8.2 Comparison by Type

Chart on Comparison by Type
Data Table on Comparison by Type

8.3 Monocoque chassis - Market size and forecast 2024-2029

Chart on Monocoque chassis - Market size and forecast 2024-2029 ($ million)
Data Table on Monocoque chassis - Market size and forecast 2024-2029 ($ million)
Chart on Monocoque chassis - Year-over-year growth 2024-2029 (%)
Data Table on Monocoque chassis - Year-over-year growth 2024-2029 (%)

8.4 Ladder chassis - Market size and forecast 2024-2029

Chart on Ladder chassis - Market size and forecast 2024-2029 ($ million)
Data Table on Ladder chassis - Market size and forecast 2024-2029 ($ million)
Chart on Ladder chassis - Year-over-year growth 2024-2029 (%)
Data Table on Ladder chassis - Year-over-year growth 2024-2029 (%)

8.5 Others - Market size and forecast 2024-2029

Chart on Others - Market size and forecast 2024-2029 ($ million)
Data Table on Others - Market size and forecast 2024-2029 ($ million)
Chart on Others - Year-over-year growth 2024-2029 (%)
Data Table on Others - Year-over-year growth 2024-2029 (%)

8.6 Market opportunity by Type

Market opportunity by Type ($ million)
Data Table on Market opportunity by Type ($ million)

9. Market Segmentation by Application

9.1 Market segments

Chart on Application - Market share 2024-2029 (%)
Data Table on Application - Market share 2024-2029 (%)

9.2 Comparison by Application

Chart on Comparison by Application
Data Table on Comparison by Application

9.3 Passenger cars - Market size and forecast 2024-2029

Chart on Passenger cars - Market size and forecast 2024-2029 ($ million)
Data Table on Passenger cars - Market size and forecast 2024-2029 ($ million)
Chart on Passenger cars - Year-over-year growth 2024-2029 (%)
Data Table on Passenger cars - Year-over-year growth 2024-2029 (%)

9.4 Commercial vehicles - Market size and forecast 2024-2029

Chart on Commercial vehicles - Market size and forecast 2024-2029 ($ million)
Data Table on Commercial vehicles - Market size and forecast 2024-2029 ($ million)
Chart on Commercial vehicles - Year-over-year growth 2024-2029 (%)
Data Table on Commercial vehicles - Year-over-year growth 2024-2029 (%)

9.5 Market opportunity by Application

Market opportunity by Application ($ million)
Data Table on Market opportunity by Application ($ million)

10. Market Segmentation by Material

10.1 Market segments

Chart on Material - Market share 2024-2029 (%)
Data Table on Material - Market share 2024-2029 (%)

10.2 Comparison by Material

Chart on Comparison by Material
Data Table on Comparison by Material

10.3 Steel - Market size and forecast 2024-2029

Chart on Steel - Market size and forecast 2024-2029 ($ million)
Data Table on Steel - Market size and forecast 2024-2029 ($ million)
Chart on Steel - Year-over-year growth 2024-2029 (%)
Data Table on Steel - Year-over-year growth 2024-2029 (%)

10.4 Aluminum - Market size and forecast 2024-2029

Chart on Aluminum - Market size and forecast 2024-2029 ($ million)
Data Table on Aluminum - Market size and forecast 2024-2029 ($ million)
Chart on Aluminum - Year-over-year growth 2024-2029 (%)
Data Table on Aluminum - Year-over-year growth 2024-2029 (%)

10.5 Carbon fiber composites - Market size and forecast 2024-2029

Chart on Carbon fiber composites - Market size and forecast 2024-2029 ($ million)
Data Table on Carbon fiber composites - Market size and forecast 2024-2029 ($ million)
Chart on Carbon fiber composites - Year-over-year growth 2024-2029 (%)
Data Table on Carbon fiber composites - Year-over-year growth 2024-2029 (%)

10.6 Market opportunity by Material

Market opportunity by Material ($ million)
Data Table on Market opportunity by Material ($ million)

11. Customer Landscape

11.1 Customer landscape overview

Analysis of price sensitivity, lifecycle, customer purchase basket, adoption rates, and purchase criteria

12. Geographic Landscape

12.1 Geographic segmentation

Chart on Market share by geography 2024-2029 (%)
Data Table on Market share by geography 2024-2029 (%)

12.2 Geographic comparison

Chart on Geographic comparison
Data Table on Geographic comparison

12.3 APAC - Market size and forecast 2024-2029

Chart on APAC - Market size and forecast 2024-2029 ($ million)
Data Table on APAC - Market size and forecast 2024-2029 ($ million)
Chart on APAC - Year-over-year growth 2024-2029 (%)
Data Table on APAC - Year-over-year growth 2024-2029 (%)
Chart on Regional Comparison - APAC
Data Table on Regional Comparison - APAC

12.3.1 China - Market size and forecast 2024-2029

Chart on China - Market size and forecast 2024-2029 ($ million)
Data Table on China - Market size and forecast 2024-2029 ($ million)
Chart on China - Year-over-year growth 2024-2029 (%)
Data Table on China - Year-over-year growth 2024-2029 (%)

12.3.2 Japan - Market size and forecast 2024-2029

Chart on Japan - Market size and forecast 2024-2029 ($ million)
Data Table on Japan - Market size and forecast 2024-2029 ($ million)
Chart on Japan - Year-over-year growth 2024-2029 (%)
Data Table on Japan - Year-over-year growth 2024-2029 (%)

12.3.3 India - Market size and forecast 2024-2029

Chart on India - Market size and forecast 2024-2029 ($ million)
Data Table on India - Market size and forecast 2024-2029 ($ million)
Chart on India - Year-over-year growth 2024-2029 (%)
Data Table on India - Year-over-year growth 2024-2029 (%)

12.3.4 South Korea - Market size and forecast 2024-2029

Chart on South Korea - Market size and forecast 2024-2029 ($ million)
Data Table on South Korea - Market size and forecast 2024-2029 ($ million)
Chart on South Korea - Year-over-year growth 2024-2029 (%)
Data Table on South Korea - Year-over-year growth 2024-2029 (%)

12.3.5 Australia - Market size and forecast 2024-2029

Chart on Australia - Market size and forecast 2024-2029 ($ million)
Data Table on Australia - Market size and forecast 2024-2029 ($ million)
Chart on Australia - Year-over-year growth 2024-2029 (%)
Data Table on Australia - Year-over-year growth 2024-2029 (%)

12.3.6 Indonesia - Market size and forecast 2024-2029

Chart on Indonesia - Market size and forecast 2024-2029 ($ million)
Data Table on Indonesia - Market size and forecast 2024-2029 ($ million)
Chart on Indonesia - Year-over-year growth 2024-2029 (%)
Data Table on Indonesia - Year-over-year growth 2024-2029 (%)

12.4 Europe - Market size and forecast 2024-2029

Chart on Europe - Market size and forecast 2024-2029 ($ million)
Data Table on Europe - Market size and forecast 2024-2029 ($ million)
Chart on Europe - Year-over-year growth 2024-2029 (%)
Data Table on Europe - Year-over-year growth 2024-2029 (%)
Chart on Regional Comparison - Europe
Data Table on Regional Comparison - Europe

12.4.1 Germany - Market size and forecast 2024-2029

Chart on Germany - Market size and forecast 2024-2029 ($ million)
Data Table on Germany - Market size and forecast 2024-2029 ($ million)
Chart on Germany - Year-over-year growth 2024-2029 (%)
Data Table on Germany - Year-over-year growth 2024-2029 (%)

12.4.2 UK - Market size and forecast 2024-2029

Chart on UK - Market size and forecast 2024-2029 ($ million)
Data Table on UK - Market size and forecast 2024-2029 ($ million)
Chart on UK - Year-over-year growth 2024-2029 (%)
Data Table on UK - Year-over-year growth 2024-2029 (%)

12.4.3 France - Market size and forecast 2024-2029

Chart on France - Market size and forecast 2024-2029 ($ million)
Data Table on France - Market size and forecast 2024-2029 ($ million)
Chart on France - Year-over-year growth 2024-2029 (%)
Data Table on France - Year-over-year growth 2024-2029 (%)

12.4.4 Italy - Market size and forecast 2024-2029

Chart on Italy - Market size and forecast 2024-2029 ($ million)
Data Table on Italy - Market size and forecast 2024-2029 ($ million)
Chart on Italy - Year-over-year growth 2024-2029 (%)
Data Table on Italy - Year-over-year growth 2024-2029 (%)

12.4.5 Spain - Market size and forecast 2024-2029

Chart on Spain - Market size and forecast 2024-2029 ($ million)
Data Table on Spain - Market size and forecast 2024-2029 ($ million)
Chart on Spain - Year-over-year growth 2024-2029 (%)
Data Table on Spain - Year-over-year growth 2024-2029 (%)

12.4.6 The Netherlands - Market size and forecast 2024-2029

Chart on The Netherlands - Market size and forecast 2024-2029 ($ million)
Data Table on The Netherlands - Market size and forecast 2024-2029 ($ million)
Chart on The Netherlands - Year-over-year growth 2024-2029 (%)
Data Table on The Netherlands - Year-over-year growth 2024-2029 (%)

12.5 North America - Market size and forecast 2024-2029

Chart on North America - Market size and forecast 2024-2029 ($ million)
Data Table on North America - Market size and forecast 2024-2029 ($ million)
Chart on North America - Year-over-year growth 2024-2029 (%)
Data Table on North America - Year-over-year growth 2024-2029 (%)
Chart on Regional Comparison - North America
Data Table on Regional Comparison - North America

12.5.1 US - Market size and forecast 2024-2029

Chart on US - Market size and forecast 2024-2029 ($ million)
Data Table on US - Market size and forecast 2024-2029 ($ million)
Chart on US - Year-over-year growth 2024-2029 (%)
Data Table on US - Year-over-year growth 2024-2029 (%)

12.5.2 Canada - Market size and forecast 2024-2029

Chart on Canada - Market size and forecast 2024-2029 ($ million)
Data Table on Canada - Market size and forecast 2024-2029 ($ million)
Chart on Canada - Year-over-year growth 2024-2029 (%)
Data Table on Canada - Year-over-year growth 2024-2029 (%)

12.5.3 Mexico - Market size and forecast 2024-2029

Chart on Mexico - Market size and forecast 2024-2029 ($ million)
Data Table on Mexico - Market size and forecast 2024-2029 ($ million)
Chart on Mexico - Year-over-year growth 2024-2029 (%)
Data Table on Mexico - Year-over-year growth 2024-2029 (%)

12.6 South America - Market size and forecast 2024-2029

Chart on South America - Market size and forecast 2024-2029 ($ million)
Data Table on South America - Market size and forecast 2024-2029 ($ million)
Chart on South America - Year-over-year growth 2024-2029 (%)
Data Table on South America - Year-over-year growth 2024-2029 (%)
Chart on Regional Comparison - South America
Data Table on Regional Comparison - South America

12.6.1 Brazil - Market size and forecast 2024-2029

Chart on Brazil - Market size and forecast 2024-2029 ($ million)
Data Table on Brazil - Market size and forecast 2024-2029 ($ million)
Chart on Brazil - Year-over-year growth 2024-2029 (%)
Data Table on Brazil - Year-over-year growth 2024-2029 (%)

12.6.2 Argentina - Market size and forecast 2024-2029

Chart on Argentina - Market size and forecast 2024-2029 ($ million)
Data Table on Argentina - Market size and forecast 2024-2029 ($ million)
Chart on Argentina - Year-over-year growth 2024-2029 (%)
Data Table on Argentina - Year-over-year growth 2024-2029 (%)

12.6.3 Chile - Market size and forecast 2024-2029

Chart on Chile - Market size and forecast 2024-2029 ($ million)
Data Table on Chile - Market size and forecast 2024-2029 ($ million)
Chart on Chile - Year-over-year growth 2024-2029 (%)
Data Table on Chile - Year-over-year growth 2024-2029 (%)

12.7 Middle East and Africa - Market size and forecast 2024-2029

Chart on Middle East and Africa - Market size and forecast 2024-2029 ($ million)
Data Table on Middle East and Africa - Market size and forecast 2024-2029 ($ million)
Chart on Middle East and Africa - Year-over-year growth 2024-2029 (%)
Data Table on Middle East and Africa - Year-over-year growth 2024-2029 (%)
Chart on Regional Comparison - Middle East and Africa
Data Table on Regional Comparison - Middle East and Africa

12.7.1 UAE - Market size and forecast 2024-2029

Chart on UAE - Market size and forecast 2024-2029 ($ million)
Data Table on UAE - Market size and forecast 2024-2029 ($ million)
Chart on UAE - Year-over-year growth 2024-2029 (%)
Data Table on UAE - Year-over-year growth 2024-2029 (%)

12.7.2 Saudi Arabia - Market size and forecast 2024-2029

Chart on Saudi Arabia - Market size and forecast 2024-2029 ($ million)
Data Table on Saudi Arabia - Market size and forecast 2024-2029 ($ million)
Chart on Saudi Arabia - Year-over-year growth 2024-2029 (%)
Data Table on Saudi Arabia - Year-over-year growth 2024-2029 (%)

12.7.3 South Africa - Market size and forecast 2024-2029

Chart on South Africa - Market size and forecast 2024-2029 ($ million)
Data Table on South Africa - Market size and forecast 2024-2029 ($ million)
Chart on South Africa - Year-over-year growth 2024-2029 (%)
Data Table on South Africa - Year-over-year growth 2024-2029 (%)

12.7.4 Egypt - Market size and forecast 2024-2029

Chart on Egypt - Market size and forecast 2024-2029 ($ million)
Data Table on Egypt - Market size and forecast 2024-2029 ($ million)
Chart on Egypt - Year-over-year growth 2024-2029 (%)
Data Table on Egypt - Year-over-year growth 2024-2029 (%)

12.7.5 Nigeria - Market size and forecast 2024-2029

Chart on Nigeria - Market size and forecast 2024-2029 ($ million)
Data Table on Nigeria - Market size and forecast 2024-2029 ($ million)
Chart on Nigeria - Year-over-year growth 2024-2029 (%)
Data Table on Nigeria - Year-over-year growth 2024-2029 (%)

12.8 Market opportunity by geography

Market opportunity by geography ($ million)
Data Tables on Market opportunity by geography ($ million)

13. Drivers, Challenges, and Opportunity

13.1 Market drivers

Increasing adoption of advanced chassis design leads to the reduced weight of vehicles
Mass production of monocoque chassis using advanced robotics manufacturing
Stringent regulations to control emissions

13.2 Market challenges

New product development leading to a reduction in the platform lifecycle
Fluctuating costs of raw materials
Increasing popularity of shared mobility negatively impacted the vehicle ownership

13.3 Impact of drivers and challenges

Impact of drivers and challenges in 2024 and 2029

13.4 Market opportunities

Growing popularity of carbon monocoque chassis
Development of titanium-based chassis
Development of multi-material chassis construction

14. Competitive Landscape

14.1 Overview

14.2

Overview on criticality of inputs and factors of differentiation

14.3 Landscape disruption

Overview on factors of disruption

14.4 Industry risks

Impact of key risks on business

15. Competitive Analysis

15.1 Companies profiled

Companies covered

15.2 Company ranking index

15.3 Market positioning of companies

Matrix on companies position and classification

15.4 AISIN Corp.

AISIN Corp. - Overview
AISIN Corp. - Business segments
AISIN Corp. - Key news
AISIN Corp. - Key offerings
AISIN Corp. - Segment focus
SWOT

15.5 ALF Engineering Pvt. Ltd.

ALF Engineering Pvt. Ltd. - Overview
ALF Engineering Pvt. Ltd. - Product / Service
ALF Engineering Pvt. Ltd. - Key offerings
SWOT

15.6 American Axle and Manufacturing Inc.

American Axle and Manufacturing Inc. - Overview
American Axle and Manufacturing Inc. - Business segments
American Axle and Manufacturing Inc. - Key news
American Axle and Manufacturing Inc. - Key offerings
American Axle and Manufacturing Inc. - Segment focus
SWOT

15.7 Autokiniton US Holdings Inc.

Autokiniton US Holdings Inc. - Overview
Autokiniton US Holdings Inc. - Product / Service
Autokiniton US Holdings Inc. - Key offerings
SWOT

15.8 Benteler International AG

Benteler International AG - Overview
Benteler International AG - Product / Service
Benteler International AG - Key news
Benteler International AG - Key offerings
SWOT

15.9 BWI Group

BWI Group - Overview
BWI Group - Product / Service
BWI Group - Key offerings
SWOT

15.10 CIE Automotive SA

CIE Automotive SA - Overview
CIE Automotive SA - Business segments
CIE Automotive SA - Key offerings
CIE Automotive SA - Segment focus
SWOT

15.11 Continental AG

Continental AG - Overview
Continental AG - Business segments
Continental AG - Key news
Continental AG - Key offerings
Continental AG - Segment focus
SWOT

15.12 DuPont de Nemours Inc.

DuPont de Nemours Inc. - Overview
DuPont de Nemours Inc. - Business segments
DuPont de Nemours Inc. - Key news
DuPont de Nemours Inc. - Key offerings
DuPont de Nemours Inc. - Segment focus
SWOT

15.13 FEV Group GmbH

FEV Group GmbH - Overview
FEV Group GmbH - Product / Service
FEV Group GmbH - Key offerings
SWOT

15.14 Hyundai Motor Co.

Hyundai Motor Co. - Overview
Hyundai Motor Co. - Business segments
Hyundai Motor Co. - Key news
Hyundai Motor Co. - Key offerings
Hyundai Motor Co. - Segment focus
SWOT

15.15 KLT Automotive and Tubular Products Ltd.

KLT Automotive and Tubular Products Ltd. - Overview
KLT Automotive and Tubular Products Ltd. - Product / Service
KLT Automotive and Tubular Products Ltd. - Key offerings
SWOT

15.16 Magna International Inc.

Magna International Inc. - Overview
Magna International Inc. - Business segments
Magna International Inc. - Key news
Magna International Inc. - Key offerings
Magna International Inc. - Segment focus
SWOT

15.17 Schaeffler AG

Schaeffler AG - Overview
Schaeffler AG - Business segments
Schaeffler AG - Key news
Schaeffler AG - Key offerings
Schaeffler AG - Segment focus
SWOT

15.18 ZF Friedrichshafen AG

ZF Friedrichshafen AG - Overview
ZF Friedrichshafen AG - Business segments
ZF Friedrichshafen AG - Key news
ZF Friedrichshafen AG - Key offerings
ZF Friedrichshafen AG - Segment focus
SWOT

16. Appendix

16.1 Scope of the report

Market definition
Objectives
Notes and caveats

16.2 Inclusions and exclusions checklist

Inclusions checklist
Exclusions checklist

16.3 Currency conversion rates for US$

16.4 Research methodology

16.5 Data procurement

Information sources

16.6 Data validation

16.7 Validation techniques employed for market sizing

16.8 Data synthesis

16.9 360 degree market analysis

16.10 List of abbreviations

Research Methodology

Technavio presents a detailed picture of the market by way of study, synthesis, and summation of data from multiple sources. The analysts have presented the various facets of the market with a particular focus on identifying the key industry influencers. The data thus presented is comprehensive, reliable, and the result of extensive research, both primary and secondary.

INFORMATION SOURCES

Primary sources

  • Manufacturers and suppliers
  • Channel partners
  • Industry experts
  • Strategic decision makers

Secondary sources

  • Industry journals and periodicals
  • Government data
  • Financial reports of key industry players
  • Historical data
  • Press releases

DATA ANALYSIS

Data Synthesis

  • Collation of data
  • Estimation of key figures
  • Analysis of derived insights

Data Validation

  • Triangulation with data models
  • Reference against proprietary databases
  • Corroboration with industry experts

REPORT WRITING

Qualitative

  • Market drivers
  • Market challenges
  • Market trends
  • Five forces analysis

Quantitative

  • Market size and forecast
  • Market segmentation
  • Geographical insights
  • Competitive landscape

Interested in this report?

Get your sample now to see our research methodology and insights!

Download Now

Frequently Asked Questions

Automotive Chassis market growth will increase by USD 35393.0 million during 2025-2029.

The Automotive Chassis market is expected to grow at a CAGR of 10% during 2025-2029.

Automotive Chassis market is segmented by Type (Monocoque chassis, Ladder chassis, Others) Application (Passenger cars, Commercial vehicles) Material (Steel, Aluminum, Carbon fiber composites)

AISIN Corp., ALF Engineering Pvt. Ltd., American Axle and Manufacturing Inc., Autokiniton US Holdings Inc., Benteler International AG, BWI Group, CIE Automotive SA, Continental AG, DuPont de Nemours Inc., FEV Group GmbH, Hyundai Motor Co., KLT Automotive and Tubular Products Ltd., Magna International Inc., Rausch and Pausch SE, Schaeffler AG, Surin Automotive P Ltd., Tenneco Inc., ZF Friedrichshafen AG are a few of the key vendors in the Automotive Chassis market.

APAC will register the highest growth rate of 54.2% among the other regions. Therefore, the Automotive Chassis market in APAC is expected to garner significant business opportunities for the vendors during the forecast period.

China, Japan, India, South Korea, Australia, Indonesia, Germany, UK, France, Italy, Spain, The Netherlands, US, Canada, Mexico, Brazil, Argentina, Chile, UAE, Saudi Arabia, South Africa, Egypt, Nigeria

  • Increasing adoption of advanced chassis design leads to the reduced weight of vehicles is the driving factor this market.

The Automotive Chassis market vendors should focus on grabbing business opportunities from the Type segment as it accounted for the largest market share in the base year.