Automotive Driver Monitoring Market Analysis, Size, and Forecast 2024-2028: North America (Canada and Mexico), Europe (France, Germany, and UK), Middle East and Africa (UAE), APAC (Australia, China, India, Japan, and South Korea), South America (Brazil), and Rest of World (ROW)

Automotive Driver Monitoring Market Analysis, Size, and Forecast 2024-2028:
North America (Canada and Mexico), Europe (France, Germany, and UK), Middle East and Africa (UAE), APAC (Australia, China, India, Japan, and South Korea), South America (Brazil), and Rest of World (ROW)

Published: May 2024 177 Pages SKU: IRTNTR74213

Market Overview at a Glance

$1.73 B
Market Opportunity
9.45%
CAGR
8.42
YoY growth 2023-2024(%)

Automotive Driver Monitoring Market Size 2024-2028

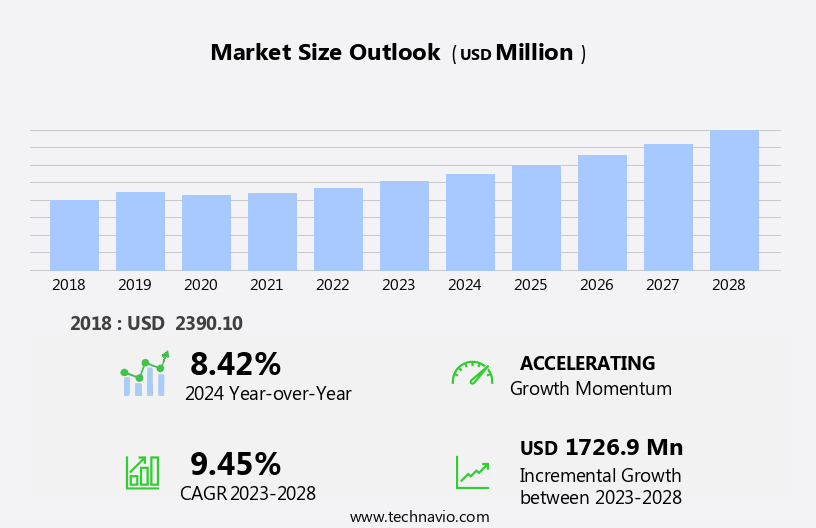
The automotive driver monitoring market size is forecast to increase by USD 1.73 billion at a CAGR of 9.45% between 2023 and 2028.

  • The market is witnessing significant growth due to the safety benefits offered by in-vehicle driver monitoring systems. These systems, which include features such as drowsiness detection, attention monitoring, and facial recognition, are becoming increasingly important as road safety becomes a top priority for automakers and governments worldwide. Another key driver for the market is the continuous advances in driver-state monitoring technologies. These innovations enable more accurate and reliable detection of driver fatigue, distraction, and other potential safety risks.
  • For instance, some systems use advanced machine learning algorithms to analyze facial expressions, eye movements, and other behavioral patterns to assess driver alertness. However, the market also faces challenges related to data protection and privacy concerns. As these systems collect and process sensitive information about drivers, ensuring the security and confidentiality of this data security is crucial. There have been instances of driver monitoring data being accessed without consent, leading to potential misuse or exploitation. Addressing these concerns through robust data protection policies and transparent communication with customers will be essential for market players to build trust and maintain long-term success in the market.

What will be the Size of the Automotive Driver Monitoring Market during the forecast period?

Automotive Driver Monitoring Market Size

 Request Free Sample

  • The market continues to evolve, driven by the development of advanced technologies for self-driving vehicles and the growing emphasis on driver state sensing systems. Key players in this complex market include Renesas Electronics Corporation and Texas Instruments Incorporated, among others. The market spans various sectors, from passenger cars to heavy commercial vehicles, with applications ranging from level 4 autonomous driving to the autonomous truck market. Policies and regulations are shaping the market dynamics, with a focus on enhancing safety and reducing accidents. For instance, heart rate monitoring, eye tracking, and head pose analysis using cameras and infrared LEDs are gaining traction in the industry.
  • Moreover, the integration of artificial intelligence and sensor technologies, such as ultrasonic sensors and FOVID EDME, is revolutionizing vehicle control analysis and driver health monitoring. The future outlook of the market is promising, with the increasing adoption of autonomous vehicles and the growing demand for advanced safety features. However, the high initial cost and competition scenario pose challenges to market growth. The market's structure is intricate, with OEMs, aftermarket players, and component suppliers vying for a share. Nikhil Kaitwade, a principal consultant, emphasizes the importance of driver monitoring systems in ensuring safety, especially on country roads and highways.
  • The sales channel for these systems is expanding, with cloud-based systems and internet-based platforms gaining popularity. The transportation of goods is also a significant application area, with the autonomous truck market poised for growth. The historical pattern of the market shows a steady increase in demand for driver monitoring systems, driven by the need for improved safety and the increasing prevalence of self-driving vehicles. However, the market's evolution is ongoing, with new technologies and applications continually emerging. The competition scenario is intense, with companies continually innovating to stay ahead. The safety dynamics of the market are intricately linked to the development of autonomous vehicles and the implementation of safety features, such as steering wheel control analysis, facial expression analysis, and respiration rate monitoring.

How is this Automotive Driver Monitoring Industry segmented?

The automotive driver monitoring industry research report provides comprehensive data (region-wise segment analysis), with forecasts and estimates in "USD million" for the period 2024-2028, as well as historical data from 2018-2022 for the following segments.

  • Type
    • Driver state monitoring
    • Driver health monitoring
  • Application
    • Commercial vehicles
    • Passenger cars
  • Technology
    • Camera-Based
    • Sensor-Based
    • Hybrid Systems
  • Sale Channel
    • OEM
    • Aftermarket
  • Geography
    • North America
      • US
      • Canada
      • Mexico
    • Europe
      • France
      • Germany
      • UK
    • Middle East and Africa
      • UAE
    • APAC
      • Australia
      • China
      • India
      • Japan
      • South Korea
    • South America
      • Brazil
    • Rest of World (ROW)

By Type Insights

The driver state monitoring segment is estimated to witness significant growth during the forecast period.

Driver state monitoring, an integral component of driver wellness systems, continuously assesses and identifies driver drowsiness, fatigue, and distraction. With the growing time spent behind the wheel due to increasing population and road traffic, particularly in countries like the US, China, Japan, and India, this system plays a crucial role in enhancing road safety. The global vehicle market's expansion is leading to a surge in the number of vehicles on the road, further increasing the need for advanced driver monitoring systems. The expanding road network and infrastructure improvements encourage self-drive outstation trips, necessitating constant driver attention. Light commercial vehicles and passenger cars are increasingly adopting driver state monitoring systems, integrating technologies such as head pose analysis, eye tracking, cameras, and safety dynamics.

These systems employ components like sensors, infrared LEDs, and ultrasonic sensors to monitor driver health indicators, including heart rate, skin conductance, and respiration rate. Renowned technology companies, such as Seeing Machines, Renesas Electronics Corporation, and Texas Instruments Incorporated, are key players in this market. Autonomous vehicles, including self-driving cars and trucks, are also incorporating advanced driver monitoring systems for level 3 and level 4 autonomous driving. These systems use artificial intelligence, facial expression analysis, and vehicle control analysis to ensure driver engagement and takeover readiness. Policies and regulations regarding autonomous vehicles and transportation of goods are evolving, with cloud systems and internet-based platforms facilitating real-time driver monitoring and data analysis.

The complex structure of driver state monitoring systems requires a high initial cost, but the potential for reducing accidents and enhancing overall vehicle safety justifies the investment. As the market continues to evolve, competition intensifies, with OEMs and aftermarket players vying for market share. The future outlook is promising, with advancements in vehicle propulsion, vehicle safety systems, and driver health monitoring.

Automotive Driver Monitoring Market Size

Request Free Sample

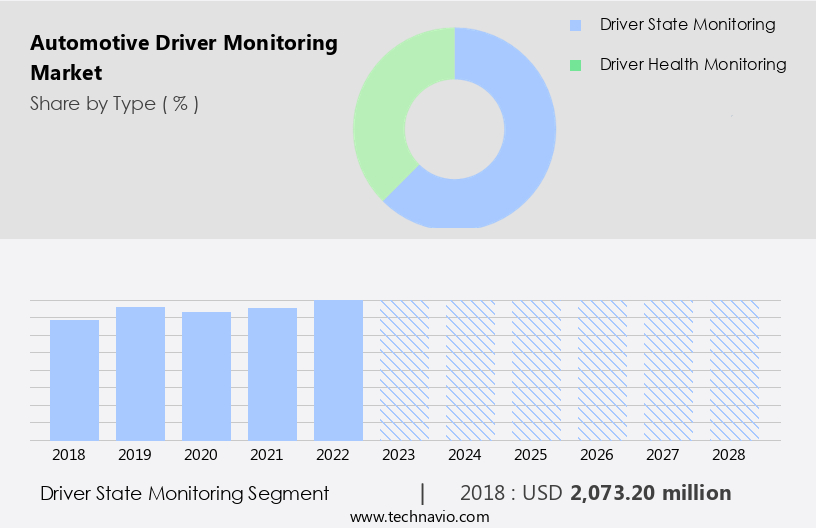
The Driver state monitoring segment was valued at USD 2.07 billion in 2018 and showed a gradual increase during the forecast period.

Regional Analysis

Europe is estimated to contribute 37% to the growth of the global market during the forecast period.Technavio's analysts have elaborately explained the regional trends and drivers that shape the market during the forecast period.

Automotive Driver Monitoring Market Share by Geography

 Request Free Sample

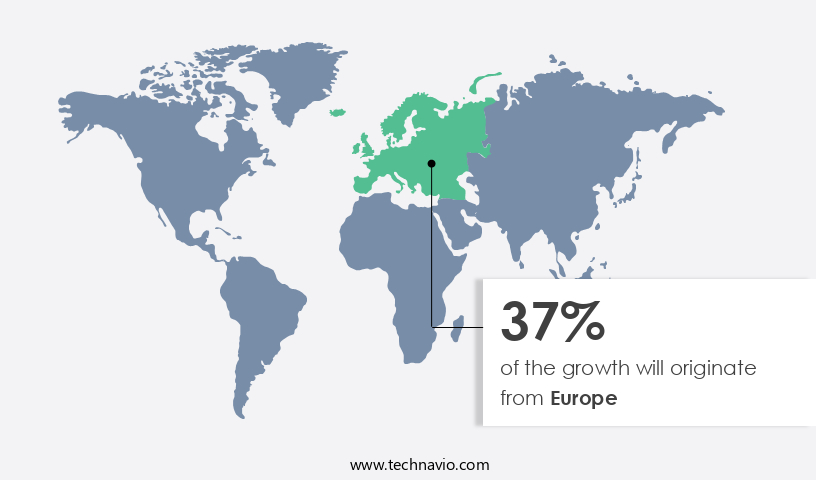
The European the market is experiencing significant growth due to the widespread adoption of advanced driver-assisted systems and safety features in locally manufactured vehicles. Major contributors to this market include Germany, France, Italy, Spain, and the UK. These countries, known for their production of luxury and premium automobiles, exhibit the highest penetration rate of advanced safety technologies. Economic improvement in Europe is further fueling market growth. Stringent vehicle safety regulations established by the European Commission are a crucial factor driving the market's expansion. Advanced systems, such as Head Pose Analysis, Eye Tracking, and Cameras, are integrated into vehicles for Driver State Sensing, ensuring improved safety and reducing accidents.

Companies like Renesas Electronics Corporation, Texas Instruments Incorporated, and Seeing Machines are key players in the market, providing components for Driver Monitoring Systems. The market's complex structure includes Cloud Systems, Sensors, and Artificial Intelligence, all working together to enhance Vehicle Safety Systems, including those for Electric and Light Commercial Vehicles. The future outlook is promising, with advancements in technologies like Facial Expression Analysis, Heart Rate Monitoring, and Skin Conductance Monitoring. Despite the high initial cost, the competition scenario remains intense, with OEMs and Aftermarket players vying for market share. The transportation of goods and passenger cars both benefit from these safety features, making the market a significant player in the European automotive industry.

Market Dynamics

Our researchers analyzed the data with 2023 as the base year, along with the key drivers, trends, and challenges. A holistic analysis of drivers will help companies refine their marketing strategies to gain a competitive advantage.

What are the key market drivers leading to the rise in the adoption of Automotive Driver Monitoring Industry?

  • The significance of in-vehicle driver monitoring systems in enhancing road safety is the primary market driver. These systems, which employ various technologies to monitor and analyze a driver's behavior and alert them to potential hazards, have gained increasing importance due to their potential to reduce accidents and save lives. Thus, the safety benefits are the key motivating factor for the market growth in this sector. 
  • The market is experiencing significant growth due to the increasing prioritization of safety features in vehicles. These systems, which include Respiration Rate Monitoring and Facial Expression Analysis, play a crucial role in ensuring driver health and alertness. By monitoring driving states and physiological conditions, these systems can prevent accidents caused by exhausted or distracted drivers. Furthermore, with the rise of Electric Vehicles and the development of Level 3 Autonomous Driving, driver monitoring systems will become increasingly important for both passenger and commercial vehicles. These systems can send alerts through audio or visual means if the driver is found to be in an unfit condition to drive.
  • Driver health monitoring is becoming a vital component of modern vehicles, as the well-being of drivers significantly impacts the safety of their passengers and other road users. Internet-Based Systems and Ultrasonic Sensors are some of the technologies driving the advancement of these systems. The integration of these features into vehicles enhances overall safety and provides peace of mind for consumers.

What are the market trends shaping the Automotive Driver Monitoring Industry?

  • Advances in driver-monitoring systems are currently shaping the automotive market trend. This technology, which includes features such as drowsiness detection, facial recognition, and attention monitoring, is becoming increasingly important for enhancing road safety and improving the overall driving experience.
  • The market is experiencing significant advancements, fueling its growth in the coming years. companies are introducing sophisticated systems that employ technologies like Head Pose Analysis and Eye Tracking for enhanced safety and control. These systems utilize cameras and sensors to monitor drivers' health and behavior, offering real-time vehicle control analysis and safety dynamics. Additionally, the integration of cloud systems and artificial intelligence (AI) enhances the functionality of these systems. However, the high initial cost associated with these technologies may pose a challenge to market growth.
  • Nonetheless, the integration of advanced features like facial recognition and health monitoring is expected to attract a growing number of customers, particularly in the Light Commercial Vehicles (LCV) segment. These systems use AI to recognize driver states, intentions, and activities, ensuring a more enjoyable and secure driving experience. Consequently, The market is poised for robust expansion during the forecast period.

What challenges does the Automotive Driver Monitoring Industry face during its growth?

  • Data protection and privacy concerns represent a significant challenge to the industry's growth, necessitating robust measures to safeguard sensitive information and maintain trust with customers. 
  • Autonomous vehicles, including self-driving cars and trucks, are revolutionizing the automotive industry with their advanced driver state sensing systems. These systems, which utilize technologies such as heart rate monitoring, FOVID eDME, and Infrared LEDs, enable Level 4 autonomous driving by continuously monitoring and analyzing the driver's condition. However, the market dynamics of this emerging technology are complex. The driver monitoring market is witnessing significant growth due to the increasing demand for self-driving vehicles and the need for enhanced safety features. According to industry reports, the autonomous truck market is expected to grow at a robust rate, while the autonomous cars market is already experiencing substantial penetration, particularly in the premium vehicle segment.
  • Despite these opportunities, challenges persist. Policies and regulations regarding the use of driver monitoring systems vary across vehicle types and countries, and concerns over data privacy and cybersecurity threats can impede market growth. As the industry continues to evolve, it is crucial for key players to address these challenges and ensure the safe and secure implementation of driver monitoring systems in both self-driving cars and heavy commercial vehicles.

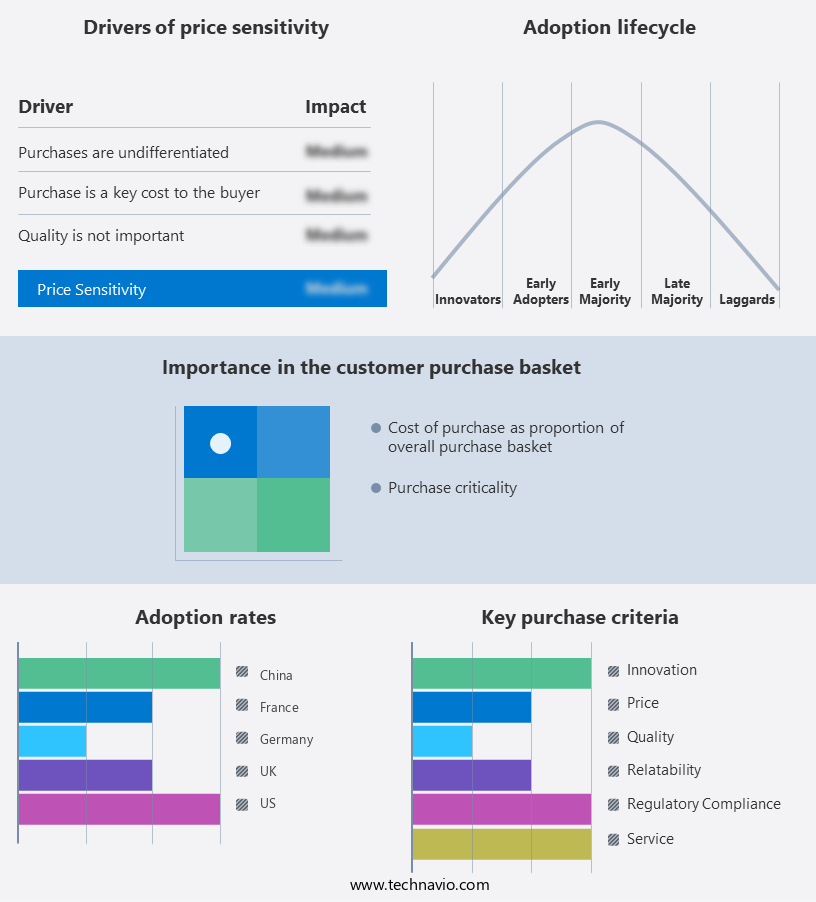
Exclusive Customer Landscape

The automotive driver monitoring market forecasting report includes the adoption lifecycle of the market, covering from the innovator's stage to the laggard's stage. It focuses on adoption rates in different regions based on penetration. Furthermore, the automotive driver monitoring market report also includes key purchase criteria and drivers of price sensitivity to help companies evaluate and develop their market growth analysis strategies.

Automotive Driver Monitoring Market Share by Geography

 Customer Landscape

Key Companies & Market Insights

Companies are implementing various strategies, such as strategic alliances, automotive driver monitoring market forecast, partnerships, mergers and acquisitions, geographical expansion, and product/service launches, to enhance their presence in the industry.

Continental AG - The company specializes in advanced driver monitoring systems for automotive applications. One such innovation is cabin sensing technology, designed to enhance automated driving capabilities. This system utilizes sophisticated sensors to detect and analyze driver behavior, ensuring optimal safety and comfort. .

The industry research and growth report includes detailed analyses of the competitive landscape of the market and information about key companies, including:

  • Continental AG
  • DENSO Corp.
  • Intel Corp.
  • Jabil Inc.
  • Magna International Inc.
  • Marelli Holdings Co. Ltd.
  • NetraDyne Inc.
  • NVIDIA Corp.
  • NXP Semiconductors NV
  • OmniVision Technologies Inc.
  • OMRON Corp.
  • Qualcomm Inc.
  • Robert Bosch GmbH
  • Stonkam Co. Ltd.
  • Tata Elxsi Ltd.
  • Tobii AB
  • Toyota Motor Corp.
  • Valeo SA
  • Veoneer Inc.
  • Visteon Corp.

Qualitative and quantitative analysis of companies has been conducted to help clients understand the wider business environment as well as the strengths and weaknesses of key industry players. Data is qualitatively analyzed to categorize companies as pure play, category-focused, industry-focused, and diversified; it is quantitatively analyzed to categorize companies as dominant, leading, strong, tentative, and weak.

Recent Development and News in Automotive Driver Monitoring Market

  • In February 2023, Bosch announced the launch of its new driver monitoring system, "Bosch Sensortec SBA60D120," which uses infrared sensors to monitor driver's vital signs and alert them if drowsiness is detected (Bosch press release). This system is expected to be integrated into various vehicle models, further expanding Bosch's presence in the market.
  • In June 2024, Magna International and Intel collaborated to develop a driver monitoring system with advanced facial recognition technology. This partnership aims to create a system that can detect driver distraction and drowsiness, as well as monitor the driver's emotional state (Intel newsroom). This strategic alliance combines Magna's automotive expertise with Intel's AI capabilities, potentially leading to a more advanced and competitive driver monitoring system.
  • In November 2024, Continental AG and NVIDIA announced a strategic partnership to develop an advanced driver monitoring system (ADAS) using NVIDIA's DRIVE AGX platform. This system can detect driver fatigue, distraction, and even monitor the driver's heart rate and eye movement (Continental AG press release). This collaboration represents a significant investment in the development of more advanced driver monitoring technologies, positioning Continental AG as a key player in the market.
  • In March 2025, the European Union passed a regulation mandating the installation of driver monitoring systems in all new commercial vehicles starting from 2027 (European Commission press release). This regulatory approval is expected to significantly boost the demand for driver monitoring systems in the European market, as commercial vehicle manufacturers scramble to comply with the new regulations.

Research Analyst Overview

The autonomous vehicles market is experiencing significant growth, with a focus on enhancing safety features through advanced driver state sensing systems. These systems incorporate technologies such as electroencephalogram (EEG) monitoring, heart rate monitoring, and facial expression analysis to assess driver health and attention levels. Steering wheel sensors and vehicle control analysis also play a crucial role in detecting driver drowsiness and preventing accidents. Cameras, head pose analysis, and eye tracking are essential components of driver monitoring systems, providing real-time data on driver behavior and alerting when necessary. Sales channels for these systems extend beyond traditional vehicle types, with internet-based systems gaining popularity for cross-state passenger traffic.

Artificial intelligence and machine learning algorithms are increasingly being integrated into driver monitoring systems, enabling more accurate analysis of driver health and behavior. Additionally, skin conductance monitoring and respiration rate monitoring offer new insights into driver wellbeing. The integration of these safety features into autonomous vehicles is crucial as the market continues to evolve, with a focus on reducing accidents and enhancing overall driving experience. Driver monitoring systems are becoming an essential component of the autonomous vehicle ecosystem, ensuring both driver and passenger safety.

Dive into Technavio's robust research methodology, blending expert interviews, extensive data synthesis, and validated models for unparalleled Automotive Driver Monitoring Market insights. See full methodology.

Market Scope

Report Coverage

Details

Page number

177

Base year

2023

Historic period

2018-2022

Forecast period

2024-2028

Growth momentum & CAGR

Accelerate at a CAGR of 9.45%

Market growth 2024-2028

USD 1726.9 million

Market structure

Fragmented

YoY growth 2023-2024(%)

8.42

Key countries

US, China, Germany, Japan, UK, Australia, India, France, Brazil, Canada, Brazil, UAE, Australia, Rest of World (ROW), Saudi Arabia, France, South Korea, and Mexico

Competitive landscape

Leading Companies, Market Positioning of Companies, Competitive Strategies, and Industry Risks

Request Free Sample

What are the Key Data Covered in this Automotive Driver Monitoring Market Research and Growth Report?

  • CAGR of the Automotive Driver Monitoring industry during the forecast period
  • Detailed information on factors that will drive the growth and forecasting between 2024 and 2028
  • Precise estimation of the size of the market and its contribution of the industry in focus to the parent market
  • Accurate predictions about upcoming growth and trends and changes in consumer behaviour
  • Growth of the market across Europe, North America, APAC, South America, and Middle East and Africa
  • Thorough analysis of the market's competitive landscape and detailed information about companies
  • Comprehensive analysis of factors that will challenge the automotive driver monitoring market growth of industry companies

We can help! Our analysts can customize this automotive driver monitoring market research report to meet your requirements.

Get in touch

1 Executive Summary

  • 1.1 Market overview
    • Executive Summary - Chart on Market Overview
    • Executive Summary - Data Table on Market Overview
    • Executive Summary - Chart on Global Market Characteristics
    • Executive Summary - Chart on Market by Geography
    • Executive Summary - Chart on Market Segmentation by Type
    • Executive Summary - Chart on Market Segmentation by Application
    • Executive Summary - Chart on Incremental Growth
    • Executive Summary - Data Table on Incremental Growth
    • Executive Summary - Chart on Company Market Positioning

2 Market Landscape

  • 2.1 Market ecosystem
    • Parent Market
    • Data Table on - Parent Market
  • 2.2 Market characteristics
    • Market characteristics analysis
  • 2.3 Value chain analysis
    • Value Chain Analysis

3 Market Sizing

  • 3.1 Market definition
    • Offerings of companies included in the market definition
  • 3.2 Market segment analysis
    • Market segments
  • 3.3 Market size 2023
    • 3.4 Market outlook: Forecast for 2023-2028
      • Chart on Global - Market size and forecast 2023-2028 ($ million)
      • Data Table on Global - Market size and forecast 2023-2028 ($ million)
      • Chart on Global Market: Year-over-year growth 2023-2028 (%)
      • Data Table on Global Market: Year-over-year growth 2023-2028 (%)

    4 Historic Market Size

    • 4.1 Global Automotive Driver Monitoring Market 2018 - 2022
      • Historic Market Size - Data Table on Global Automotive Driver Monitoring Market 2018 - 2022 ($ million)
    • 4.2 Type segment analysis 2018 - 2022
      • Historic Market Size - Type Segment 2018 - 2022 ($ million)
    • 4.3 Application segment analysis 2018 - 2022
      • Historic Market Size - Application Segment 2018 - 2022 ($ million)
    • 4.4 Geography segment analysis 2018 - 2022
      • Historic Market Size - Geography Segment 2018 - 2022 ($ million)
    • 4.5 Country segment analysis 2018 - 2022
      • Historic Market Size - Country Segment 2018 - 2022 ($ million)

    5 Five Forces Analysis

    • 5.1 Five forces summary
      • Five forces analysis - Comparison between 2023 and 2028
    • 5.2 Bargaining power of buyers
      • Bargaining power of buyers - Impact of key factors 2023 and 2028
    • 5.3 Bargaining power of suppliers
      • Bargaining power of suppliers - Impact of key factors in 2023 and 2028
    • 5.4 Threat of new entrants
      • Threat of new entrants - Impact of key factors in 2023 and 2028
    • 5.5 Threat of substitutes
      • Threat of substitutes - Impact of key factors in 2023 and 2028
    • 5.6 Threat of rivalry
      • Threat of rivalry - Impact of key factors in 2023 and 2028
    • 5.7 Market condition
      • Chart on Market condition - Five forces 2023 and 2028

    6 Market Segmentation by Type

    • 6.1 Market segments
      • Chart on Type - Market share (2023-2028) (%)
      • Data Table on Type - Market share (2023-2028) (%)
    • 6.2 Comparison by Type
      • Chart on Comparison by Type
      • Data Table on Comparison by Type
    • 6.3 Driver state monitoring - Market size and forecast (2023-2028)
      • Chart on Driver state monitoring - Market size and forecast (2023-2028) ($ million)
      • Data Table on Driver state monitoring - Market size and forecast (2023-2028) ($ million)
      • Chart on Driver state monitoring - Year-over-year growth (2023-2028) (%)
      • Data Table on Driver state monitoring - Year-over-year growth (2023-2028) (%)
    • 6.4 Driver health monitoring - Market size and forecast (2023-2028)
      • Chart on Driver health monitoring - Market size and forecast (2023-2028) ($ million)
      • Data Table on Driver health monitoring - Market size and forecast (2023-2028) ($ million)
      • Chart on Driver health monitoring - Year-over-year growth (2023-2028) (%)
      • Data Table on Driver health monitoring - Year-over-year growth (2023-2028) (%)
    • 6.5 Market opportunity by Type
      • Market opportunity by Type ($ million)
      • Data Table on Market opportunity by Type ($ million)

    7 Market Segmentation by Application

    • 7.1 Market segments
      • Chart on Application - Market share (2023-2028) (%)
      • Data Table on Application - Market share (2023-2028) (%)
    • 7.2 Comparison by Application
      • Chart on Comparison by Application
      • Data Table on Comparison by Application
    • 7.3 Commercial vehicles - Market size and forecast (2023-2028)
      • Chart on Commercial vehicles - Market size and forecast (2023-2028) ($ million)
      • Data Table on Commercial vehicles - Market size and forecast (2023-2028) ($ million)
      • Chart on Commercial vehicles - Year-over-year growth (2023-2028) (%)
      • Data Table on Commercial vehicles - Year-over-year growth (2023-2028) (%)
    • 7.4 Passenger cars - Market size and forecast (2023-2028)
      • Chart on Passenger cars - Market size and forecast (2023-2028) ($ million)
      • Data Table on Passenger cars - Market size and forecast (2023-2028) ($ million)
      • Chart on Passenger cars - Year-over-year growth (2023-2028) (%)
      • Data Table on Passenger cars - Year-over-year growth (2023-2028) (%)
    • 7.5 Market opportunity by Application
      • Market opportunity by Application ($ million)
      • Data Table on Market opportunity by Application ($ million)

    8 Market Segmentation by Technology

    • 8.1 Market segments
      • Chart on Technology - Market share (2023-2028) (%)
      • Data Table on Technology - Market share (2023-2028) (%)
    • 8.2 Comparison by Technology
      • Chart on Comparison by Technology
      • Data Table on Comparison by Technology
    • 8.3 Camera-Based - Market size and forecast (2023-2028)
      • Chart on Camera-Based - Market size and forecast (2023-2028) ($ million)
      • Data Table on Camera-Based - Market size and forecast (2023-2028) ($ million)
      • Chart on Camera-Based - Year-over-year growth (2023-2028) (%)
      • Data Table on Camera-Based - Year-over-year growth (2023-2028) (%)
    • 8.4 Sensor-Based - Market size and forecast (2023-2028)
      • Chart on Sensor-Based - Market size and forecast (2023-2028) ($ million)
      • Data Table on Sensor-Based - Market size and forecast (2023-2028) ($ million)
      • Chart on Sensor-Based - Year-over-year growth (2023-2028) (%)
      • Data Table on Sensor-Based - Year-over-year growth (2023-2028) (%)
    • 8.5 Hybrid Systems - Market size and forecast (2023-2028)
      • Chart on Hybrid Systems - Market size and forecast (2023-2028) ($ million)
      • Data Table on Hybrid Systems - Market size and forecast (2023-2028) ($ million)
      • Chart on Hybrid Systems - Year-over-year growth (2023-2028) (%)
      • Data Table on Hybrid Systems - Year-over-year growth (2023-2028) (%)
    • 8.6 Market opportunity by Technology
      • Market opportunity by Technology ($ million)
      • Data Table on Market opportunity by Technology ($ million)

    9 Market Segmentation by Sale Channel

    • 9.1 Market segments
      • Chart on Sale Channel - Market share (2023-2028) (%)
      • Data Table on Sale Channel - Market share (2023-2028) (%)
    • 9.2 Comparison by Sale Channel
      • Chart on Comparison by Sale Channel
      • Data Table on Comparison by Sale Channel
    • 9.3 OEM - Market size and forecast (2023-2028)
      • Chart on OEM - Market size and forecast (2023-2028) ($ million)
      • Data Table on OEM - Market size and forecast (2023-2028) ($ million)
      • Chart on OEM - Year-over-year growth (2023-2028) (%)
      • Data Table on OEM - Year-over-year growth (2023-2028) (%)
    • 9.4 Aftermarket - Market size and forecast (2023-2028)
      • Chart on Aftermarket - Market size and forecast (2023-2028) ($ million)
      • Data Table on Aftermarket - Market size and forecast (2023-2028) ($ million)
      • Chart on Aftermarket - Year-over-year growth (2023-2028) (%)
      • Data Table on Aftermarket - Year-over-year growth (2023-2028) (%)
    • 9.5 Market opportunity by Sale Channel
      • Market opportunity by Sale Channel ($ million)
      • Data Table on Market opportunity by Sale Channel ($ million)

    10 Customer Landscape

    • 10.1 Customer landscape overview
      • Analysis of price sensitivity, lifecycle, customer purchase basket, adoption rates, and purchase criteria

    11 Geographic Landscape

    • 11.1 Geographic segmentation
      • Chart on Market share by geography 2023-2028 (%)
      • Data Table on Market share by geography 2023-2028 (%)
    • 11.2 Geographic comparison
      • Chart on Geographic comparison
      • Data Table on Geographic comparison
    • 11.3 Europe - Market size and forecast (2023-2028)
      • Chart on Europe - Market size and forecast (2023-2028) ($ million)
      • Data Table on Europe - Market size and forecast (2023-2028) ($ million)
      • Chart on Europe - Year-over-year growth (2023-2028) (%)
      • Data Table on Europe - Year-over-year growth (2023-2028) (%)
      • Chart on Europe - Market size and forecast 2023-2028 ($ million)
      • Data Table on Europe - Market size and forecast 2023-2028 ($ million)
      • Chart on Europe - Year-over-year growth 2023-2028 (%)
      • Data Table on Europe - Year-over-year growth 2023-2028 (%)
    • 11.4 North America - Market size and forecast (2023-2028)
      • Chart on North America - Market size and forecast (2023-2028) ($ million)
      • Data Table on North America - Market size and forecast (2023-2028) ($ million)
      • Chart on North America - Year-over-year growth (2023-2028) (%)
      • Data Table on North America - Year-over-year growth (2023-2028) (%)
      • Chart on North America - Market size and forecast 2023-2028 ($ million)
      • Data Table on North America - Market size and forecast 2023-2028 ($ million)
      • Chart on North America - Year-over-year growth 2023-2028 (%)
      • Data Table on North America - Year-over-year growth 2023-2028 (%)
    • 11.5 APAC - Market size and forecast (2023-2028)
      • Chart on APAC - Market size and forecast (2023-2028) ($ million)
      • Data Table on APAC - Market size and forecast (2023-2028) ($ million)
      • Chart on APAC - Year-over-year growth (2023-2028) (%)
      • Data Table on APAC - Year-over-year growth (2023-2028) (%)
      • Chart on APAC - Market size and forecast 2023-2028 ($ million)
      • Data Table on APAC - Market size and forecast 2023-2028 ($ million)
      • Chart on APAC - Year-over-year growth 2023-2028 (%)
      • Data Table on APAC - Year-over-year growth 2023-2028 (%)
    • 11.6 South America - Market size and forecast (2023-2028)
      • Chart on South America - Market size and forecast (2023-2028) ($ million)
      • Data Table on South America - Market size and forecast (2023-2028) ($ million)
      • Chart on South America - Year-over-year growth (2023-2028) (%)
      • Data Table on South America - Year-over-year growth (2023-2028) (%)
      • Chart on South America - Market size and forecast 2023-2028 ($ million)
      • Data Table on South America - Market size and forecast 2023-2028 ($ million)
      • Chart on South America - Year-over-year growth 2023-2028 (%)
      • Data Table on South America - Year-over-year growth 2023-2028 (%)
    • 11.7 Middle East and Africa - Market size and forecast (2023-2028)
      • Chart on Middle East and Africa - Market size and forecast (2023-2028) ($ million)
      • Data Table on Middle East and Africa - Market size and forecast (2023-2028) ($ million)
      • Chart on Middle East and Africa - Year-over-year growth (2023-2028) (%)
      • Data Table on Middle East and Africa - Year-over-year growth (2023-2028) (%)
      • Chart on Middle East and Africa - Market size and forecast 2023-2028 ($ million)
      • Data Table on Middle East and Africa - Market size and forecast 2023-2028 ($ million)
      • Chart on Middle East and Africa - Year-over-year growth 2023-2028 (%)
      • Data Table on Middle East and Africa - Year-over-year growth 2023-2028 (%)
    • 11.8 US - Market size and forecast (2023-2028)
      • Chart on US - Market size and forecast (2023-2028) ($ million)
      • Data Table on US - Market size and forecast (2023-2028) ($ million)
      • Chart on US - Year-over-year growth (2023-2028) (%)
      • Data Table on US - Year-over-year growth (2023-2028) (%)
      • Chart on US - Market size and forecast 2023-2028 ($ million)
      • Data Table on US - Market size and forecast 2023-2028 ($ million)
      • Chart on US - Year-over-year growth 2023-2028 (%)
      • Data Table on US - Year-over-year growth 2023-2028 (%)
    • 11.9 China - Market size and forecast (2023-2028)
      • Chart on China - Market size and forecast (2023-2028) ($ million)
      • Data Table on China - Market size and forecast (2023-2028) ($ million)
      • Chart on China - Year-over-year growth (2023-2028) (%)
      • Data Table on China - Year-over-year growth (2023-2028) (%)
      • Chart on Germany - Market size and forecast 2023-2028 ($ million)
      • Data Table on Germany - Market size and forecast 2023-2028 ($ million)
      • Chart on Germany - Year-over-year growth 2023-2028 (%)
      • Data Table on Germany - Year-over-year growth 2023-2028 (%)
    • 11.10 Germany - Market size and forecast (2023-2028)
      • Chart on Germany - Market size and forecast (2023-2028) ($ million)
      • Data Table on Germany - Market size and forecast (2023-2028) ($ million)
      • Chart on Germany - Year-over-year growth (2023-2028) (%)
      • Data Table on Germany - Year-over-year growth (2023-2028) (%)
      • Chart on France - Market size and forecast 2023-2028 ($ million)
      • Data Table on France - Market size and forecast 2023-2028 ($ million)
      • Chart on France - Year-over-year growth 2023-2028 (%)
      • Data Table on France - Year-over-year growth 2023-2028 (%)
    • 11.11 Japan - Market size and forecast (2023-2028)
      • Chart on Japan - Market size and forecast (2023-2028) ($ million)
      • Data Table on Japan - Market size and forecast (2023-2028) ($ million)
      • Chart on Japan - Year-over-year growth (2023-2028) (%)
      • Data Table on Japan - Year-over-year growth (2023-2028) (%)
      • Chart on China - Market size and forecast 2023-2028 ($ million)
      • Data Table on China - Market size and forecast 2023-2028 ($ million)
      • Chart on China - Year-over-year growth 2023-2028 (%)
      • Data Table on China - Year-over-year growth 2023-2028 (%)
    • 11.12 UK - Market size and forecast (2023-2028)
      • Chart on UK - Market size and forecast (2023-2028) ($ million)
      • Data Table on UK - Market size and forecast (2023-2028) ($ million)
      • Chart on UK - Year-over-year growth (2023-2028) (%)
      • Data Table on UK - Year-over-year growth (2023-2028) (%)
      • Chart on UK - Market size and forecast 2023-2028 ($ million)
      • Data Table on UK - Market size and forecast 2023-2028 ($ million)
      • Chart on UK - Year-over-year growth 2023-2028 (%)
      • Data Table on UK - Year-over-year growth 2023-2028 (%)
    • 11.13 Australia - Market size and forecast (2023-2028)
      • Chart on Australia - Market size and forecast (2023-2028) ($ million)
      • Data Table on Australia - Market size and forecast (2023-2028) ($ million)
      • Chart on Australia - Year-over-year growth (2023-2028) (%)
      • Data Table on Australia - Year-over-year growth (2023-2028) (%)
      • Market opportunity by geography ($ million)
      • Data Tables on Market opportunity by geography ($ million)
    • 11.14 India - Market size and forecast (2023-2028)
      • Chart on India - Market size and forecast (2023-2028) ($ million)
      • Data Table on India - Market size and forecast (2023-2028) ($ million)
      • Chart on India - Year-over-year growth (2023-2028) (%)
      • Data Table on India - Year-over-year growth (2023-2028) (%)
    • 11.15 France - Market size and forecast (2023-2028)
      • Chart on France - Market size and forecast (2023-2028) ($ million)
      • Data Table on France - Market size and forecast (2023-2028) ($ million)
      • Chart on France - Year-over-year growth (2023-2028) (%)
      • Data Table on France - Year-over-year growth (2023-2028) (%)
    • 11.16 Brazil - Market size and forecast (2023-2028)
      • Chart on Brazil - Market size and forecast (2023-2028) ($ million)
      • Data Table on Brazil - Market size and forecast (2023-2028) ($ million)
      • Chart on Brazil - Year-over-year growth (2023-2028) (%)
      • Data Table on Brazil - Year-over-year growth (2023-2028) (%)
    • 11.17 Canada - Market size and forecast (2023-2028)
      • Chart on Canada - Market size and forecast (2023-2028) ($ million)
      • Data Table on Canada - Market size and forecast (2023-2028) ($ million)
      • Chart on Canada - Year-over-year growth (2023-2028) (%)
      • Data Table on Canada - Year-over-year growth (2023-2028) (%)
    • 11.18 UAE - Market size and forecast (2023-2028)
      • Chart on UAE - Market size and forecast (2023-2028) ($ million)
      • Data Table on UAE - Market size and forecast (2023-2028) ($ million)
      • Chart on UAE - Year-over-year growth (2023-2028) (%)
      • Data Table on UAE - Year-over-year growth (2023-2028) (%)
    • 11.19 Rest of World (ROW) - Market size and forecast (2023-2028)
      • Chart on Rest of World (ROW) - Market size and forecast (2023-2028) ($ million)
      • Data Table on Rest of World (ROW) - Market size and forecast (2023-2028) ($ million)
      • Chart on Rest of World (ROW) - Year-over-year growth (2023-2028) (%)
      • Data Table on Rest of World (ROW) - Year-over-year growth (2023-2028) (%)
    • 11.20 Saudi Arabia - Market size and forecast (2023-2028)
      • Chart on Saudi Arabia - Market size and forecast (2023-2028) ($ million)
      • Data Table on Saudi Arabia - Market size and forecast (2023-2028) ($ million)
      • Chart on Saudi Arabia - Year-over-year growth (2023-2028) (%)
      • Data Table on Saudi Arabia - Year-over-year growth (2023-2028) (%)
    • 11.21 South Korea - Market size and forecast (2023-2028)
      • Chart on South Korea - Market size and forecast (2023-2028) ($ million)
      • Data Table on South Korea - Market size and forecast (2023-2028) ($ million)
      • Chart on South Korea - Year-over-year growth (2023-2028) (%)
      • Data Table on South Korea - Year-over-year growth (2023-2028) (%)
    • 11.22 Mexico - Market size and forecast (2023-2028)
      • Chart on Mexico - Market size and forecast (2023-2028) ($ million)
      • Data Table on Mexico - Market size and forecast (2023-2028) ($ million)
      • Chart on Mexico - Year-over-year growth (2023-2028) (%)
      • Data Table on Mexico - Year-over-year growth (2023-2028) (%)

    12 Drivers, Challenges, and Opportunity/Restraints

    • 12.1 Market drivers
      • 12.2 Market challenges
        • 12.3 Impact of drivers and challenges
          • Impact of drivers and challenges in 2023 and 2028
        • 12.4 Market opportunities/restraints

          13 Competitive Landscape

          • 13.1 Overview
            • 13.2 Competitive Landscape
              • Overview on criticality of inputs and factors of differentiation
            • 13.3 Landscape disruption
              • Overview on factors of disruption
            • 13.4 Industry risks
              • Impact of key risks on business

            14 Competitive Analysis

            • 14.1 Companies profiled
              • Companies covered
            • 14.2 Market positioning of companies
              • Matrix on companies position and classification
            • 14.3 Continental AG
              • Continental AG - Overview
              • Continental AG - Business segments
              • Continental AG - Key news
              • Continental AG - Key offerings
              • Continental AG - Segment focus
            • 14.4 DENSO Corp.
              • DENSO Corp. - Overview
              • DENSO Corp. - Business segments
              • DENSO Corp. - Key news
              • DENSO Corp. - Key offerings
              • DENSO Corp. - Segment focus
            • 14.5 Intel Corp.
              • Intel Corp. - Overview
              • Intel Corp. - Business segments
              • Intel Corp. - Key news
              • Intel Corp. - Key offerings
              • Intel Corp. - Segment focus
            • 14.6 Jabil Inc.
              • Jabil Inc. - Overview
              • Jabil Inc. - Business segments
              • Jabil Inc. - Key news
              • Jabil Inc. - Key offerings
              • Jabil Inc. - Segment focus
            • 14.7 Magna International Inc.
              • Magna International Inc. - Overview
              • Magna International Inc. - Business segments
              • Magna International Inc. - Key news
              • Magna International Inc. - Key offerings
              • Magna International Inc. - Segment focus
            • 14.8 NetraDyne Inc.
              • NetraDyne Inc. - Overview
              • NetraDyne Inc. - Product / Service
              • NetraDyne Inc. - Key offerings
            • 14.9 NXP Semiconductors NV
              • NXP Semiconductors NV - Overview
              • NXP Semiconductors NV - Product / Service
              • NXP Semiconductors NV - Key news
              • NXP Semiconductors NV - Key offerings
            • 14.10 OMRON Corp.
              • OMRON Corp. - Overview
              • OMRON Corp. - Business segments
              • OMRON Corp. - Key news
              • OMRON Corp. - Key offerings
              • OMRON Corp. - Segment focus
            • 14.11 Robert Bosch GmbH
              • Robert Bosch GmbH - Overview
              • Robert Bosch GmbH - Product / Service
              • Robert Bosch GmbH - Key news
              • Robert Bosch GmbH - Key offerings
            • 14.12 Tata Elxsi Ltd.
              • Tata Elxsi Ltd. - Overview
              • Tata Elxsi Ltd. - Business segments
              • Tata Elxsi Ltd. - Key offerings
              • Tata Elxsi Ltd. - Segment focus
            • 14.13 Tobii AB
              • Tobii AB - Overview
              • Tobii AB - Business segments
              • Tobii AB - Key news
              • Tobii AB - Key offerings
              • Tobii AB - Segment focus
            • 14.14 Toyota Motor Corp.
              • Toyota Motor Corp. - Overview
              • Toyota Motor Corp. - Business segments
              • Toyota Motor Corp. - Key news
              • Toyota Motor Corp. - Key offerings
              • Toyota Motor Corp. - Segment focus
            • 14.15 Valeo SA
              • Valeo SA - Overview
              • Valeo SA - Business segments
              • Valeo SA - Key news
              • Valeo SA - Key offerings
              • Valeo SA - Segment focus
            • 14.16 Veoneer Inc.
              • Veoneer Inc. - Overview
              • Veoneer Inc. - Product / Service
              • Veoneer Inc. - Key offerings
            • 14.17 Visteon Corp.
              • Visteon Corp. - Overview
              • Visteon Corp. - Product / Service
              • Visteon Corp. - Key offerings

            15 Appendix

            • 15.1 Scope of the report
              • 15.2 Inclusions and exclusions checklist
                • Inclusions checklist
                • Exclusions checklist
              • 15.3 Currency conversion rates for US$
                • Currency conversion rates for US$
              • 15.4 Research methodology
                • Research methodology
              • 15.5 Data procurement
                • Information sources
              • 15.6 Data validation
                • Data validation
              • 15.7 Validation techniques employed for market sizing
                • Validation techniques employed for market sizing
              • 15.8 Data synthesis
                • Data synthesis
              • 15.9 360 degree market analysis
                • 360 degree market analysis
              • 15.10 List of abbreviations
                • List of abbreviations

              Research Methodology

              Technavio presents a detailed picture of the market by way of study, synthesis, and summation of data from multiple sources. The analysts have presented the various facets of the market with a particular focus on identifying the key industry influencers. The data thus presented is comprehensive, reliable, and the result of extensive research, both primary and secondary.

              INFORMATION SOURCES

              Primary sources

              • Manufacturers and suppliers
              • Channel partners
              • Industry experts
              • Strategic decision makers

              Secondary sources

              • Industry journals and periodicals
              • Government data
              • Financial reports of key industry players
              • Historical data
              • Press releases

              DATA ANALYSIS

              Data Synthesis

              • Collation of data
              • Estimation of key figures
              • Analysis of derived insights

              Data Validation

              • Triangulation with data models
              • Reference against proprietary databases
              • Corroboration with industry experts

              REPORT WRITING

              Qualitative

              • Market drivers
              • Market challenges
              • Market trends
              • Five forces analysis

              Quantitative

              • Market size and forecast
              • Market segmentation
              • Geographical insights
              • Competitive landscape

              Interested in this report?

              Get your sample now to see our research methodology and insights!

              Download Now

              Frequently Asked Questions

              Automotive Driver Monitoring market growth will increase by $ 1726.9 mn during 2024-2028 .

              The Automotive Driver Monitoring market is expected to grow at a CAGR of 9.45% during 2024-2028 .

              Automotive Driver Monitoring market is segmented by Type( Driver state monitoring, Driver health monitoring) Application( Commercial vehicles, Passenger cars, APAC, South America, Middle East and Africa)

              Continental AG, DENSO Corp., Intel Corp., Jabil Inc., Magna International Inc., Marelli Holdings Co. Ltd., NetraDyne Inc., NVIDIA Corp., NXP Semiconductors NV, OmniVision Technologies Inc., OMRON Corp., Qualcomm Inc., Robert Bosch GmbH, Stonkam Co. Ltd., Tata Elxsi Ltd., Tobii AB, Toyota Motor Corp., Valeo SA, Veoneer Inc., Visteon Corp. are a few of the key vendors in the Automotive Driver Monitoring market.

              Europe will register the highest growth rate of 37% among the other regions. Therefore, the Automotive Driver Monitoring market in Europe is expected to garner significant business opportunities for the vendors during the forecast period.

              US, China, Germany, Japan, UK, Australia, India, France, Brazil, Canada, Brazil, UAE, Australia, Rest of World (ROW), Saudi Arabia, France, South Korea, Mexico

              • Safety benefits of in-vehicle driver monitoring systemsThe global automotive driver monitoring market is primarily driven by benefits such as enhanced safety for drivers and other road users. These systems also aid in preventing any health emergency by monitoring the driving state and physiological conditions of drivers is the driving factor this market.
              • such as facial or eye movements. Driver automotive state monitoring systems send alerts through audio or visual alarms if the driver is found to be driving in an exhausted is the driving factor this market.
              • tired is the driving factor this market.
              • or distracted state.Driver health monitoring systems will gradually become an integral part of automobiles. This is because the health and wellness of drivers play an important role in determining their safety and that of their co-passengers and other road users. Any prolonged illness or sudden health complications can result in severe road accidents or collisions. Thus is the driving factor this market.
              • ensuring safety by continuously monitoring various health parameters such as body temperature is the driving factor this market.
              • blood pressure is the driving factor this market.
              • pulse rate is the driving factor this market.
              • heart rate is the driving factor this market.
              • and brain activity is important. Facial recognition is the driving factor this market.
              • eye-tracking is the driving factor this market.
              • and other sensors can accurately detect signs of drowsiness is the driving factor this market.
              • fatigue is the driving factor this market.
              • or other factors that may impair a drivers ability to operate a vehicle safely. Thus is the driving factor this market.
              • due to all such benefits is the driving factor this market.
              • the demand for driver monitoring systems is increasing is the driving factor this market.
              • which will have a positive impact on the global market in focus during the forecast period. is the driving factor this market.

              The Automotive Driver Monitoring market vendors should focus on grabbing business opportunities from the Driver state monitoring segment as it accounted for the largest market share in the base year.