Automotive Drivetrain Market Analysis APAC, Europe, North America, South America, Middle East and Africa - China, US, Japan, Germany, India - Size and Forecast 2024-2028

Automotive Drivetrain Market Analysis APAC, Europe, North America, South America, Middle East and Africa - China, US, Japan, Germany, India - Size and Forecast 2024-2028

Published: Aug 2024 163 Pages SKU: IRTNTR76127

Market Overview at a Glance

$75.5 B
Market Opportunity
6.75%
CAGR
6.09
YoY growth 2023-2024(%)

Automotive Drivetrain Market Size 2024-2028

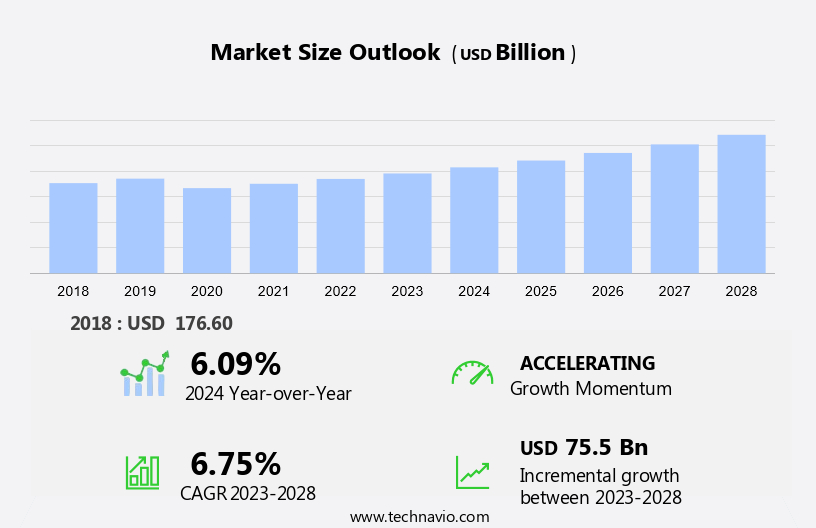
The automotive drivetrain market size is forecast to increase by USD 75.5 billion at a CAGR of 6.75% between 2023 and 2028.

  • The market is experiencing significant growth, driven by the increasing demand for commercial vehicles and luxury cars. With the rise of e-commerce and logistics industries, commercial vehicles are becoming increasingly essential, leading to a growth in demand for strong drivetrain systems. Similarly, the luxury vehicle segment is witnessing a resurgence, fueled by consumer preferences for comfort and performance. However, the automotive industry faces uncertainty due to various factors, including regulatory changes and evolving consumer preferences. Drive shafts, axles, CV joints, and U joints continue to be critical components of drivetrain systems, ensuring the efficient transfer of power from the engine to the wheels. These components must be able to withstand the demands of both commercial and luxury vehicles, making innovation and durability key factors In their development.

What will be the Size of the Automotive Drivetrain Market During the Forecast Period?

Automotive Drivetrain Market Size

 Request Free Sample

  • The market is witnessing significant advancements in technology, particularly in electric drive systems, automated transmissions, and power distribution components. Electric vehicles (EVs) and hybrid vehicles (HEVs) are leading the charge, with their reliance on synchronous motors and advanced battery systems. In traditional automobiles, the drivetrain system comprises engine location, transmission, drive shafts, axles, CV joints, U joints, wheels, power, and torque distribution. The internal combustion engine (ICE) plays a crucial role in delivering power to the wheels via the transmission. However, the future lies in electric drive systems, where power is directly delivered to the wheels, eliminating the need for a traditional transmission. Rear-wheel drive and all-wheel drive configurations are common in both ICE and electric vehicles. 
  • Additionally, automated transmissions offer improved fuel efficiency and smoother shifting, while electric vehicles and hybrid vehicles leverage regenerative braking to recover energy during deceleration. The towing capacity of heavy commercial vehicles is a critical consideration in drivetrain design, necessitating strong axles and CV joints. Technology advancements in drivetrain systems include traction control systems, engine combustion control, and advanced materials for improved durability and efficiency. The market is poised for growth, driven by the increasing adoption of electric and hybrid vehicles and the continuous pursuit of improved vehicle performance and efficiency.

How is this Automotive Drivetrain Industry segmented and which is the largest segment?

The automotive drivetrain industry research report provides comprehensive data (region-wise segment analysis), with forecasts and estimates in "USD billion" for the period 2024-2028, as well as historical data from 2018-2022 for the following segments.
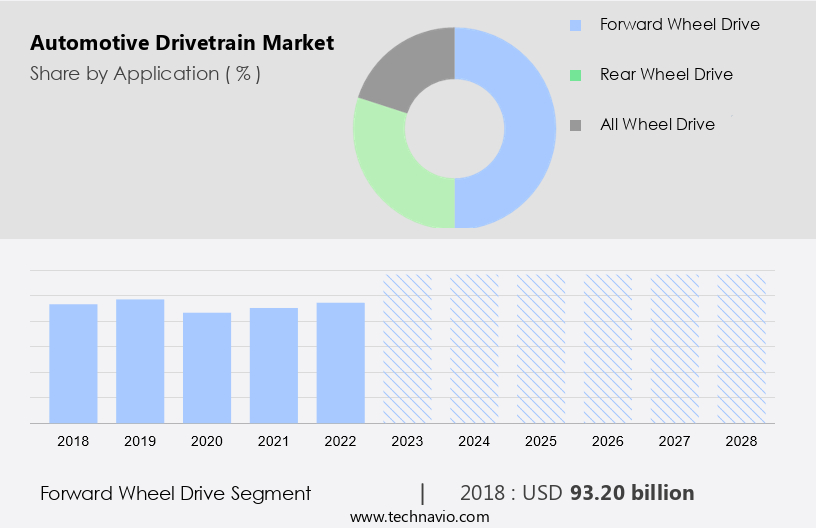
  • Application
    • Forward wheel drive
    • Rear wheel drive
    • All wheel drive
  • Vehicle Type
    • Passenger car
    • Commercial vehicle
  • Geography
    • APAC
      • China
      • India
      • Japan
    • Europe
      • Germany
    • North America
      • US
    • South America
    • Middle East and Africa

By Application Insights

  • The forward wheel drive segment is estimated to witness significant growth during the forecast period.

In the realm of automotive powertrains, forward wheel drive systems have gained significant traction due to their ability to efficiently transmit engine power to the front wheels. These systems are lighter than their counterparts, such as rear-wheel and four-wheel-drive systems, leading to improved fuel economy. The rising preference for sport utility vehicles (SUVs) and crossovers among consumers is driving the demand for forward wheel drive systems. 

Moreover, many SUV manufacturers cater to the medium-size vehicle segment, equipping these vehicles with strong off-road capabilities and enhanced suspension for optimal comfort on challenging terrains. Medium-size SUVs offer unique off-road features that are not readily available in other vehicle classes. Automakers provide forward wheel drive as a standard or optional feature in SUVs and crossovers, with deployment varying among models, automakers, and geographical regions.

Automotive Drivetrain Market Size

Get a glance at the Automotive Drivetrain Industry report of share of various segments Request Free Sample

The forward wheel drive segment was valued at USD 93.20 billion in 2018 and showed a gradual increase during the forecast period.

Regional Analysis

  • APAC is estimated to contribute 55% to the growth of the global market during the forecast period.

Technavio's analysts have elaborately explained the regional trends and drivers that shape the market during the forecast period.

Automotive Drivetrain Market Share by Geography

For more insights on the market share of various regions, Request Free Sample

The market In the Asia Pacific (APAC) region experiences significant growth due to the increasing demand for commercial vehicles in countries like China, Japan, South Korea, and India. These nations are key contributors to the market's expansion, as their economies rely heavily on manufacturing and logistics industries that require efficient land transport solutions. Moreover, developed markets such as Japan, South Korea, and Australia serve as prominent automotive export hubs in APAC. The production and sale of commercial vehicles and their associated drivetrain components are closely interconnected, with the former driving the demand for the latter. The region's automotive drivetrain industry also benefits from the increasing export-oriented production of automotive components to cater to global markets.

Market Dynamics

Our researchers analyzed the data with 2023 as the base year, along with the key drivers, trends, and challenges. A holistic analysis of drivers will help companies refine their marketing strategies to gain a competitive advantage.

What are the key market drivers leading to the rise In the adoption of Automotive Drivetrain Industry?

Increase in demand for commercial vehicles is the key driver of the market.

  • The market is experiencing significant growth due to the escalating demand for commercial vehicles. In developed markets like North America, the popularity and sales of medium- and heavy-duty trucks, particularly for commercial applications, are on the rise. These vehicles play a pivotal role in various industries, including logistics, construction, mining, and manufacturing.
  • In the developing and emerging economies of the Asia Pacific region, the demand for commercial vehicles is increasing, fueled by improving socio-economic conditions, infrastructure development, and employment opportunities. Key components of the drivetrain system, such as drive shafts, axles, CV joints, and U joints, are essential for the smooth functioning of these vehicles. The increasing demand for commercial vehicles is expected to continue driving the growth of the market.

What are the market trends shaping the Automotive Drivetrain Industry?

Increasing demand for luxury vehicles is the upcoming market trend.

  • The market is anticipated to experience significant growth due to the increasing sales of high-performance luxury vehicles. Customers' preferences are evolving towards premium, comfortable vehicles with advanced onboard features. The demand for luxury SUVs, in particular, has been on the rise for the past few years and is projected to continue during the forecast period. SUVs are designed for off-roading and require strong drivetrain systems, including drive shafts, axles, CV joints, and U joints, to ensure optimal traction and performance on various terrains. 
  • Moreover, the growing popularity of luxury vehicles in emerging markets, such as China and India, is driven by stable economic conditions and rising disposable incomes. These factors are expected to fuel the demand for high-performance drivetrain systems In the automotive industry.

What challenges does the Automotive Drivetrain Industry face during its growth?

Uncertainty in automotive industry is a key challenge affecting the industry growth.

  • The market experienced significant challenges due to the COVID-19 pandemic, particularly In the years 2020 and early 2021. Various countries, including India and the US, implemented nationwide lockdowns to curb the spread of the virus, leading to a disruption in cross-border trade activities. This, in turn, increased the cost of raw materials and components essential for manufacturing vehicles.
  • Additionally, the absence of customers in automobile showrooms due to stringent lockdown measures resulted In the halt of automobile production units worldwide. Consequently, the adverse effects of the pandemic impeded the growth of the automotive industry during this period. Drive shafts, axles, CV joints, and U joints, which are integral components of the drivetrain system, were significantly impacted by these challenges.

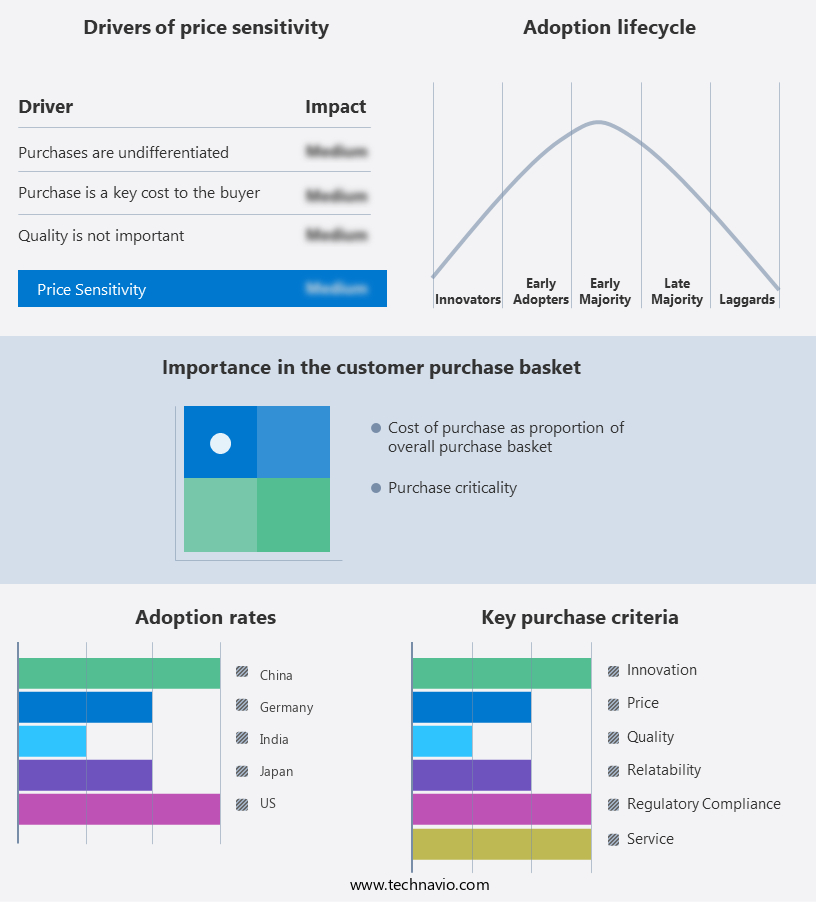
Exclusive Customer Landscape

The automotive drivetrain market forecasting report includes the adoption lifecycle of the market, market growth and forecasting, covering from the innovator's stage to the laggard's stage. It focuses on adoption rates in different regions based on penetration. Furthermore, the automotive drivetrain market report also includes key purchase criteria and drivers of price sensitivity to help companies evaluate and develop their market growth analysis strategies.

Automotive Drivetrain Market Share by Geography

 Customer Landscape

Key Companies & Market Insights

Companies are implementing various strategies, such as strategic alliances, automotive drivetrain market forecast, partnerships, mergers and acquisitions, geographical expansion, and product/service launches, to enhance their presence In the industry. The industry research and growth report includes detailed analyses of the competitive landscape of the market and information about key companies, including:

  • American Axle and Manufacturing Holdings Inc.
  • BorgWarner Inc.
  • Continental AG
  • Dana Inc.
  • JTEKT Corp.
  • Magna International Inc.
  • Melrose Industries Plc
  • Mitsubishi Corp.
  • Nidec Corp.
  • Robert Bosch GmbH
  • Schaeffler AG
  • ZF Friedrichshafen AG

Qualitative and quantitative analysis of companies has been conducted to help clients understand the wider business environment as well as the strengths and weaknesses of key industry players. Data is qualitatively analyzed to categorize companies as pure play, category-focused, industry-focused, and diversified; it is quantitatively analyzed to categorize companies as dominant, leading, strong, tentative, and weak.

Research Analyst Overview

The market caters to various vehicle types, including automobiles, electric vehicles (EVs), and heavy commercial vehicles. The market is witnessing significant growth due to advancements in technology, such as electric drive systems and automated transmissions. Electric vehicles utilize synchronous motors for propulsion, while hybrid vehicles combine internal combustion engines with electric motors. Rear-wheel drive and all-wheel drive (AWD) systems are common in automobiles, with engine location varying from front to rear. Transmission systems, including drive shafts, axles, CV joints, and U joints, transfer power from the engine to the wheels.

Thus, traction and towing capacity are essential considerations for heavy commercial vehicles. Government regulations aimed at reducing carbon dioxide emissions are driving the adoption of cleaner technologies, such as electric and hybrid drivetrains. The automotive drivetrain system market is influenced by factors like combustion control systems, turbochargers, disposable income, and consumer preferences for luxury cars, SUVs, and advanced electronics. Vehicle diagnostics using scanner vehicles and continuous improvements in AWD systems are core application areas for the market.

Market Scope

Report Coverage

Details

Page number

163

Base year

2023

Historic period

2018-2022

Forecast period

2024-2028

Growth momentum & CAGR

Accelerate at a CAGR of 6.75%

Market growth 2024-2028

USD 75.5 billion

Market structure

Concentrated

YoY growth 2023-2024(%)

6.09

Key countries

China, US, Japan, Germany, and India

Competitive landscape

Leading Companies, Market Positioning of Companies, Competitive Strategies, and Industry Risks

Request Free Sample

What are the Key Data Covered in this Automotive Drivetrain Market Research and Growth Report?

  • CAGR of the Automotive Drivetrain industry during the forecast period
  • Detailed information on factors that will drive the growth and forecasting between 2024 and 2028
  • Precise estimation of the size of the market and its contribution of the industry in focus to the parent market
  • Accurate predictions about upcoming growth and trends and changes in consumer behaviour
  • Growth of the market across APAC, Europe, North America, South America, and Middle East and Africa
  • Thorough analysis of the market's competitive landscape and detailed information about companies
  • Comprehensive analysis of factors that will challenge the automotive drivetrain market growth of industry companies

We can help! Our analysts can customize this automotive drivetrain market research report to meet your requirements.

Get in touch

1 Executive Summary

  • 1.1 Market overview
    • Executive Summary - Chart on Market Overview
    • Executive Summary - Data Table on Market Overview
    • Executive Summary - Chart on Global Market Characteristics
    • Executive Summary - Chart on Market by Geography
    • Executive Summary - Chart on Market Segmentation by Application
    • Executive Summary - Chart on Market Segmentation by Vehicle Type
    • Executive Summary - Chart on Incremental Growth
    • Executive Summary - Data Table on Incremental Growth
    • Executive Summary - Chart on Company Market Positioning

2 Market Landscape

  • 2.1 Market ecosystem
    • Parent Market
    • Data Table on - Parent Market
  • 2.2 Market characteristics
    • Market characteristics analysis
  • 2.3 Value chain analysis
    • Value Chain Analysis

3 Market Sizing

  • 3.1 Market definition
    • Offerings of companies included in the market definition
  • 3.2 Market segment analysis
    • Market segments
  • 3.3 Market size 2023
    • 3.4 Market outlook: Forecast for 2023-2028
      • Chart on Global - Market size and forecast 2023-2028 ($ billion)
      • Data Table on Global - Market size and forecast 2023-2028 ($ billion)
      • Chart on Global Market: Year-over-year growth 2023-2028 (%)
      • Data Table on Global Market: Year-over-year growth 2023-2028 (%)

    4 Historic Market Size

    • 4.1 Global Automotive Drivetrain Market 2018 - 2022
      • Historic Market Size - Data Table on Global Automotive Drivetrain Market 2018 - 2022 ($ billion)
    • 4.2 Application segment analysis 2018 - 2022
      • Historic Market Size - Application Segment 2018 - 2022 ($ billion)
    • 4.3 Vehicle Type segment analysis 2018 - 2022
      • Historic Market Size - Vehicle Type Segment 2018 - 2022 ($ billion)
    • 4.4 Geography segment analysis 2018 - 2022
      • Historic Market Size - Geography Segment 2018 - 2022 ($ billion)
    • 4.5 Country segment analysis 2018 - 2022
      • Historic Market Size - Country Segment 2018 - 2022 ($ billion)

    5 Five Forces Analysis

    • 5.1 Five forces summary
      • Five forces analysis - Comparison between 2023 and 2028
    • 5.2 Bargaining power of buyers
      • Bargaining power of buyers - Impact of key factors 2023 and 2028
    • 5.3 Bargaining power of suppliers
      • Bargaining power of suppliers - Impact of key factors in 2023 and 2028
    • 5.4 Threat of new entrants
      • Threat of new entrants - Impact of key factors in 2023 and 2028
    • 5.5 Threat of substitutes
      • Threat of substitutes - Impact of key factors in 2023 and 2028
    • 5.6 Threat of rivalry
      • Threat of rivalry - Impact of key factors in 2023 and 2028
    • 5.7 Market condition
      • Chart on Market condition - Five forces 2023 and 2028

    6 Market Segmentation by Application

    • 6.1 Market segments
      • Chart on Application - Market share 2023-2028 (%)
      • Data Table on Application - Market share 2023-2028 (%)
    • 6.2 Comparison by Application
      • Chart on Comparison by Application
      • Data Table on Comparison by Application
    • 6.3 Forward wheel drive - Market size and forecast 2023-2028
      • Chart on Forward wheel drive - Market size and forecast 2023-2028 ($ billion)
      • Data Table on Forward wheel drive - Market size and forecast 2023-2028 ($ billion)
      • Chart on Forward wheel drive - Year-over-year growth 2023-2028 (%)
      • Data Table on Forward wheel drive - Year-over-year growth 2023-2028 (%)
    • 6.4 Rear wheel drive - Market size and forecast 2023-2028
      • Chart on Rear wheel drive - Market size and forecast 2023-2028 ($ billion)
      • Data Table on Rear wheel drive - Market size and forecast 2023-2028 ($ billion)
      • Chart on Rear wheel drive - Year-over-year growth 2023-2028 (%)
      • Data Table on Rear wheel drive - Year-over-year growth 2023-2028 (%)
    • 6.5 All wheel drive - Market size and forecast 2023-2028
      • Chart on All wheel drive - Market size and forecast 2023-2028 ($ billion)
      • Data Table on All wheel drive - Market size and forecast 2023-2028 ($ billion)
      • Chart on All wheel drive - Year-over-year growth 2023-2028 (%)
      • Data Table on All wheel drive - Year-over-year growth 2023-2028 (%)
    • 6.6 Market opportunity by Application
      • Market opportunity by Application ($ billion)
      • Data Table on Market opportunity by Application ($ billion)

    7 Market Segmentation by Vehicle Type

    • 7.1 Market segments
      • Chart on Vehicle Type - Market share 2023-2028 (%)
      • Data Table on Vehicle Type - Market share 2023-2028 (%)
    • 7.2 Comparison by Vehicle Type
      • Chart on Comparison by Vehicle Type
      • Data Table on Comparison by Vehicle Type
    • 7.3 Passenger car - Market size and forecast 2023-2028
      • Chart on Passenger car - Market size and forecast 2023-2028 ($ billion)
      • Data Table on Passenger car - Market size and forecast 2023-2028 ($ billion)
      • Chart on Passenger car - Year-over-year growth 2023-2028 (%)
      • Data Table on Passenger car - Year-over-year growth 2023-2028 (%)
    • 7.4 Commercial vehicle - Market size and forecast 2023-2028
      • Chart on Commercial vehicle - Market size and forecast 2023-2028 ($ billion)
      • Data Table on Commercial vehicle - Market size and forecast 2023-2028 ($ billion)
      • Chart on Commercial vehicle - Year-over-year growth 2023-2028 (%)
      • Data Table on Commercial vehicle - Year-over-year growth 2023-2028 (%)
    • 7.5 Market opportunity by Vehicle Type
      • Market opportunity by Vehicle Type ($ billion)
      • Data Table on Market opportunity by Vehicle Type ($ billion)

    8 Customer Landscape

    • 8.1 Customer landscape overview
      • Analysis of price sensitivity, lifecycle, customer purchase basket, adoption rates, and purchase criteria

    9 Geographic Landscape

    • 9.1 Geographic segmentation
      • Chart on Market share by geography 2023-2028 (%)
      • Data Table on Market share by geography 2023-2028 (%)
    • 9.2 Geographic comparison
      • Chart on Geographic comparison
      • Data Table on Geographic comparison
    • 9.3 APAC - Market size and forecast 2023-2028
      • Chart on APAC - Market size and forecast 2023-2028 ($ billion)
      • Data Table on APAC - Market size and forecast 2023-2028 ($ billion)
      • Chart on APAC - Year-over-year growth 2023-2028 (%)
      • Data Table on APAC - Year-over-year growth 2023-2028 (%)
    • 9.4 Europe - Market size and forecast 2023-2028
      • Chart on Europe - Market size and forecast 2023-2028 ($ billion)
      • Data Table on Europe - Market size and forecast 2023-2028 ($ billion)
      • Chart on Europe - Year-over-year growth 2023-2028 (%)
      • Data Table on Europe - Year-over-year growth 2023-2028 (%)
    • 9.5 North America - Market size and forecast 2023-2028
      • Chart on North America - Market size and forecast 2023-2028 ($ billion)
      • Data Table on North America - Market size and forecast 2023-2028 ($ billion)
      • Chart on North America - Year-over-year growth 2023-2028 (%)
      • Data Table on North America - Year-over-year growth 2023-2028 (%)
    • 9.6 South America - Market size and forecast 2023-2028
      • Chart on South America - Market size and forecast 2023-2028 ($ billion)
      • Data Table on South America - Market size and forecast 2023-2028 ($ billion)
      • Chart on South America - Year-over-year growth 2023-2028 (%)
      • Data Table on South America - Year-over-year growth 2023-2028 (%)
    • 9.7 Middle East and Africa - Market size and forecast 2023-2028
      • Chart on Middle East and Africa - Market size and forecast 2023-2028 ($ billion)
      • Data Table on Middle East and Africa - Market size and forecast 2023-2028 ($ billion)
      • Chart on Middle East and Africa - Year-over-year growth 2023-2028 (%)
      • Data Table on Middle East and Africa - Year-over-year growth 2023-2028 (%)
    • 9.8 China - Market size and forecast 2023-2028
      • Chart on China - Market size and forecast 2023-2028 ($ billion)
      • Data Table on China - Market size and forecast 2023-2028 ($ billion)
      • Chart on China - Year-over-year growth 2023-2028 (%)
      • Data Table on China - Year-over-year growth 2023-2028 (%)
    • 9.9 US - Market size and forecast 2023-2028
      • Chart on US - Market size and forecast 2023-2028 ($ billion)
      • Data Table on US - Market size and forecast 2023-2028 ($ billion)
      • Chart on US - Year-over-year growth 2023-2028 (%)
      • Data Table on US - Year-over-year growth 2023-2028 (%)
    • 9.10 Japan - Market size and forecast 2023-2028
      • Chart on Japan - Market size and forecast 2023-2028 ($ billion)
      • Data Table on Japan - Market size and forecast 2023-2028 ($ billion)
      • Chart on Japan - Year-over-year growth 2023-2028 (%)
      • Data Table on Japan - Year-over-year growth 2023-2028 (%)
    • 9.11 Germany - Market size and forecast 2023-2028
      • Chart on Germany - Market size and forecast 2023-2028 ($ billion)
      • Data Table on Germany - Market size and forecast 2023-2028 ($ billion)
      • Chart on Germany - Year-over-year growth 2023-2028 (%)
      • Data Table on Germany - Year-over-year growth 2023-2028 (%)
    • 9.12 India - Market size and forecast 2023-2028
      • Chart on India - Market size and forecast 2023-2028 ($ billion)
      • Data Table on India - Market size and forecast 2023-2028 ($ billion)
      • Chart on India - Year-over-year growth 2023-2028 (%)
      • Data Table on India - Year-over-year growth 2023-2028 (%)
    • 9.13 Market opportunity by geography
      • Market opportunity by geography ($ billion)
      • Data Tables on Market opportunity by geography ($ billion)

    10 Drivers, Challenges, and Opportunity/Restraints

    • 10.1 Market drivers
      • 10.2 Market challenges
        • 10.3 Impact of drivers and challenges
          • Impact of drivers and challenges in 2023 and 2028
        • 10.4 Market opportunities/restraints

          11 Competitive Landscape

          • 11.1 Overview
            • 11.2 Competitive Landscape
              • Overview on criticality of inputs and factors of differentiation
            • 11.3 Landscape disruption
              • Overview on factors of disruption
            • 11.4 Industry risks
              • Impact of key risks on business

            12 Competitive Analysis

            • 12.1 Companies profiled
              • Companies covered
            • 12.2 Market positioning of companies
              • Matrix on companies position and classification
            • 12.3 American Axle and Manufacturing Holdings Inc.
              • American Axle and Manufacturing Holdings Inc. - Overview
              • American Axle and Manufacturing Holdings Inc. - Business segments
              • American Axle and Manufacturing Holdings Inc. - Key news
              • American Axle and Manufacturing Holdings Inc. - Key offerings
              • American Axle and Manufacturing Holdings Inc. - Segment focus
            • 12.4 BorgWarner Inc.
              • BorgWarner Inc. - Overview
              • BorgWarner Inc. - Business segments
              • BorgWarner Inc. - Key news
              • BorgWarner Inc. - Key offerings
              • BorgWarner Inc. - Segment focus
            • 12.5 Continental AG
              • Continental AG - Overview
              • Continental AG - Business segments
              • Continental AG - Key news
              • Continental AG - Key offerings
              • Continental AG - Segment focus
            • 12.6 Dana Inc.
              • Dana Inc. - Overview
              • Dana Inc. - Business segments
              • Dana Inc. - Key news
              • Dana Inc. - Key offerings
              • Dana Inc. - Segment focus
            • 12.7 JTEKT Corp.
              • JTEKT Corp. - Overview
              • JTEKT Corp. - Business segments
              • JTEKT Corp. - Key news
              • JTEKT Corp. - Key offerings
              • JTEKT Corp. - Segment focus
            • 12.8 Magna International Inc.
              • Magna International Inc. - Overview
              • Magna International Inc. - Business segments
              • Magna International Inc. - Key news
              • Magna International Inc. - Key offerings
              • Magna International Inc. - Segment focus
            • 12.9 Melrose Industries Plc
              • Melrose Industries Plc - Overview
              • Melrose Industries Plc - Business segments
              • Melrose Industries Plc - Key offerings
              • Melrose Industries Plc - Segment focus
            • 12.10 Mitsubishi Corp.
              • Mitsubishi Corp. - Overview
              • Mitsubishi Corp. - Business segments
              • Mitsubishi Corp. - Key news
              • Mitsubishi Corp. - Key offerings
              • Mitsubishi Corp. - Segment focus
            • 12.11 Nidec Corp.
              • Nidec Corp. - Overview
              • Nidec Corp. - Business segments
              • Nidec Corp. - Key news
              • Nidec Corp. - Key offerings
              • Nidec Corp. - Segment focus
            • 12.12 Robert Bosch GmbH
              • Robert Bosch GmbH - Overview
              • Robert Bosch GmbH - Product / Service
              • Robert Bosch GmbH - Key news
              • Robert Bosch GmbH - Key offerings
            • 12.13 Schaeffler AG
              • Schaeffler AG - Overview
              • Schaeffler AG - Business segments
              • Schaeffler AG - Key news
              • Schaeffler AG - Key offerings
              • Schaeffler AG - Segment focus
            • 12.14 ZF Friedrichshafen AG
              • ZF Friedrichshafen AG - Overview
              • ZF Friedrichshafen AG - Business segments
              • ZF Friedrichshafen AG - Key news
              • ZF Friedrichshafen AG - Key offerings
              • ZF Friedrichshafen AG - Segment focus

            13 Appendix

            • 13.1 Scope of the report
              • 13.2 Inclusions and exclusions checklist
                • Inclusions checklist
                • Exclusions checklist
              • 13.3 Currency conversion rates for US$
                • Currency conversion rates for US$
              • 13.4 Research methodology
                • Research methodology
              • 13.5 Data procurement
                • Information sources
              • 13.6 Data validation
                • Data validation
              • 13.7 Validation techniques employed for market sizing
                • Validation techniques employed for market sizing
              • 13.8 Data synthesis
                • Data synthesis
              • 13.9 360 degree market analysis
                • 360 degree market analysis
              • 13.10 List of abbreviations
                • List of abbreviations

              Research Methodology

              Technavio presents a detailed picture of the market by way of study, synthesis, and summation of data from multiple sources. The analysts have presented the various facets of the market with a particular focus on identifying the key industry influencers. The data thus presented is comprehensive, reliable, and the result of extensive research, both primary and secondary.

              INFORMATION SOURCES

              Primary sources

              • Manufacturers and suppliers
              • Channel partners
              • Industry experts
              • Strategic decision makers

              Secondary sources

              • Industry journals and periodicals
              • Government data
              • Financial reports of key industry players
              • Historical data
              • Press releases

              DATA ANALYSIS

              Data Synthesis

              • Collation of data
              • Estimation of key figures
              • Analysis of derived insights

              Data Validation

              • Triangulation with data models
              • Reference against proprietary databases
              • Corroboration with industry experts

              REPORT WRITING

              Qualitative

              • Market drivers
              • Market challenges
              • Market trends
              • Five forces analysis

              Quantitative

              • Market size and forecast
              • Market segmentation
              • Geographical insights
              • Competitive landscape

              Interested in this report?

              Get your sample now to see our research methodology and insights!

              Download Now

              Frequently Asked Questions

              Automotive Drivetrain market growth will increase by $ 75.5 bn during 2024-2028 .

              The Automotive Drivetrain market is expected to grow at a CAGR of 6.75% during 2024-2028 .

              Automotive Drivetrain market is segmented by Application( Forward wheel drive, Rear wheel drive, All wheel drive) Vehicle Type( Passenger car, Commercial vehicle)

              American Axle and Manufacturing Holdings Inc., BorgWarner Inc., Continental AG, Dana Inc., JTEKT Corp., Magna International Inc., Melrose Industries Plc, Mitsubishi Corp., Nidec Corp., Robert Bosch GmbH, Schaeffler AG, ZF Friedrichshafen AG are a few of the key vendors in the Automotive Drivetrain market.

              APAC will register the highest growth rate of 55% among the other regions. Therefore, the Automotive Drivetrain market in APAC is expected to garner significant business opportunities for the vendors during the forecast period.

              China, US, Japan, Germany, India

              • Increase in demand for commercial vehiclesThe increasing demand for commercial vehicles is driving the global automotive drivetrain market. The developed automotive markets in North America such as the US and Canada is the driving factor this market.
              • witness high popularity and sales of vehicles such as pickup trucks for commercial purposes. The growing demand for medium-duty and heavy-duty trucks is one of the major contributors to the growth of the global automotive drivetrain market. Medium- and heavy-duty trucks have been the backbone of commercial activities is the driving factor this market.
              • including logistics is the driving factor this market.
              • construction is the driving factor this market.
              • mining is the driving factor this market.
              • and any-trade related activities. In the developing and emerging economies of APAC is the driving factor this market.
              • the demand for such a segment of commercial vehicles is increasing is the driving factor this market.
              • led by the improving socio-economic conditions is the driving factor this market.
              • as well as infrastructure is the driving factor this market.
              • employment opportunities is the driving factor this market.
              • and manufacturing. This is expected to drive the demand for various vehicles is the driving factor this market.
              • such as medium- and heavy-duty trucks is the driving factor this market.
              • across regions during the forecast period. Thus is the driving factor this market.
              • the increasing demand for commercial vehicles is expected to drive the global automotive drivetrain market during the forecast period. is the driving factor this market.

              The Automotive Drivetrain market vendors should focus on grabbing business opportunities from the Forward wheel drive segment as it accounted for the largest market share in the base year.