Automotive Fleet Leasing Market Analysis APAC, Europe, North America, Middle East and Africa, South America - US, China, UK, Germany, France - Size and Forecast 2024-2028

Automotive Fleet Leasing Market Analysis APAC, Europe, North America, Middle East and Africa, South America - US, China, UK, Germany, France - Size and Forecast 2024-2028

Published: Jan 2024 150 Pages SKU: IRTNTR77206

Market Overview at a Glance

$9.2 B
Market Opportunity
5.98%
CAGR
5.71
YoY growth 2023-2024(%)

Automotive Fleet Leasing Market Size 2024-2028 

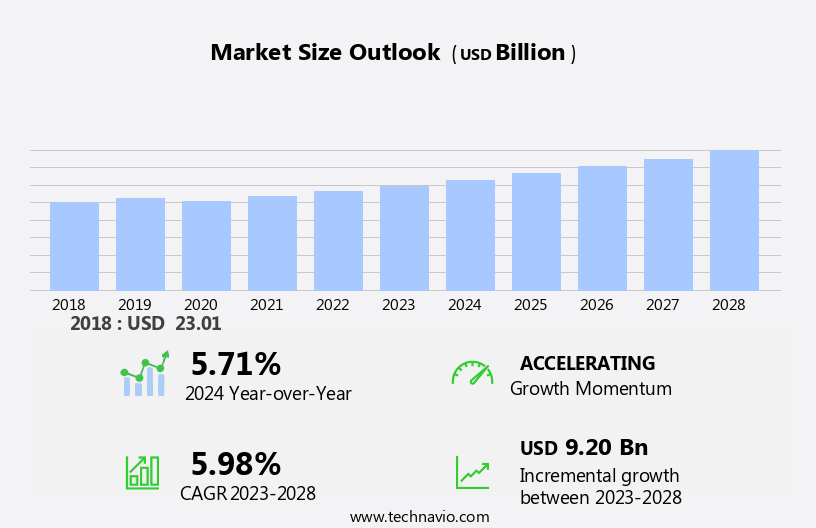
The automotive fleet leasing market size is forecast to increase by USD 9.20 billion at a CAGR of 5.98% between 2023 and 2028. The market is experiencing significant growth due to the increasing emphasis on cost-effective logistics and transportation solutions. The adoption of advanced technologies, such as GPS vehicle tracking and telematics, is enabling fleet managers to optimize routes, reduce idle time, and enhance fleet performance. These technologies also facilitate asset tracking and maintenance scheduling, leading to improved employee efficiency and customer satisfaction. Furthermore, the rise of electric and autonomous vehicles in the automotive fleet leasing industry is revolutionizing the way businesses manage their fleets. However, challenges remain, including limited customer awareness and acceptance in semi-urban and rural areas. To stay competitive, fleet leasing companies must continuously innovate and adapt to these trends and challenges.

What will be the Size of the Market During the Forecast Period?

Automotive Fleet Leasing Market Size

 Request Free Sample

The market is a significant sector within the transportation industry, catering to the needs of various businesses for motorized assets. This market encompasses a diverse range of vehicle types, including semi-tractors with trailers, small vehicles, medium-sized vehicles, and more. Businesses rely on fleet leasing to manage their daily transport activities, such as cargo transportation, service vans, rental cars, taxicabs, and even heavy machinery like bulldozers, backhoes, and skid-steer loaders. The choice of fuel type, such as gas, diesel, or aviation fuel, depends on the specific requirements of the business and the nature of the vehicles.

Furthermore, Fleet management plays a crucial role in this market, with businesses seeking efficient ways to manage their fleet operations. Fuel costs are a significant consideration, and fleet managers must ensure compliance with safety standards and various regulations. Preliminary steps in entering the fleet leasing market include analyzing business needs, considering the types of vehicles required, and evaluating the total cost of ownership. This includes not only the initial cost of the vehicle but also ongoing expenses like fuel, maintenance, and insurance. Businesses may require various types of vehicles for their operations, such as SUVs, pickup trucks, passenger vans, buses, and box trucks.

Moreover, the horsepower and other specifications of these vehicles will depend on the intended use. Fleet leasing companies offer flexible lease terms and customizable solutions to cater to the unique needs of businesses. They may also provide additional services, such as maintenance and repair, to ensure the smooth operation of their clients' fleets. In conclusion, the market offers businesses a cost-effective and efficient solution for managing their motorized assets. By carefully considering their business needs and evaluating the total cost of ownership, businesses can make informed decisions when choosing a fleet leasing provider.

Market Segmentation

The market research report provides comprehensive data (region-wise segment analysis), with forecasts and estimates in "USD billion" for the period 2024-2028, as well as historical data from 2018-2022 for the following segments.

  • Vehicle Type
    • Passenger cars
    • Commercial vehicles
  • Type
    • Open ended
    • Close ended
  • Geography
    • APAC
      • China
    • Europe
      • Germany
      • UK
      • France
    • North America
      • US
    • Middle East and Africa
    • South America

By Vehicle Type Insights

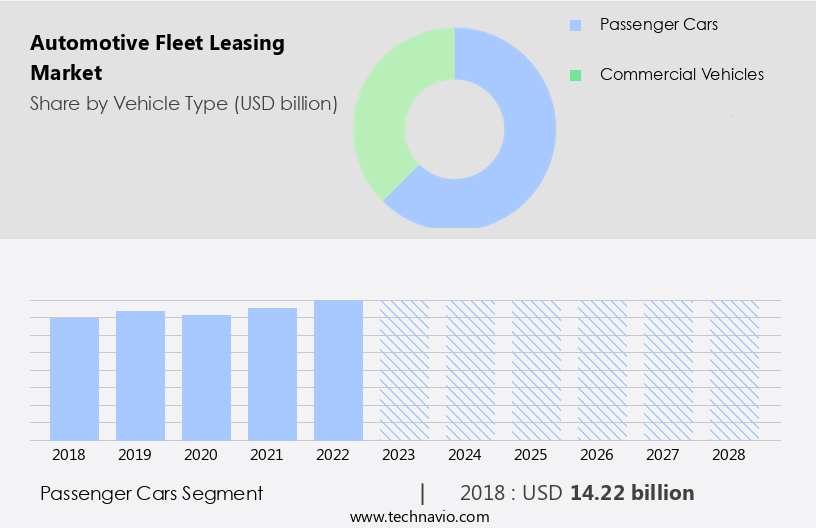
The passenger cars segment is estimated to witness significant growth during the forecast period. The passenger car segment is a crucial part of The market, serving diverse business needs and mirroring the shifting preferences of corporate vehicle users. This segment includes sedans, SUVs, and compact cars, making up a significant portion of the fleet leasing industry's offerings. Its versatility lies in its ability to cater to the transportation needs of businesses across various sectors, from corporations to transportation service providers. In recent times, there has been a notable trend towards incorporating eco-friendly and technologically advanced vehicles in the passenger cars segment. Service vans, rental cars, taxis, and construction equipment such as bulldozers, backhoes, and skid-steer loaders also constitute essential components of the market.

Furthermore, the fuel types used in these vehicles vary, with some relying on gas, while others prefer diesel or aviation fuel. The fleet leasing industry offers customized solutions to meet the unique requirements of each business, ensuring optimal efficiency and cost savings. The market caters to a diverse range of industries and applications, from passenger cars for corporate transportation to heavy-duty vehicles for construction and industrial projects. The market's growth is driven by factors such as the need for cost savings, operational efficiency, and the increasing popularity of eco-friendly and technologically advanced vehicles. The flexibility and convenience offered by fleet leasing solutions continue to make them an attractive option for businesses looking to manage their transportation needs effectively.

Automotive Fleet Leasing Market Size

Get a glance at the market share of various segments Request Free Sample

The passenger cars segment accounted for USD 14.22 billion in 2018 and showed a gradual increase during the forecast period.

Regional Insights

APAC is estimated to contribute 36% to the growth of the global market during the forecast period. Technavio’s analysts have elaborately explained the regional trends and drivers that shape the market during the forecast period.

Automotive Fleet Leasing Market Share by Geography

For more insights on the market share of various regions Request Free Sample

The market in Asia Pacific (APAC) is experiencing significant growth due to its cost-effective advantages. While fleet purchases remain popular, leasing is becoming an increasingly attractive option for businesses seeking to enhance productivity and manage tasks more efficiently. In 2023, China, India, Australia, South Korea, Japan, and Indonesia were the leading markets for automotive fleet leasing in APAC, accounting for a substantial portion of the global leasing volume. The region's large automotive production, growing population, and increasing spending power create a favorable environment for the expansion of automotive leasing. Despite the prevalence of fleet ownership in APAC, leasing offers numerous benefits, including fuel management, driver safety, and risk minimization. Technology and software solutions are driving innovation in the market, making it easier for businesses to manage their fleets and optimize operations. The potential for growth in the APAC market is substantial, making it an area of interest for businesses seeking to streamline their transportation needs.

Our researchers analyzed the data with 2023 as the base year, along with the key drivers, trends, and challenges. A holistic analysis of drivers will help companies refine their marketing strategies to gain a competitive advantage.

Market Driver

The rise in focus on cost-effective solutions in logistics and transportation sector is the key driver of the market. The market is witnessing growing demand due to the financial advantages it provides to businesses. Companies across various industries are adopting fleet leasing as an efficient strategy for managing their vehicle needs. Preventive maintenance is a crucial aspect of fleet leasing, ensuring minimal downtime and maximizing vehicle utilization. Leasing companies offer real-time visibility into fleet operations, enabling data-driven decisions that enhance profitability.

Fuel savings are another significant benefit, as leasing companies often have economies of scale that result in lower fuel costs. Customer service is a priority in fleet leasing, with leasing companies providing comprehensive support to ensure optimal fleet performance. By choosing fleet leasing over vehicle ownership, businesses can streamline their processes, reduce upfront costs, and make informed decisions based on accurate data. This approach allows companies to allocate resources effectively and mitigate financial risk.

Market Trends

The rise in the adoption of electric and autonomous vehicles in automotive fleet leasing industry is the upcoming trend in the market. The market in the United States is witnessing a notable trend towards the adoption of electric and autonomous vehicles. This shift is driven by a combination of factors, including technological innovations, corporate sustainability initiatives, and the pursuit of operational efficiencies.

The growing preference for electric vehicles (EVs) in fleet leasing reflects the industry's commitment to environmental sustainability and regulatory compliance. Businesses across various sectors are capitalizing on the benefits of EVs to reduce their carbon footprint and meet sustainability targets. The automotive fleet leasing industry is evolving, with a focus on safety education programs and fuel price volatility management to ensure the optimal utilization of resources.

Market Challenge

Limited customer awareness and acceptance in semi-urban and rural areas is a key challenge affecting the market growth. Automotive fleet leasing has been a popular business model in urban areas for over a decade, yet its reach remains limited in semi-urban and rural regions. The complexity of leasing terminology, such as money factor, residual value, and capitalized costs, can deter potential customers in these areas. However, the integration of advanced technologies like GPS vehicle tracking and telematics in fleet management is transforming the industry. These technologies enable fleet managers to optimize routes, reduce idle time, and enhance asset tracking, leading to improved fleet performance and employee efficiency.

Moreover, real-time data analysis helps in proactive maintenance, ensuring vehicle reliability and reducing downtime. By leveraging these benefits, fleet leasing companies can boost customer satisfaction and expand their market reach beyond urban areas. Incorporating these technologies into fleet management solutions can help demystify leasing terminology and make the business model more accessible to a wider audience.

Exclusive Customer Landscape

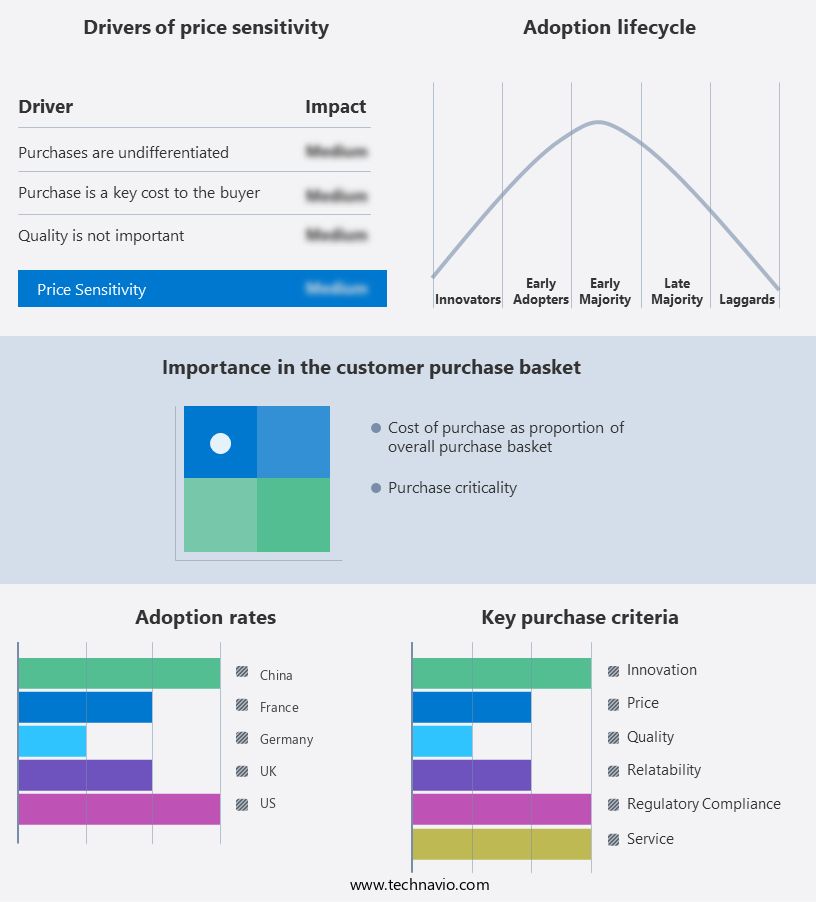
The market forecasting report includes the adoption lifecycle of the market, covering from the innovator’s stage to the laggard’s stage. It focuses on adoption rates in different regions based on penetration. Furthermore, the report also includes key purchase criteria and drivers of price sensitivity to help companies evaluate and develop their market growth analysis strategies.

Automotive Fleet Leasing Market Share by Geography

 Customer Landscape

Key Companies & Market Insights

Companies are implementing various strategies, such as strategic alliances, partnerships, mergers and acquisitions, geographical expansion, and product/service launches, to enhance their presence in the market.

ALD SA - The company offers automotive fleet leasing, including maintenance, roadside assistance, relief cars, scheduling services, and repairs through an approved network of franchised dealers.

The market research and growth report includes detailed analyses of the competitive landscape of the market and information about key companies, including:

  • Avis Leasing
  • Donlen Corp.
  • Element Fleet Management Corp.
  • Emkay Inc.
  • Enterprise Holdings Inc.
  • Flex Fleet Rental
  • Hertz Global Holdings Inc.
  • Holman Inc.
  • Inchcape Plc
  • Mercedes Benz Group AG
  • Merchants Fleet
  • Milestone Equipment Holdings LLC
  • Nissan Motor Co. Ltd.
  • Ryder System Inc.
  • SG fleet Group
  • SIXT SE
  • Solera Holdings LLC
  • TomTom NV
  • Union Leasing Inc.
  • Wheels Inc.

Qualitative and quantitative analysis of companies has been conducted to help clients understand the wider business environment as well as the strengths and weaknesses of key market players. Data is qualitatively analyzed to categorize companies as pure play, category-focused, industry-focused, and diversified; it is quantitatively analyzed to categorize companies as dominant, leading, strong, tentative, and weak.

Research Analyst Overview

The market caters to businesses requiring motorized assets for their daily operations. This market includes various types of vehicles such as semi-trucks with trailers, medium-sized buses, SUVs, pickup trucks, passenger vans, and box trucks. These vehicles are utilized for transporting cargo, providing passenger services, and operating heavy machinery like bulldozers, backhoes, and skid-steer loaders. Businesses face numerous challenges in managing their fleet, including fuel costs, safety standards, and compliance laws. Preliminary steps include analyzing business needs, budget constraints, and vehicle specifications such as horsepower, passenger capacity, payload capacity, and towing capacity. Fleet management involves controlling costs, increasing productivity, and optimizing efficiency.

Furthermore, solutions include fuel management, driver safety programs, preventive maintenance, and real-time visibility through GPS vehicle tracking and telematics. Minimizing risk, downtime, and idle time, as well as optimizing routes, are essential for fleet performance and profitability. Customer service, employee efficiency, and customer satisfaction are crucial factors. Fuel price volatility necessitates data-driven decisions and fuel savings strategies. Additionally, safety education programs ensure regulatory compliance and reduce risks. Fleet management software solutions streamline processes, enhance productivity, and provide valuable insights for businesses.

Market Scope

Report Coverage

Details

Page number

150

Base year

2023

Historic period

2018-2022

Forecast period

2024-2028

Growth momentum & CAGR

Accelerate at a CAGR of 5.98%

Market growth 2024-2028

USD 9.20 billion

Market structure

Fragmented

YoY growth 2023-2024(%)

5.71

Regional analysis

APAC, Europe, North America, Middle East and Africa, and South America

Performing market contribution

APAC at 36%

Key countries

US, China, UK, Germany, and France

Competitive landscape

Leading Companies, Market Positioning of Companies, Competitive Strategies, and Industry Risks

Key companies profiled

ALD SA, Avis Leasing, Donlen Corp., Element Fleet Management Corp., Emkay Inc., Enterprise Holdings Inc., Flex Fleet Rental, Hertz Global Holdings Inc., Holman Inc., Inchcape Plc, Mercedes Benz Group AG, Merchants Fleet, Milestone Equipment Holdings LLC, Nissan Motor Co. Ltd., Ryder System Inc., SG fleet Group, SIXT SE, Solera Holdings LLC, TomTom NV, Union Leasing Inc., and Wheels Inc.

Market dynamics

Parent market analysis, market growth inducers and obstacles, market forecast, fast-growing and slow-growing segment analysis, COVID-19 impact and recovery analysis and future consumer dynamics, market condition analysis for the forecast period

Customization purview

If our market report has not included the data that you are looking for, you can reach out to our analysts and get segments customized.

Request Free Sample

What are the Key Data Covered in this Market Research and Growth Report?

  • CAGR of the market during the forecast period
  • Detailed information on factors that will drive the market growth and forecasting between 2024 and 2028
  • Precise estimation of the size of the market  and its contribution of the market in focus to the parent market
  • Accurate predictions about upcoming market growth and trends and changes in consumer behaviour
  • Growth of the market across APAC, Europe, North America, Middle East and Africa, and South America
  • Thorough analysis of the market’s competitive landscape and detailed information about companies
  • Comprehensive analysis of factors that will challenge the growth of market companies

We can help! Our analysts can customize this market research report to meet your requirements. Get in touch

1 Executive Summary

  • 1.1 Market overview
    • Exhibit 01: Executive Summary – Chart on Market Overview
    • Exhibit 02: Executive Summary – Data Table on Market Overview
    • Exhibit 03: Executive Summary – Chart on Global Market Characteristics
    • Exhibit 04: Executive Summary – Chart on Market by Geography
    • Exhibit 05: Executive Summary – Chart on Market Segmentation by Vehicle Type
    • Exhibit 06: Executive Summary – Chart on Market Segmentation by Type
    • Exhibit 07: Executive Summary – Chart on Incremental Growth
    • Exhibit 08: Executive Summary – Data Table on Incremental Growth
    • Exhibit 09: Executive Summary – Chart on Vendor Market Positioning

2 Market Landscape

  • 2.1 Market ecosystem
    • Exhibit 10: Parent market
    • Exhibit 11: Market Characteristics

3 Market Sizing

  • 3.1 Market definition
    • Exhibit 12: Offerings of vendors included in the market definition
  • 3.2 Market segment analysis
    • Exhibit 13: Market segments
  • 3.3 Market size 2023
    • 3.4 Market outlook: Forecast for 2023-2028
      • Exhibit 14: Chart on Global - Market size and forecast 2023-2028 ($ billion)
      • Exhibit 15: Data Table on Global - Market size and forecast 2023-2028 ($ billion)
      • Exhibit 16: Chart on Global Market: Year-over-year growth 2023-2028 (%)
      • Exhibit 17: Data Table on Global Market: Year-over-year growth 2023-2028 (%)

    4 Historic Market Size

    • 4.1 Global automotive fleet leasing market 2018 - 2022
      • Exhibit 18: Historic Market Size – Data Table on global automotive fleet leasing market 2018 - 2022 ($ billion)
    • 4.2 Vehicle Type Segment Analysis 2018 - 2022
      • Exhibit 19: Historic Market Size – Vehicle Type Segment 2018 - 2022 ($ billion)
    • 4.3 Type Segment Analysis 2018 - 2022
      • Exhibit 20: Historic Market Size – Type Segment 2018 - 2022 ($ billion)
    • 4.4 Geography Segment Analysis 2018 - 2022
      • Exhibit 21: Historic Market Size – Geography Segment 2018 - 2022 ($ billion)
    • 4.5 Country Segment Analysis 2018 - 2022
      • Exhibit 22: Historic Market Size – Country Segment 2018 - 2022 ($ billion)

    5 Five Forces Analysis

    • 5.1 Five forces summary
      • Exhibit 23: Five forces analysis - Comparison between 2023 and 2028
    • 5.2 Bargaining power of buyers
      • Exhibit 24: Chart on Bargaining power of buyers – Impact of key factors 2023 and 2028
    • 5.3 Bargaining power of suppliers
      • Exhibit 25: Bargaining power of suppliers – Impact of key factors in 2023 and 2028
    • 5.4 Threat of new entrants
      • Exhibit 26: Threat of new entrants – Impact of key factors in 2023 and 2028
    • 5.5 Threat of substitutes
      • Exhibit 27: Threat of substitutes – Impact of key factors in 2023 and 2028
    • 5.6 Threat of rivalry
      • Exhibit 28: Threat of rivalry – Impact of key factors in 2023 and 2028
    • 5.7 Market condition
      • Exhibit 29: Chart on Market condition - Five forces 2023 and 2028

    6 Market Segmentation by Vehicle Type

    • 6.1 Market segments
      • Exhibit 30: Chart on Vehicle Type - Market share 2023-2028 (%)
      • Exhibit 31: Data Table on Vehicle Type - Market share 2023-2028 (%)
    • 6.2 Comparison by Vehicle Type
      • Exhibit 32: Chart on Comparison by Vehicle Type
      • Exhibit 33: Data Table on Comparison by Vehicle Type
    • 6.3 Passenger cars - Market size and forecast 2023-2028
      • Exhibit 34: Chart on Passenger cars - Market size and forecast 2023-2028 ($ billion)
      • Exhibit 35: Data Table on Passenger cars - Market size and forecast 2023-2028 ($ billion)
      • Exhibit 36: Chart on Passenger cars - Year-over-year growth 2023-2028 (%)
      • Exhibit 37: Data Table on Passenger cars - Year-over-year growth 2023-2028 (%)
    • 6.4 Commercial vehicles - Market size and forecast 2023-2028
      • Exhibit 38: Chart on Commercial vehicles - Market size and forecast 2023-2028 ($ billion)
      • Exhibit 39: Data Table on Commercial vehicles - Market size and forecast 2023-2028 ($ billion)
      • Exhibit 40: Chart on Commercial vehicles - Year-over-year growth 2023-2028 (%)
      • Exhibit 41: Data Table on Commercial vehicles - Year-over-year growth 2023-2028 (%)
    • 6.5 Market opportunity by Vehicle Type
      • Exhibit 42: Market opportunity by Vehicle Type ($ billion)
      • Exhibit 43: Data Table on Market opportunity by Vehicle Type ($ billion)

    7 Market Segmentation by Type

    • 7.1 Market segments
      • Exhibit 44: Chart on Type - Market share 2023-2028 (%)
      • Exhibit 45: Data Table on Type - Market share 2023-2028 (%)
    • 7.2 Comparison by Type
      • Exhibit 46: Chart on Comparison by Type
      • Exhibit 47: Data Table on Comparison by Type
    • 7.3 Open ended - Market size and forecast 2023-2028
      • Exhibit 48: Chart on Open ended - Market size and forecast 2023-2028 ($ billion)
      • Exhibit 49: Data Table on Open ended - Market size and forecast 2023-2028 ($ billion)
      • Exhibit 50: Chart on Open ended - Year-over-year growth 2023-2028 (%)
      • Exhibit 51: Data Table on Open ended - Year-over-year growth 2023-2028 (%)
    • 7.4 Close ended - Market size and forecast 2023-2028
      • Exhibit 52: Chart on Close ended - Market size and forecast 2023-2028 ($ billion)
      • Exhibit 53: Data Table on Close ended - Market size and forecast 2023-2028 ($ billion)
      • Exhibit 54: Chart on Close ended - Year-over-year growth 2023-2028 (%)
      • Exhibit 55: Data Table on Close ended - Year-over-year growth 2023-2028 (%)
    • 7.5 Market opportunity by Type
      • Exhibit 56: Market opportunity by Type ($ billion)
      • Exhibit 57: Data Table on Market opportunity by Type ($ billion)

    8 Customer Landscape

    • 8.1 Customer landscape overview
      • Exhibit 58: Analysis of price sensitivity, lifecycle, customer purchase basket, adoption rates, and purchase criteria

    9 Geographic Landscape

    • 9.1 Geographic segmentation
      • Exhibit 59: Chart on Market share by geography 2023-2028 (%)
      • Exhibit 60: Data Table on Market share by geography 2023-2028 (%)
    • 9.2 Geographic comparison
      • Exhibit 61: Chart on Geographic comparison
      • Exhibit 62: Data Table on Geographic comparison
    • 9.3 APAC - Market size and forecast 2023-2028
      • Exhibit 63: Chart on APAC - Market size and forecast 2023-2028 ($ billion)
      • Exhibit 64: Data Table on APAC - Market size and forecast 2023-2028 ($ billion)
      • Exhibit 65: Chart on APAC - Year-over-year growth 2023-2028 (%)
      • Exhibit 66: Data Table on APAC - Year-over-year growth 2023-2028 (%)
    • 9.4 Europe - Market size and forecast 2023-2028
      • Exhibit 67: Chart on Europe - Market size and forecast 2023-2028 ($ billion)
      • Exhibit 68: Data Table on Europe - Market size and forecast 2023-2028 ($ billion)
      • Exhibit 69: Chart on Europe - Year-over-year growth 2023-2028 (%)
      • Exhibit 70: Data Table on Europe - Year-over-year growth 2023-2028 (%)
    • 9.5 North America - Market size and forecast 2023-2028
      • Exhibit 71: Chart on North America - Market size and forecast 2023-2028 ($ billion)
      • Exhibit 72: Data Table on North America - Market size and forecast 2023-2028 ($ billion)
      • Exhibit 73: Chart on North America - Year-over-year growth 2023-2028 (%)
      • Exhibit 74: Data Table on North America - Year-over-year growth 2023-2028 (%)
    • 9.6 Middle East and Africa - Market size and forecast 2023-2028
      • Exhibit 75: Chart on Middle East and Africa - Market size and forecast 2023-2028 ($ billion)
      • Exhibit 76: Data Table on Middle East and Africa - Market size and forecast 2023-2028 ($ billion)
      • Exhibit 77: Chart on Middle East and Africa - Year-over-year growth 2023-2028 (%)
      • Exhibit 78: Data Table on Middle East and Africa - Year-over-year growth 2023-2028 (%)
    • 9.7 South America - Market size and forecast 2023-2028
      • Exhibit 79: Chart on South America - Market size and forecast 2023-2028 ($ billion)
      • Exhibit 80: Data Table on South America - Market size and forecast 2023-2028 ($ billion)
      • Exhibit 81: Chart on South America - Year-over-year growth 2023-2028 (%)
      • Exhibit 82: Data Table on South America - Year-over-year growth 2023-2028 (%)
    • 9.8 US - Market size and forecast 2023-2028
      • Exhibit 83: Chart on US - Market size and forecast 2023-2028 ($ billion)
      • Exhibit 84: Data Table on US - Market size and forecast 2023-2028 ($ billion)
      • Exhibit 85: Chart on US - Year-over-year growth 2023-2028 (%)
      • Exhibit 86: Data Table on US - Year-over-year growth 2023-2028 (%)
    • 9.9 China - Market size and forecast 2023-2028
      • Exhibit 87: Chart on China - Market size and forecast 2023-2028 ($ billion)
      • Exhibit 88: Data Table on China - Market size and forecast 2023-2028 ($ billion)
      • Exhibit 89: Chart on China - Year-over-year growth 2023-2028 (%)
      • Exhibit 90: Data Table on China - Year-over-year growth 2023-2028 (%)
    • 9.10 UK - Market size and forecast 2023-2028
      • Exhibit 91: Chart on UK - Market size and forecast 2023-2028 ($ billion)
      • Exhibit 92: Data Table on UK - Market size and forecast 2023-2028 ($ billion)
      • Exhibit 93: Chart on UK - Year-over-year growth 2023-2028 (%)
      • Exhibit 94: Data Table on UK - Year-over-year growth 2023-2028 (%)
    • 9.11 Germany - Market size and forecast 2023-2028
      • Exhibit 95: Chart on Germany - Market size and forecast 2023-2028 ($ billion)
      • Exhibit 96: Data Table on Germany - Market size and forecast 2023-2028 ($ billion)
      • Exhibit 97: Chart on Germany - Year-over-year growth 2023-2028 (%)
      • Exhibit 98: Data Table on Germany - Year-over-year growth 2023-2028 (%)
    • 9.12 France - Market size and forecast 2023-2028
      • Exhibit 99: Chart on France - Market size and forecast 2023-2028 ($ billion)
      • Exhibit 100: Data Table on France - Market size and forecast 2023-2028 ($ billion)
      • Exhibit 101: Chart on France - Year-over-year growth 2023-2028 (%)
      • Exhibit 102: Data Table on France - Year-over-year growth 2023-2028 (%)
    • 9.13 Market opportunity by geography
      • Exhibit 103: Market opportunity by geography ($ billion)
      • Exhibit 104: Data Tables on Market opportunity by geography ($ billion)

    10 Drivers, Challenges, and Trends

    • 10.1 Market drivers
      • 10.2 Market challenges
        • 10.3 Impact of drivers and challenges
          • Exhibit 105: Impact of drivers and challenges in 2023 and 2028
        • 10.4 Market trends

          11 Vendor Landscape

          • 11.1 Overview
            • 11.2 Vendor landscape
              • Exhibit 106: Overview on Criticality of inputs and Factors of differentiation
            • 11.3 Landscape disruption
              • Exhibit 107: Overview on factors of disruption
            • 11.4 Industry risks
              • Exhibit 108: Impact of key risks on business

            12 Vendor Analysis

            • 12.1 Vendors covered
              • Exhibit 109: Vendors covered
            • 12.2 Market positioning of vendors
              • Exhibit 110: Matrix on vendor position and classification
            • 12.3 ALD SA
              • Exhibit 111: ALD SA - Overview
              • Exhibit 112: ALD SA - Business segments
              • Exhibit 113: ALD SA - Key news
              • Exhibit 114: ALD SA - Key offerings
              • Exhibit 115: ALD SA - Segment focus
            • 12.4 Avis Leasing
              • Exhibit 116: Avis Leasing - Overview
              • Exhibit 117: Avis Leasing - Product / Service
              • Exhibit 118: Avis Leasing - Key offerings
            • 12.5 Donlen Corp.
              • Exhibit 119: Donlen Corp. - Overview
              • Exhibit 120: Donlen Corp. - Product / Service
              • Exhibit 121: Donlen Corp. - Key offerings
            • 12.6 Emkay Inc.
              • Exhibit 122: Emkay Inc. - Overview
              • Exhibit 123: Emkay Inc. - Product / Service
              • Exhibit 124: Emkay Inc. - Key offerings
            • 12.7 Enterprise Holdings Inc.
              • Exhibit 125: Enterprise Holdings Inc. - Overview
              • Exhibit 126: Enterprise Holdings Inc. - Product / Service
              • Exhibit 127: Enterprise Holdings Inc. - Key offerings
            • 12.8 Hertz Global Holdings Inc.
              • Exhibit 128: Hertz Global Holdings Inc. - Overview
              • Exhibit 129: Hertz Global Holdings Inc. - Business segments
              • Exhibit 130: Hertz Global Holdings Inc. - Key offerings
              • Exhibit 131: Hertz Global Holdings Inc. - Segment focus
            • 12.9 Holman Inc.
              • Exhibit 132: Holman Inc. - Overview
              • Exhibit 133: Holman Inc. - Product / Service
              • Exhibit 134: Holman Inc. - Key offerings
            • 12.10 Inchcape Plc
              • Exhibit 135: Inchcape Plc - Overview
              • Exhibit 136: Inchcape Plc - Product / Service
              • Exhibit 137: Inchcape Plc - Key offerings
            • 12.11 Mercedes Benz Group AG
              • Exhibit 138: Mercedes Benz Group AG - Overview
              • Exhibit 139: Mercedes Benz Group AG - Business segments
              • Exhibit 140: Mercedes Benz Group AG - Key offerings
              • Exhibit 141: Mercedes Benz Group AG - Segment focus
            • 12.12 Merchants Fleet
              • Exhibit 142: Merchants Fleet - Overview
              • Exhibit 143: Merchants Fleet - Product / Service
              • Exhibit 144: Merchants Fleet - Key offerings
            • 12.13 Milestone Equipment Holdings LLC
              • Exhibit 145: Milestone Equipment Holdings LLC - Overview
              • Exhibit 146: Milestone Equipment Holdings LLC - Product / Service
              • Exhibit 147: Milestone Equipment Holdings LLC - Key offerings
            • 12.14 SIXT SE
              • Exhibit 148: SIXT SE - Overview
              • Exhibit 149: SIXT SE - Business segments
              • Exhibit 150: SIXT SE - Key news
              • Exhibit 151: SIXT SE - Key offerings
              • Exhibit 152: SIXT SE - Segment focus
            • 12.15 Solera Holdings LLC
              • Exhibit 153: Solera Holdings LLC - Overview
              • Exhibit 154: Solera Holdings LLC - Product / Service
              • Exhibit 155: Solera Holdings LLC - Key offerings
            • 12.16 Union Leasing Inc.
              • Exhibit 156: Union Leasing Inc. - Overview
              • Exhibit 157: Union Leasing Inc. - Product / Service
              • Exhibit 158: Union Leasing Inc. - Key offerings
            • 12.17 Wheels Inc.
              • Exhibit 159: Wheels Inc. - Overview
              • Exhibit 160: Wheels Inc. - Product / Service
              • Exhibit 161: Wheels Inc. - Key offerings

            13 Appendix

            • 13.1 Scope of the report
              • 13.2 Inclusions and exclusions checklist
                • Exhibit 162: Inclusions checklist
                • Exhibit 163: Exclusions checklist
              • 13.3 Currency conversion rates for US$
                • Exhibit 164: Currency conversion rates for US$
              • 13.4 Research methodology
                • Exhibit 165: Research methodology
                • Exhibit 166: Validation techniques employed for market sizing
                • Exhibit 167: Information sources
              • 13.5 List of abbreviations
                • Exhibit 168: List of abbreviations

              Research Methodology

              Technavio presents a detailed picture of the market by way of study, synthesis, and summation of data from multiple sources. The analysts have presented the various facets of the market with a particular focus on identifying the key industry influencers. The data thus presented is comprehensive, reliable, and the result of extensive research, both primary and secondary.

              INFORMATION SOURCES

              Primary sources

              • Manufacturers and suppliers
              • Channel partners
              • Industry experts
              • Strategic decision makers

              Secondary sources

              • Industry journals and periodicals
              • Government data
              • Financial reports of key industry players
              • Historical data
              • Press releases

              DATA ANALYSIS

              Data Synthesis

              • Collation of data
              • Estimation of key figures
              • Analysis of derived insights

              Data Validation

              • Triangulation with data models
              • Reference against proprietary databases
              • Corroboration with industry experts

              REPORT WRITING

              Qualitative

              • Market drivers
              • Market challenges
              • Market trends
              • Five forces analysis

              Quantitative

              • Market size and forecast
              • Market segmentation
              • Geographical insights
              • Competitive landscape

              Interested in this report?

              Get your sample now to see our research methodology and insights!

              Download Now

              Frequently Asked Questions

              Automotive Fleet Leasing market growth will increase by $ 9.20 bn during 2024-2028 .

              The Automotive Fleet Leasing market is expected to grow at a CAGR of 5.98% during 2024-2028 .

              Automotive Fleet Leasing market is segmented by Vehicle Type( Passenger cars, Commercial vehicles) Type( Open ended, Close ended)

              ALD SA, Avis Leasing, Donlen Corp., Element Fleet Management Corp., Emkay Inc., Enterprise Holdings Inc., Flex Fleet Rental, Hertz Global Holdings Inc., Holman Inc., Inchcape Plc, Mercedes Benz Group AG, Merchants Fleet, Milestone Equipment Holdings LLC, Nissan Motor Co. Ltd., Ryder System Inc., SG fleet Group, SIXT SE, Solera Holdings LLC, TomTom NV, Union Leasing Inc., Wheels Inc. are a few of the key vendors in the Automotive Fleet Leasing market.

              APAC will register the highest growth rate of 36% among the other regions. Therefore, the Automotive Fleet Leasing market in APAC is expected to garner significant business opportunities for the vendors during the forecast period.

              US, China, UK, Germany, France

              • Rise in focus on cost-effective solutions in logistics and transportation sectorThe global automotive fleet leasing market is experiencing a significant rise in focus on cost-effective solutions. Businesses across various industries are increasingly turning to fleet leasing as a strategic approach to managing their vehicle requirements while reaping the benefits of cost efficiency. One of the primary drivers behind the surge in focus on cost-effective solutions in the global automotive fleet leasing market is the financial advantage it offers to businesses. By opting for leasing over vehicle ownership is the driving factor this market.
              • companies can minimize their initial capital expenditure is the driving factor this market.
              • avoiding the significant upfront costs associated with purchasing a fleet of vehicles. This financial benefit is particularly pertinent for businesses seeking to allocate their resources judiciously and minimize financial risk. For instance is the driving factor this market.
              • in the logistics and transportation sectors is the driving factor this market.
              • automotive fleet leasing is a popular option. Automotive fleet leasing companies such as Element Vehicle Management Services Group LLC (Element Vehicle Management Services) is the driving factor this market.
              • Wheels Inc (Wheels) is the driving factor this market.
              • Donlen Corp (Donlen) is the driving factor this market.
              • and others offer a wide variety of fleet lease options to choose from is the driving factor this market.
              • such as sedans is the driving factor this market.
              • suburbans is the driving factor this market.
              • carrier vans is the driving factor this market.
              • trucks is the driving factor this market.
              • and even semi-trucks with flexibility and options. This approach enables the logistics and transportation sector to conserve its capital is the driving factor this market.
              • directing it towards other critical areas such as infrastructure development is the driving factor this market.
              • marketing is the driving factor this market.
              • or talent acquisition. As a result is the driving factor this market.
              • the logistics and transportation sectors can pursue their expansion plans without being encumbered by the immediate financial burden of vehicle acquisition is the driving factor this market.
              • showcasing a clear example of the cost-effective nature of fleet leasing. The cost efficiency of fleet leasing extends beyond the initial acquisition phase. Leasing agreements often encompass maintenance is the driving factor this market.
              • servicing is the driving factor this market.
              • and is the driving factor this market.
              • in some cases is the driving factor this market.
              • insurance is the driving factor this market.
              • providing businesses with predictable and manageable monthly expenses. By outsourcing these operational aspects to the leasing provider is the driving factor this market.
              • companies can streamline their budgeting processes is the driving factor this market.
              • reduce unexpected maintenance costs is the driving factor this market.
              • and enhance financial predictability. Thus is the driving factor this market.
              • the above-mentioned advantages are expected to increase the adoption of automotive fleet leasing is the driving factor this market.
              • which will propel the growth of the global automotive fleet leasing market during the forecast period. is the driving factor this market.

              The Automotive Fleet Leasing market vendors should focus on grabbing business opportunities from the Passenger cars segment as it accounted for the largest market share in the base year.