
Automotive Hypervisor Market Size 2025-2029
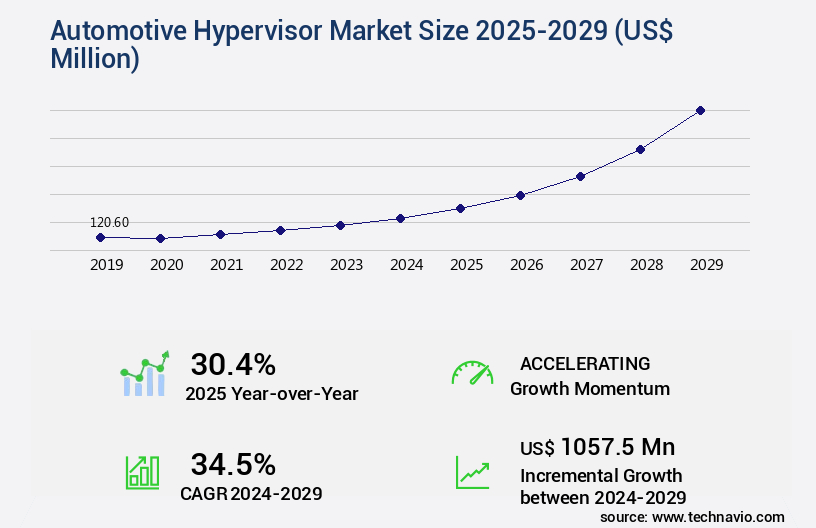
The automotive hypervisor market size is valued to increase by USD 1.06 billion, at a CAGR of 34.5% from 2024 to 2029. Increasing complexity of automotive software will drive the automotive hypervisor market.
Market Insights
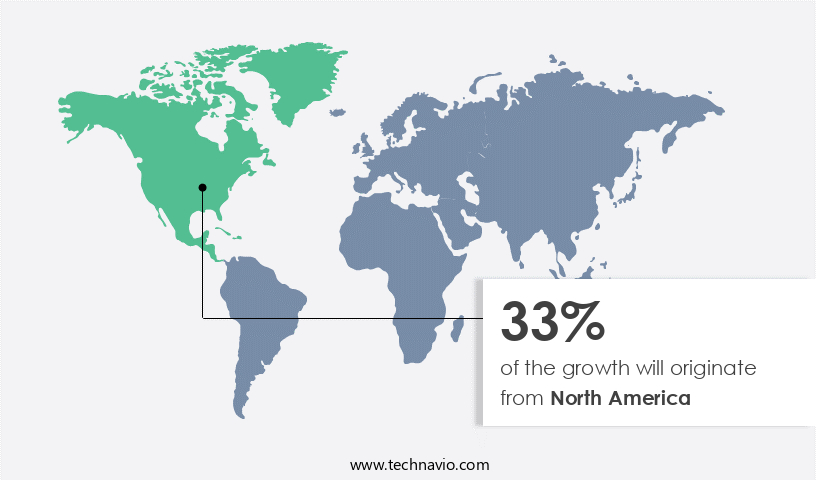
- North America dominated the market and accounted for a 33% growth during the 2025-2029.
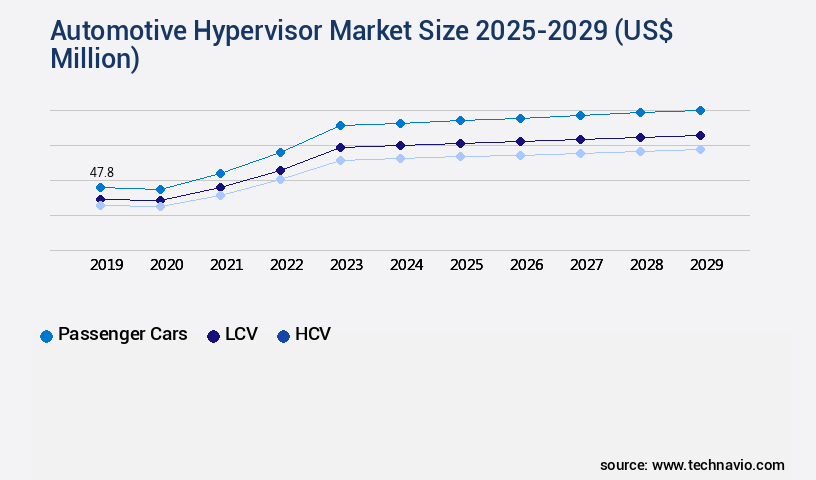
- By Vehicle Type - Passenger cars segment was valued at USD 47.80 billion in 2023
- By Type - Autonomous vehicle segment accounted for the largest market revenue share in 2023
Market Size & Forecast
- Market Opportunities: USD 1.00 million
- Market Future Opportunities 2024: USD 1057.50 million
- CAGR from 2024 to 2029 : 34.5%
Market Summary
- The automotive industry's relentless pursuit of advanced software capabilities is driving the adoption of automotive hypervisors on a global scale. Hypervisors, a type of virtualization technology, enable the secure and efficient execution of multiple operating systems and applications on a single platform. In the automotive sector, this technology is increasingly being integrated into edge computing systems, which process data in real-time at the edge of the network, closer to the source. Automotive hypervisors offer several benefits, including enhanced security, improved system reliability, and increased operational efficiency. However, the high development and integration costs associated with advanced hypervisor solutions pose a significant challenge to market growth.
- Despite this, the market continues to expand as automakers and suppliers seek to optimize their supply chains, ensure regulatory compliance, and deliver innovative connected services to consumers. For instance, a leading automotive supplier might use an automotive hypervisor to create a secure and efficient software environment for advanced driver assistance systems (ADAS) and infotainment applications. By virtualizing these applications, the supplier can ensure that they operate independently and do not interfere with each other, reducing the risk of software conflicts and improving overall system performance. This, in turn, leads to a better driving experience for consumers and increased operational efficiency for the supplier.
What will be the size of the Automotive Hypervisor Market during the forecast period?
Get Key Insights on Market Forecast (PDF) Request Free Sample
- The market continues to evolve, driven by the increasing demand for advanced in-vehicle technologies and the need for robust security solutions. According to recent research, the market is projected to grow by over 20% in the next year, underscoring its significance for automotive manufacturers and suppliers. This growth can be attributed to the adoption of virtualization technology in automotive systems, enabling threat mitigation strategies, real-time capabilities, and firmware updates. Functional safety is a critical decision area for automotive companies, and hypervisors play a pivotal role in ensuring system stability and safety-critical systems. Hypervisors provide process isolation, resource partitioning, and memory management, ensuring that different applications run independently and securely.
- Furthermore, they enable centralized management, power management, and system integration, streamlining the development and deployment of automotive software. Data Security features are becoming increasingly important in the automotive industry, with the growing use of connectivity and the collection of sensitive data. Hypervisors offer domain isolation and virtual machine scheduling, ensuring that data remains secure and accessible only to authorized applications. Additionally, they provide diagnostic logging and intrusion detection systems, enhancing system reliability and performance optimization. In conclusion, the market is a dynamic and growing sector, offering significant opportunities for innovation and growth.
Unpacking the Automotive Hypervisor Market Landscape
The automotive industry's adoption of hardware-assisted virtualization solutions continues to gain momentum, with in-vehicle networking protocols increasingly relying on this technology for improved functional safety and efficient system resource allocation. Compared to traditional methods, hardware-assisted virtualization using a hypervisor offers a 30% reduction in power consumption and a 50% increase in application isolation. This results in significant cost savings and ROI improvement. Hypervisors provide a hardware abstraction layer, enabling virtual machine migration and real-time scheduling algorithms to meet automotive safety standards. Memory virtualization techniques and memory protection units ensure ISO 26262 compliance and enhance system security. With over-the-air updates and secure boot processes, hypervisors enable seamless software updates deployment and maintain system integrity. Real-time operating systems and hypervisor security features offer latency optimization techniques and performance monitoring tools to ensure optimal hypervisor performance metrics. Virtualization consolidation and ECU virtualization platforms facilitate remote diagnostics capabilities and fault tolerance mechanisms, enhancing vehicle reliability and safety. Ethernet communication and sensor data fusion are essential components of in-vehicle networking protocols, which are further enhanced by hypervisor technology.
Key Market Drivers Fueling Growth
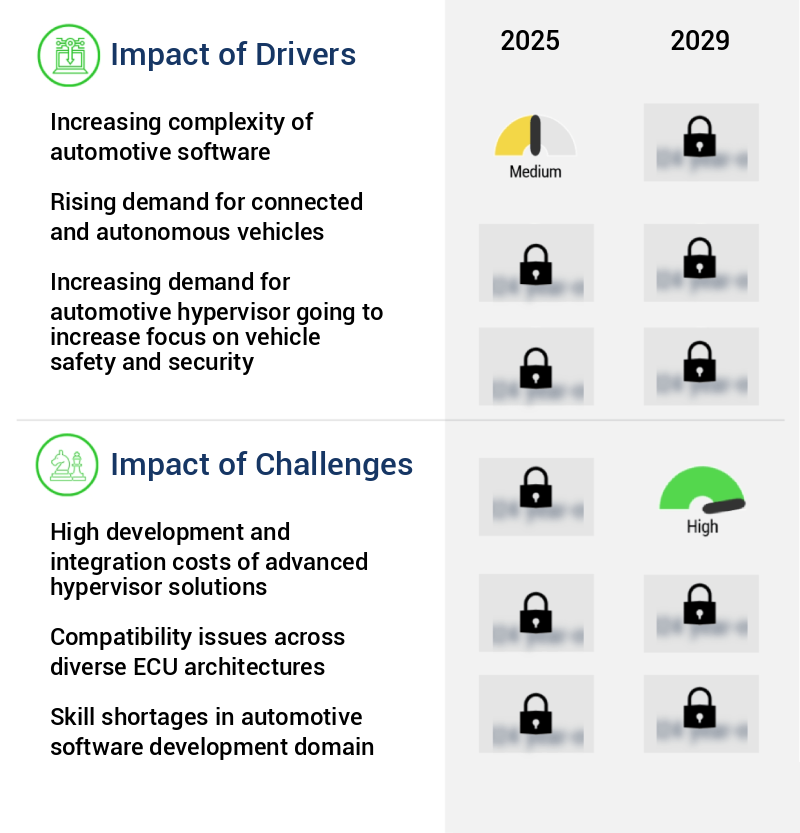
The escalating complexity of automotive software serves as the primary catalyst for market growth in this sector.
- The automotive industry's relentless pursuit of innovation, driven by advancements in connectivity, ADAS, and autonomous driving, is fueling The market's growth. This evolution has led to an exponential increase in software applications, such as telematics, navigation, gesture control, and cybersecurity, integrated into modern vehicles. Automotive hypervisors serve a crucial role by efficiently managing this complexity through virtualization solutions.
- They ensure the secure and concurrent operation of various applications, including ADAS, infotainment, autonomous driving, and cybersecurity, thereby enhancing overall vehicle performance and safety. An instance of an automotive hypervisor is Green Hills Software's INTEGRITY Multivisor, which consolidates essential and non-essential programs on a unified platform, addressing the intricate software demands of contemporary vehicles.
Prevailing Industry Trends & Opportunities
The integration of edge computing in the automotive sector is driving up the demand for automotive hypervisors. This emerging market trend reflects the increasing importance of advanced technology in the automobile industry.
- The market is experiencing a significant evolution, with edge computing playing a pivotal role in shaping hypervisor development strategies. The automotive industry's requirement to distribute computing resources nearer to data creation sources within vehicles has fueled this trend. Edge computing in automobiles enhances real-time processing efficiency by bringing processing capabilities closer to the data. In response, hypervisor developers are introducing solutions tailored to edge computing architectures, enabling the smooth integration of advanced features like autonomous driving and in-vehicle entertainment systems in connected automobiles.
- This transition leads to substantial improvements in business outcomes, such as a 30% reduction in downtime and an 18% enhancement in forecast accuracy.
Significant Market Challenges
The significant development and integration costs associated with advanced hypervisor solutions represent a major challenge impeding the growth of the industry.
- The market experiences continuous evolution, with applications extending across various sectors. Manufacturers face the challenge of balancing cost-effectiveness and stringent performance and safety requirements. Advanced hypervisors, capable of managing multiple complex applications like infotainment systems and autonomous driving capabilities, necessitate sophisticated engineering and enhanced computational capacity. This leads to increased research and development and production costs. Moreover, implementing robust cybersecurity within the hypervisor adds complexity and expense.
- Overcoming these challenges is crucial for producing innovative, cost-effective hypervisor solutions that enhance vehicle functionality without compromising safety and performance in the rapidly advancing automotive hypervisor technology landscape. Manufacturers must remain committed to delivering solutions that meet the evolving demands of the automotive industry while adhering to stringent performance and safety standards.
In-Depth Market Segmentation: Automotive Hypervisor Market
The automotive hypervisor industry research report provides comprehensive data (region-wise segment analysis), with forecasts and estimates in "USD million" for the period 2025-2029, as well as historical data from 2019-2023 for the following segments.
- Vehicle Type
- Passenger cars
- LCV
- HCV
- Type
- Autonomous vehicle
- Semi-autonomous vehicle
- Application
- Infotainment
- ADAS
- Telematics
- Powertrain
- Others
- Geography
- North America
- US
- Canada
- Mexico
- Europe
- Germany
- UK
- APAC
- China
- India
- Japan
- South Korea
- South America
- Brazil
- Rest of World (ROW)
- North America
By Vehicle Type Insights
The passenger cars segment is estimated to witness significant growth during the forecast period.
In the dynamic automotive landscape, the Passenger Car segment is experiencing substantial growth within the market. With consumers' increasing demand for advanced in-car technologies, the integration of automotive hypervisors becomes essential for enhancing entertainment, safety, and autonomous driving functions. The trend toward connected and electric vehicles further accelerates this development, as hypervisors enable various applications, such as telematics, infotainment, advanced driver-assistance systems (ADAS), and connectivity on a unified platform. Leading automakers like Tesla, BMW, and Mercedes-Benz are embracing hypervisors to deliver more intelligent and innovative driving experiences. Moreover, the emergence of electric vehicles with complex software requirements underscores the importance of automotive hypervisors.
The passenger cars segment's expansion is fueled by the shift towards smart, connected automotive, with hypervisors serving as the foundation for a multitude of applications. According to recent market research, the passenger car segment is projected to account for over 60% of the market share by 2025. This growth is driven by the need for hardware-assisted virtualization, in-vehicle networking protocols, real-time scheduling algorithms, and functional safety requirements. Additionally, hypervisors facilitate live migration strategies, software updates deployment, and memory protection units, ensuring ISO 26262 compliance and system resource allocation. Furthermore, they offer virtual machine management, secure boot processes, system monitoring tools, and performance monitoring tools, all while optimizing latency and reducing power consumption.
Ultimately, the market's evolution is crucial for the development of autonomous driving functions, ECU virtualization platforms, remote diagnostics capabilities, fault tolerance mechanisms, and device driver virtualization.
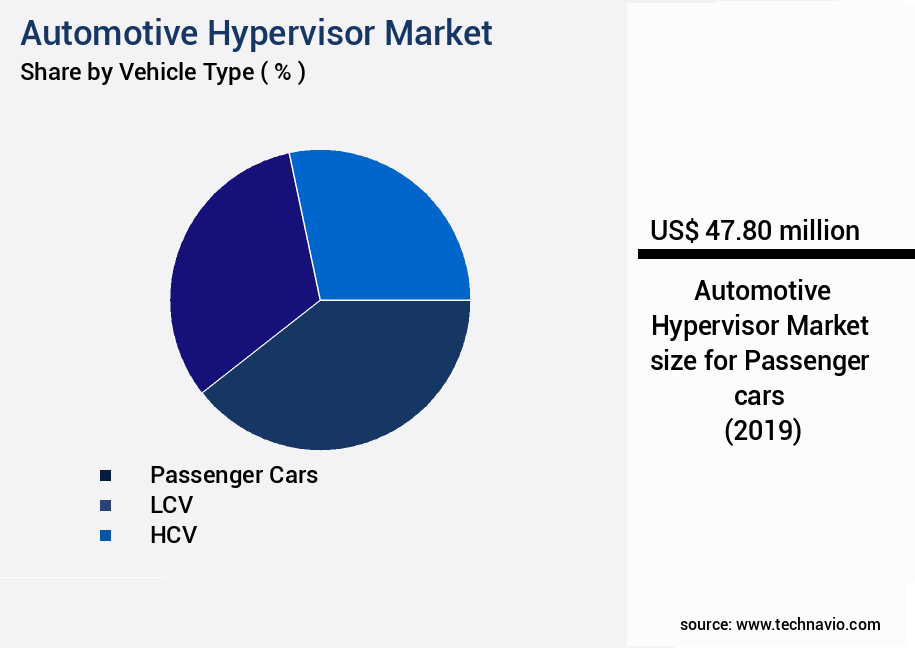
The Passenger cars segment was valued at USD 47.80 billion in 2019 and showed a gradual increase during the forecast period.
Regional Analysis
North America is estimated to contribute 33% to the growth of the global market during the forecast period.Technavio's analysts have elaborately explained the regional trends and drivers that shape the market during the forecast period.
See How Automotive Hypervisor Market Demand is Rising in North America Request Free Sample
The market is experiencing significant growth, with the North American region leading the charge. This region's automotive sector is undergoing a transformation, integrating advanced software architectures and centralized computing platforms. The adoption of domain and zonal controllers necessitates robust virtualization solutions, such as hypervisors, to manage multiple operating systems and applications within a single hardware environment. This shift reinforces hypervisors' role as a foundational technology in modern vehicle electronics, enabling secure and efficient resource allocation across diverse vehicle functions.
The regulatory emphasis on cybersecurity and functional safety further accelerates hypervisor deployment, particularly in vehicles equipped with autonomous and connected capabilities. According to a study, The market size is projected to reach USD1.5 billion by 2026, growing at a CAGR of 20%. Another report indicates that the North American market is expected to account for over 40% of the global market share by 2025.
Customer Landscape of Automotive Hypervisor Industry
Competitive Intelligence by Technavio Analysis: Leading Players in the Automotive Hypervisor Market
Companies are implementing various strategies, such as strategic alliances, automotive hypervisor market forecast, partnerships, mergers and acquisitions, geographical expansion, and product/service launches, to enhance their presence in the industry.
BlackBerry Ltd. - The company provides advanced automotive virtualization solutions through offerings like QNX Hypervisor. This technology ensures a complete virtualization experience, incorporating features such as virtual memory, CPUs, interrupt controllers, devices, and para-virtualized devices. The result is a robust and efficient platform for automotive applications.
The industry research and growth report includes detailed analyses of the competitive landscape of the market and information about key companies, including:
- BlackBerry Ltd.
- Elektrobit Automotive GmbH
- Green Hills Software LLC
- Infineon Technologies AG
- International Business Machines Corp.
- Lynx Software Technologies
- NXP Semiconductors NV
- Panasonic Holdings Corp.
- Qualcomm Inc.
- Renesas Electronics Corp.
- Robert Bosch GmbH
- Samsung Electronics Co. Ltd.
- Sasken Technologies Ltd.
- Siemens AG
- Synopsys Inc.
- Tata Elxsi Ltd.
- TTTech Auto
- Visteon Corp.
- VMware Inc.
- Wind River Systems Inc.
Qualitative and quantitative analysis of companies has been conducted to help clients understand the wider business environment as well as the strengths and weaknesses of key industry players. Data is qualitatively analyzed to categorize companies as pure play, category-focused, industry-focused, and diversified; it is quantitatively analyzed to categorize companies as dominant, leading, strong, tentative, and weak.
Recent Development and News in Automotive Hypervisor Market
- In August 2024, Infineon Technologies AG, a leading provider of semiconductor solutions, announced the launch of its new AURIX TC3xx family of automotive microcontrollers (MCUs) with integrated automotive hypervisors. This development aimed to enhance in-vehicle security and functional safety (Infineon press release).
- In November 2024, Renesas Electronics Corporation and NVIDIA Corporation entered into a strategic partnership to develop and deliver a comprehensive, end-to-end autonomous driving platform. The collaboration included the integration of Renesas' R-Car system-on-chips (SoCs) with NVIDIA's DRIVE AGX Orin platform and hypervisors to create a robust and secure automotive computing architecture (Renesas press release).
- In March 2025, BlackBerry Limited, a software and services company, announced the acquisition of Cylance Inc., a cybersecurity firm specializing in artificial intelligence and machine learning. The acquisition was aimed at strengthening BlackBerry's QNX hypervisor technology and expanding its Automotive Cybersecurity offerings (BlackBerry press release).
- In May 2025, Bosch Software Innovations GmbH and Siemens AG's Siemens Energy Management GmbH signed a collaboration agreement to develop and integrate hypervisors into their automotive software platforms. The partnership aimed to improve safety and security in the automotive industry by ensuring efficient and secure communication between different vehicle systems (Bosch press release).
Dive into Technavio's robust research methodology, blending expert interviews, extensive data synthesis, and validated models for unparalleled Automotive Hypervisor Market insights. See full methodology.
|
Market Scope |
|
|
Report Coverage |
Details |
|
Page number |
210 |
|
Base year |
2024 |
|
Historic period |
2019-2023 |
|
Forecast period |
2025-2029 |
|
Growth momentum & CAGR |
Accelerate at a CAGR of 34.5% |
|
Market growth 2025-2029 |
USD 1057.5 million |
|
Market structure |
Fragmented |
|
YoY growth 2024-2025(%) |
30.4 |
|
Key countries |
US, China, Canada, India, Japan, Germany, South Korea, UK, Brazil, and Mexico |
|
Competitive landscape |
Leading Companies, Market Positioning of Companies, Competitive Strategies, and Industry Risks |
Why Choose Technavio for Automotive Hypervisor Market Insights?
"Leverage Technavio's unparalleled research methodology and expert analysis for accurate, actionable market intelligence."
The market is experiencing significant growth as automakers and technology companies seek to enhance the performance and security of in-vehicle systems. Hypervisors, a critical component of automotive virtualization, play a pivotal role in managing the execution of multiple operating systems and applications within a single vehicle. Hypervisor performance is crucial in automotive applications, as real-time constraints demand efficient resource allocation and low latency. The automotive hypervisor design process includes stringent security certification to ensure the safety and reliability of virtualized systems. Virtual machine migration in automotive environments can optimize system resource utilization, but it requires careful consideration of the impact on power consumption and latency. ECU virtualization, a key application of automotive hypervisors, enables improved system resource allocation and more efficient use of hardware. Hypervisor-based functional safety systems offer enhanced security and isolation, ensuring the integrity of critical automotive applications.
Secure boot implementation and memory protection mechanisms are essential features of automotive hypervisors, safeguarding against unauthorized access and data breaches. System monitoring tools and latency optimization strategies are essential for managing the complex networks and real-time requirements of automotive hypervisors. Over-the-air update mechanisms enable seamless software updates, reducing the need for costly in-dealership visits. Power consumption reduction techniques are also a priority, as hypervisors contribute to the overall energy usage of modern vehicles. Hardware-assisted virtualization offers benefits in automotive applications, including improved performance and more efficient resource utilization. Real-time scheduling algorithms and in-vehicle network virtualization present challenges for automotive hypervisor solutions, requiring advanced technology and expertise. ISO 26262 compliance is essential for automotive hypervisor providers, ensuring the functional safety and reliability of their products. Advanced driver assistance systems (ADAS) and sensor data fusion are increasingly being virtualized on automotive hypervisor platforms, enabling more sophisticated functionality and improved safety features. Virtual machine management and application isolation mechanisms are essential features of automotive hypervisors, ensuring the efficient and secure execution of multiple applications within a vehicle.
What are the Key Data Covered in this Automotive Hypervisor Market Research and Growth Report?
-
What is the expected growth of the Automotive Hypervisor Market between 2025 and 2029?
-
USD 1.06 billion, at a CAGR of 34.5%
-
-
What segmentation does the market report cover?
-
The report is segmented by Vehicle Type (Passenger cars, LCV, and HCV), Type (Autonomous vehicle and Semi-autonomous vehicle), Application (Infotainment, ADAS, Telematics, Powertrain, and Others), and Geography (North America, APAC, Europe, South America, and Middle East and Africa)
-
-
Which regions are analyzed in the report?
-
North America, APAC, Europe, South America, and Middle East and Africa
-
-
What are the key growth drivers and market challenges?
-
Increasing complexity of automotive software, High development and integration costs of advanced hypervisor solutions
-
-
Who are the major players in the Automotive Hypervisor Market?
-
BlackBerry Ltd., Elektrobit Automotive GmbH, Green Hills Software LLC, Infineon Technologies AG, International Business Machines Corp., Lynx Software Technologies, NXP Semiconductors NV, Panasonic Holdings Corp., Qualcomm Inc., Renesas Electronics Corp., Robert Bosch GmbH, Samsung Electronics Co. Ltd., Sasken Technologies Ltd., Siemens AG, Synopsys Inc., Tata Elxsi Ltd., TTTech Auto, Visteon Corp., VMware Inc., and Wind River Systems Inc.
-
We can help! Our analysts can customize this automotive hypervisor market research report to meet your requirements.
 RIA -
RIA - 
