
Automotive MLCCs Market Size 2024-2028
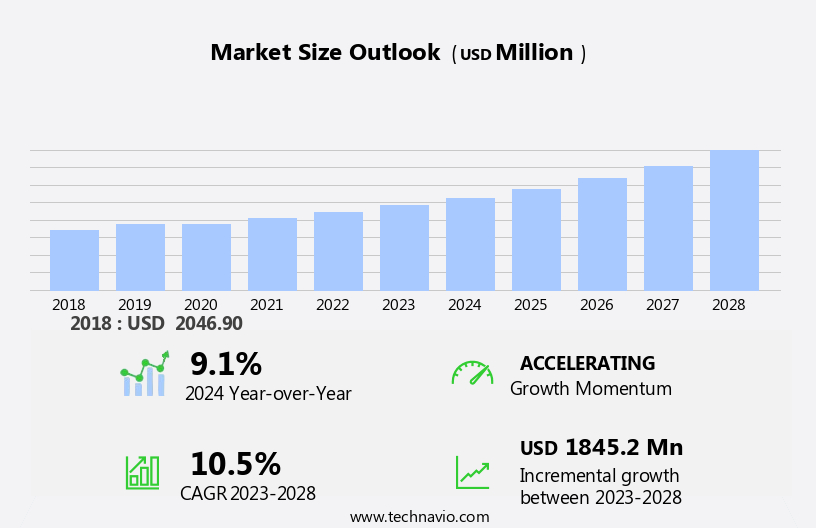
The automotive MLCCs market size is forecast to increase by USD 1.85 billion at a CAGR of 10.5% between 2023 and 2028. The automotive market witnessed significant growth in the adoption of MLCCs (Multilayer Ceramic Capacitors) due to the increasing demand for advanced technologies in vehicles. MLCCs find extensive applications in engines and powertrains, including hybrid electric vehicles (HEVs) and plug-in hybrid electric vehicles (PHEVs), to enhance fuel efficiency and improve power delivery. The market is experiencing significant growth due to the increasing adoption of electric vehicles (EVs) globally, leading to a rise in demand for high-reliability electronics and energy storage solutions. Additionally, MLCCs are crucial components in infotainment systems, self-driving cars, Advanced Driver Assistance Systems (ADAS), and subsystem electronics, such as control circuits and plastic film capacitors. The market's growth is driven by the global shift towards electric vehicles and the continuous introduction of new MLCC products by companies to cater to the evolving automotive industry requirements.
What will be the Size of the Market During the Forecast Period?
Multi-layer ceramic capacitors (MLCCs) have become essential components in the automotive sector due to their unique properties and versatility. These electronic components play a significant role in power distribution, noise suppression, signal conditioning, and voltage regulation in various automotive applications. MLCCs are compact, making them ideal for use in on-board electrical circuits of electric vehicles (EVs) and battery electric vehicles (BEVs). Their energy-efficient designs enable them to minimize power losses, which is crucial in the automotive industry where energy conservation is a priority. In high voltage applications, such as onboard inverters, AC-DC converters, battery management systems (BMS) circuits, onboard chargers, and EV/BEV powertrains, MLCCs with metallic electrodes and dielectric ceramic materials offer superior performance.
Furthermore, MLCCs are also used in consumer electronics, telecommunications, 5G, IoT, and other industries. However, their application in the automotive sector is particularly noteworthy due to the stringent requirements for reliability, compactness, and energy efficiency. In conclusion, MLCCs have become indispensable components in the automotive industry due to their unique properties and versatility. Their use in power distribution, noise suppression, signal conditioning, and voltage regulation applications, as well as their ability to handle high voltages, makes them essential for the development of advanced automotive technologies, including electric vehicles and battery electric vehicles.
Market Segmentation
The market research report provides comprehensive data (region-wise segment analysis), with forecasts and estimates in "USD billion" for the period 2024-2028, as well as historical data from 2018-2022 for the following segments.
- Type
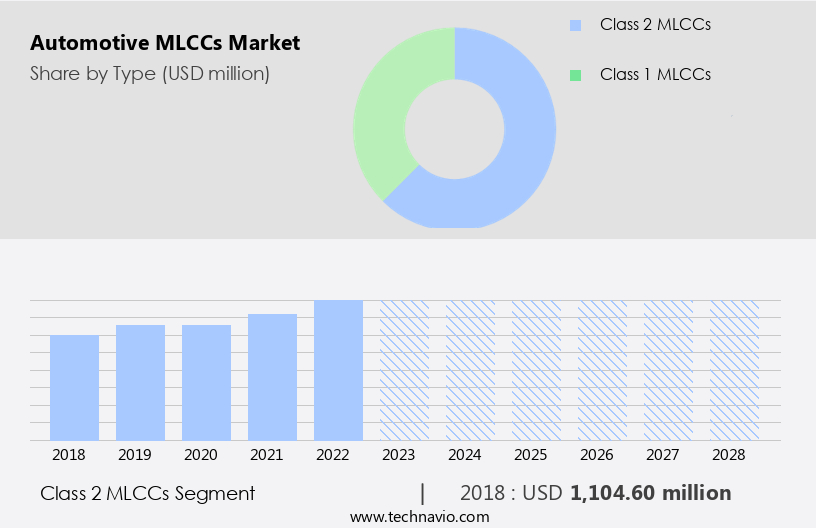
- Class 2 MLCCs
- Class 1 MLCCs
- Application
- Power electronics
- Infotainment systems
- Advanced driver-assistance systems
- Lighting systems
- Others
- Geography
- APAC
- China
- India
- Japan
- South Korea
- Europe
- Germany
- UK
- France
- Italy
- North America
- Canada
- US
- Middle East and Africa
- South America
- APAC
By Type Insights
The class 2 MLCCS segment is estimated to witness significant growth during the forecast period. Class 2 MLCCs (Miniature Ceramic Capacitors) play a vital role in the automotive industry due to their high capacitance density and compact size. These capacitors utilize dielectric materials such as X7R and Y5V, which provide higher capacitance values than Class 1 capacitors. Although these capacitors exhibit greater capacitance variation in response to temperature and voltage changes, they are ideal for applications where space is at a premium and high capacitance is required. Automotive electronic systems, including power management circuits, filtering applications, and Advanced Driver Assistance Systems (ADAS), extensively use Class 2 MLCCs.
Furthermore, Class 2 MLCCs' integration into automotive systems aligns with the growing trend of IoT (Internet of Things) and AI (Artificial Intelligence) in the automotive sector. With the increasing use of electronic control units (ECUs) and cloud integration, the demand for high-reliability electronics and component integration is on the rise. Palladium and nickel-based Class 2 MLCCs offer the necessary reliability and stability for these applications. In summary, Class 2 MLCCs are essential components in the automotive industry due to their compact size, high capacitance density, and temperature stability. Their use in various automotive electronic systems, such as power management circuits, filtering applications, and ADAS, contributes to the growing trend of IoT and AI in the automotive sector.
Get a glance at the market share of various segments Request Free Sample
The class 2 MLCCs segment accounted for USD 1.10 billion in 2018 and showed a gradual increase during the forecast period.
Regional Insights
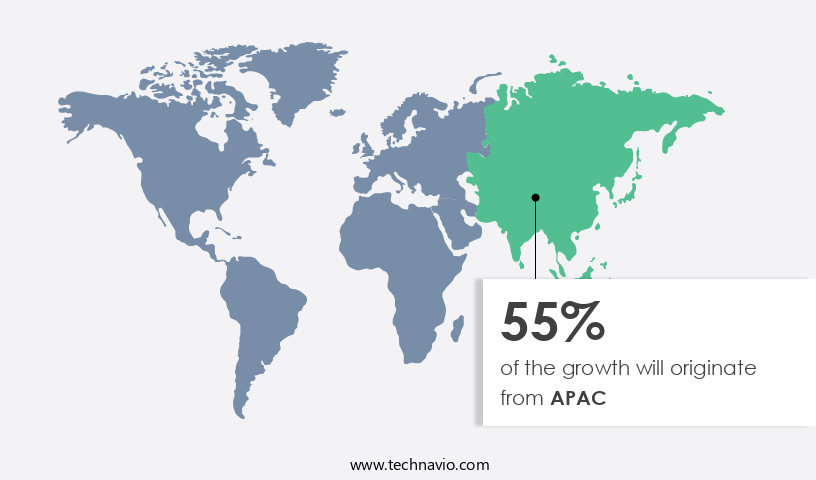
APAC is estimated to contribute 55% to the growth of the global market during the forecast period. Technavio's analysts have elaborately explained the regional trends and drivers that shape the market during the forecast period.
For more insights on the market share of various regions Request Free Sample
The Asia-Pacific (APAC) region leads the global automotive Multi-Layer Ceramic Capacitors (MLCCs) market due to the rise in electric vehicle (EV) sales and advanced manufacturing capabilities. In May 2024, India reported a notable 20.88% increase in EV sales, reaching 1.39 million units. The Indian government aims to boost EV sales, targeting 30% for private cars, 70% for commercial vehicles, 40% for buses, and 80% for two-wheelers and three-wheelers by 2030. This equates to a goal of having 80 million EVs on Indian roads by the end of the decade. The Make in India initiative also encourages complete domestic EV production, further supporting this objective.
Furthermore, automotive MLCCs play a crucial role in various applications, including power distribution, noise suppression, signal conditioning, and voltage regulation. Compact and energy-efficient designs are essential in today's smart mobility solutions, making MLCCs indispensable in the automotive industry. The APAC region's significant growth in EV sales and manufacturing capabilities contribute to the increasing demand for these essential electronic components. In summary, the APAC region, particularly India, is a major player in The market due to the growing EV market and strong manufacturing capabilities. The Indian government's ambitious targets for EV sales, coupled with the Make in India initiative, further strengthen the region's position in the market. The importance of MLCCs in power distribution, noise suppression, signal conditioning, and voltage regulation makes them indispensable in the development of advanced, energy-efficient, and compact automotive solutions.
Our researchers analyzed the data with 2023 as the base year, along with the key drivers, trends, and challenges. A holistic analysis of drivers will help companies refine their marketing strategies to gain a competitive advantage.
Market Driver
Increasing adoption of EVs globally is the key driver of the market. The automotive market for MLCCs (Multilayer Ceramic Capacitors) is experiencing significant growth due to the increasing popularity of electric vehicles (EVs). Automotive MLCCs play a crucial role in various EV components, including battery management systems, onboard chargers, and high voltage electrical circuits. Additionally, the expansion of Hydrogen stations and the development of renewable energy charging infrastructure are further boosting the demand for MLCCs.
Furthermore, publicly accessible charging stations, fast chargers, and on-board electrical circuits all require MLCCs to ensure efficient energy storage and power conversion. In summary, the market is poised for substantial growth due to the increasing adoption of electric vehicles and the expansion of charging infrastructure in the United States. The market's growth is driven by various factors, including the transition to cleaner energy sources, the reduction of greenhouse gas emissions, and the implementation of government policies that support the electrification of transportation.
Market Trends
The introduction of new MLCC products by companies is the upcoming trend in the market. The market is experiencing a notable trend as companies introduce new, compact and high-performance electronic components to meet the rising demand. On September 19, 2024, Murata Manufacturing Co., Ltd., headed by President Norio Nakajima, unveiled the world's smallest MLCC, measuring 0.16 mm x 0.08 mm (006003-inch size). This new MLCC offers a 75% reduction in volume compared to the previous smallest MLCC (0.25 mm x 0.125 mm, 008004-inch size).
Furthermore, this ultra-compact MLCC caters to the increasing need for high-density component mounting solutions, especially in advanced technologies like self-driving cars, ADAS, infotainment systems, and engines and powertrains in hybrid electric vehicles (HEVs) and plug-in hybrid electric vehicles (HEVs). The subsystem electronics in these vehicles rely heavily on capacitor technology, which is integrated into control circuits. With the growing popularity of these advanced vehicle systems, the demand for MLCCs is expected to rise.
Market Challenge
Rising competition from alternative technologies is a key challenge affecting the market growth. The market experiences intense competition from alternative capacitor technologies, including polymer capacitors, tantalum capacitors, aluminum electrolytic capacitors, and film capacitors. Among these, polymer capacitors have gained significant traction, particularly in automotive applications where dependability and superior performance are crucial. These capacitors provide advantages such as lower equivalent series resistance (ESR) and improved stability, resulting in desirable characteristics like miniaturization, high efficiency, and quicker transient response. Polymer capacitors effectively tackle the challenges posed by conventional MLCCs by offering extended lifespan and reliability.
Furthermore, this makes them an attractive option for various industries, including aerospace, medical, and commercial sectors. With the continuous advancement of electronic devices, there is an escalating demand for capacitors that can support swift operations and maintain minimal voltage fluctuations. In the automotive industry, the integration of onboard inverters, DC converters, BMS circuits, onboard chargers, and battery electric vehicles (BEV) necessitates the use of high-performance capacitors. As the automotive sector moves towards electrification, the importance of MLCCs in power electronics applications becomes increasingly significant. Polymer capacitors, with their superior performance characteristics, are well-positioned to meet the evolving needs of the automotive industry.
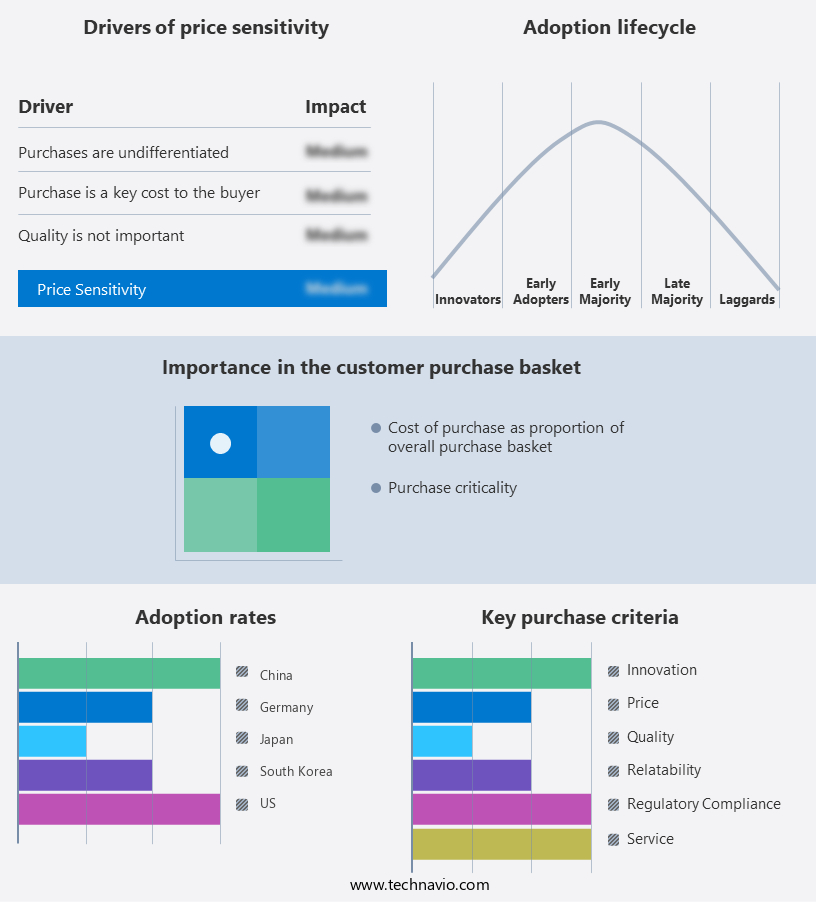
Exclusive Customer Landscape
The market forecasting report includes the adoption lifecycle of the market, covering from the innovator's stage to the laggard's stage. It focuses on adoption rates in different regions based on penetration. Furthermore, the report also includes key purchase criteria and drivers of price sensitivity to help companies evaluate and develop their market growth analysis strategies.
Customer Landscape
Key Companies & Market Insights
Companies are implementing various strategies, such as strategic alliances, partnerships, mergers and acquisitions, geographical expansion, and product/service launches, to enhance their presence in the market.
Bourns Inc. - The company offers automotive MLCC products such as Headlight Range Sensor, ABS Wheel Speed Sensor, Motor Position Sensor for EPAS, Steering Angle Sensor, and Fuel Level Sensor.
The market research and growth report includes detailed analyses of the competitive landscape of the market and information about key companies, including:
- Fenghua HK Electronics Ltd
- HEICO Corp.
- Holy Stone Enterprise Co. Ltd.
- Johanson Dielectrics Inc.
- Knowles Corp.
- KOA Speer Electronics Inc.
- KYOCERA AVX Components Corp.
- MARUWA CO. LTD.
- Murata Manufacturing Co. Ltd.
- NIC COMPONENTS CORP.
- Nippon Chemi-Con Corp.
- Panasonic Holdings Corp.
- Samsung Electro-Mechanics
- Shenzhen Eyang Technology Development Co. Ltd.
- TAIYO YUDEN Co. Ltd.
- TDK Corp.
- Vishay Intertechnology Inc.
- Walsin Technologies Corp.
- Yageo Corp.
Qualitative and quantitative analysis of companies has been conducted to help clients understand the wider business environment as well as the strengths and weaknesses of key market players. Data is qualitatively analyzed to categorize companies as pure play, category-focused, industry-focused, and diversified; it is quantitatively analyzed to categorize companies as dominant, leading, strong, tentative, and weak.
Research Analyst Overview
The automotive industry's reliance on electronic components, particularly multi-layer ceramic capacitors (MLCCs), continues to grow as the sector shifts towards smart mobility solutions, electric vehicles (EVs), and renewable energies. MLCCs play a crucial role in power distribution, noise suppression, signal conditioning, and voltage regulation in various automotive applications. Compact designs and energy-efficient features make MLCCs an ideal choice for electric vehicle battery management systems, onboard chargers, and high voltage inverters. MLCCs are also essential for hydrogen fuel cell electric vehicles (FCEVs) and other renewable energy applications, such as charging infrastructure and publicly accessible fast chargers. MLCCs' high reliability and ability to withstand high voltages make them suitable for onboard electrical circuits, including high voltage MLCCs for onboard inverters, AC-DC converters, and BMS circuits.
Furthermore, the integration of MLCCs in subsystem electronics, such as engine control modules (ECMs) and electronic control units (ECUs), enables advanced driver assistance systems (ADAS), self-driving cars, and IoT connectivity. MLCCs' metallic electrodes and dielectric ceramic properties contribute to their use in various automotive applications, from consumer electronics and infotainment systems to hybrid electric vehicles (HEVs), plug-in hybrid electric vehicles (PHEVs), and battery electric vehicles (BEVs). MLCCs' high temperature resistance and surface-mount compatibility make them suitable for automation and connectivity applications, including 5G integration and autonomous vehicles. Despite the benefits, the automotive MLCC market faces challenges, such as chip shortages and the need for leakage-proof and low equivalent series resistance (ESR) capacitors to improve energy storage efficiency. The future of MLCCs in the automotive industry lies in their ability to meet the demands of advanced automotive electronics and the growing adoption of EVs and renewable energy technologies.
|
Market Scope |
|
|
Report Coverage |
Details |
|
Page number |
214 |
|
Base year |
2023 |
|
Historic period |
2018-2022 |
|
Forecast period |
2024-2028 |
|
Growth momentum & CAGR |
Accelerate at a CAGR of 10.5% |
|
Market growth 2024-2028 |
USD 1.85 billion |
|
Market structure |
Fragmented |
|
YoY growth 2023-2024(%) |
9.1 |
|
Regional analysis |
APAC, Europe, North America, Middle East and Africa, and South America |
|
Performing market contribution |
APAC at 55% |
|
Key countries |
China, US, Japan, Germany, South Korea, France, India, Canada, Italy, and UK |
|
Competitive landscape |
Leading Companies, Market Positioning of Companies, Competitive Strategies, and Industry Risks |
|
Key companies profiled |
Bourns Inc., Fenghua HK Electronics Ltd, HEICO Corp., Holy Stone Enterprise Co. Ltd., Johanson Dielectrics Inc., Knowles Corp., KOA Speer Electronics Inc., KYOCERA AVX Components Corp., MARUWA CO. LTD., Murata Manufacturing Co. Ltd., NIC COMPONENTS CORP., Nippon Chemi-Con Corp., Panasonic Holdings Corp., Samsung Electro-Mechanics, Shenzhen Eyang Technology Development Co. Ltd., TAIYO YUDEN Co. Ltd., TDK Corp., Vishay Intertechnology Inc., Walsin Technologies Corp., and Yageo Corp. |
|
Market dynamics |
Parent market analysis, market growth inducers and obstacles, market forecast, fast-growing and slow-growing segment analysis, COVID-19 impact and recovery analysis and future consumer dynamics, market condition analysis for the forecast period |
|
Customization purview |
If our market report has not included the data that you are looking for, you can reach out to our analysts and get segments customized. |
What are the Key Data Covered in this Market Research and Growth Report?
- CAGR of the market during the forecast period
- Detailed information on factors that will drive the market growth and forecasting between 2024 and 2028
- Precise estimation of the size of the market and its contribution of the market in focus to the parent market
- Accurate predictions about upcoming market growth and trends and changes in consumer behaviour
- Growth of the market across APAC, Europe, North America, Middle East and Africa, and South America
- Thorough analysis of the market's competitive landscape and detailed information about companies
- Comprehensive analysis of factors that will challenge the growth of market companies
We can help! Our analysts can customize this market research report to meet your requirements. Get in touch
 RIA -
RIA - 
