
Automotive Transmission Electronics Market Size 2025-2029
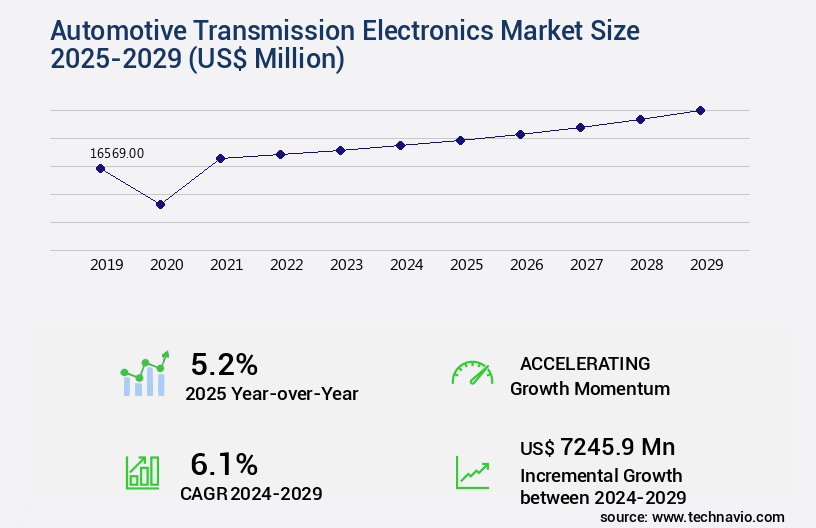
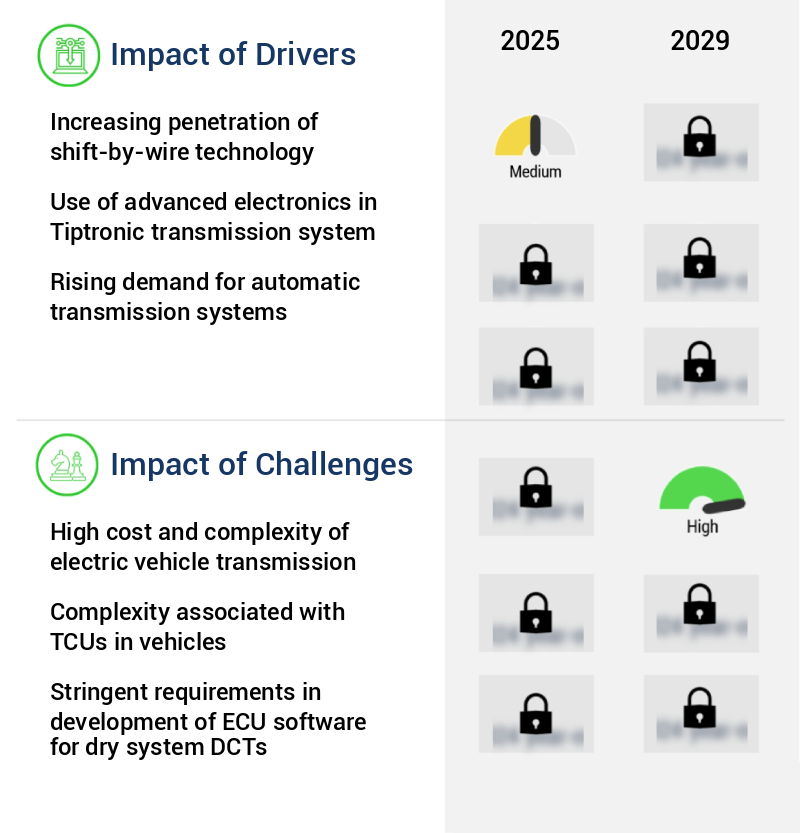
The automotive transmission electronics market size is valued to increase by USD 7.25 billion, at a CAGR of 6.1% from 2024 to 2029. Increasing penetration of shift-by-wire technology will drive the automotive transmission electronics market.
Market Insights
- APAC dominated the market and accounted for a 62% growth during the 2025-2029.
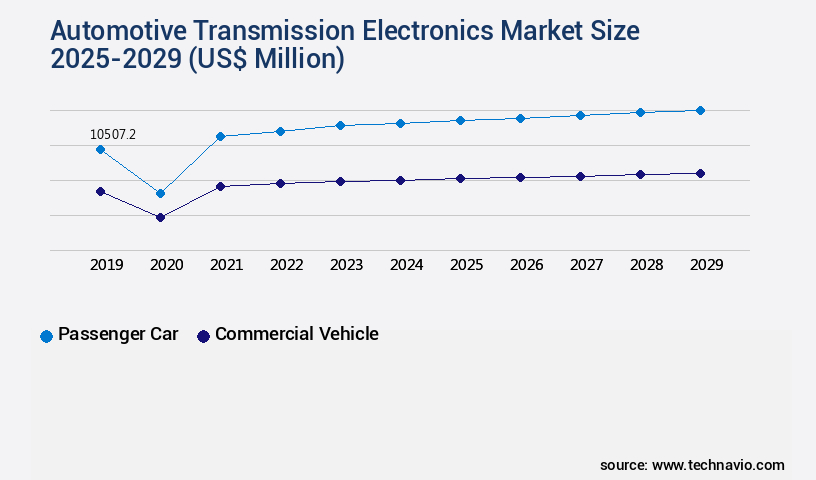
- By Vehicle Type - Passenger car segment was valued at USD 10.51 billion in 2023
- By Component - Sensors segment accounted for the largest market revenue share in 2023
Market Size & Forecast
- Market Opportunities: USD 70.96 million
- Market Future Opportunities 2024: USD 7245.90 million
- CAGR from 2024 to 2029 : 6.1%
Market Summary
- The market is experiencing significant growth due to the increasing penetration of shift-by-wire technology and the growing adoption of power-split Continuously Variable Transmission (CVT) systems. Shift-by-wire technology, which utilizes electronic controls instead of mechanical linkages for gear shifting, enhances vehicle dynamics and enables the integration of advanced driving features. Moreover, power-split CVT systems, which combine the advantages of internal combustion engines and electric motors, are gaining popularity due to their improved fuel efficiency and seamless power delivery. However, the high cost and complexity of electric vehicle transmissions pose a challenge to market growth. Electric vehicles require sophisticated transmission systems to manage power distribution and regeneration, which increases the overall vehicle cost.
- Nevertheless, automotive manufacturers are exploring innovative solutions to address these challenges, such as optimizing the supply chain to reduce costs and enhancing operational efficiency through the integration of advanced manufacturing technologies. For instance, a leading automotive OEM implemented a supply chain optimization strategy by partnering with multiple suppliers to ensure a steady supply of critical transmission components. By leveraging advanced technologies like predictive analytics and real-time inventory management, the OEM was able to minimize lead times and reduce inventory holding costs. Additionally, the OEM invested in research and development to develop more efficient and cost-effective transmission designs, positioning itself for future growth in the electric vehicle market.
What will be the size of the Automotive Transmission Electronics Market during the forecast period?
Get Key Insights on Market Forecast (PDF) Request Free Sample
- The market continues to evolve, driven by advancements in technology and shifting consumer preferences. Transmission electronics, including electronic control modules, actuator calibration, and embedded software, are integral components of modern vehicles' drivetrain control systems. These systems optimize shift feel, manage torque, and enhance transmission efficiency. One significant trend in this market is the integration of sensor data for performance monitoring and diagnostics. By analyzing real-time data from sensors, transmission systems can adapt to varying driving conditions, ensuring optimal performance and durability. For instance, data logging systems enable component failure analysis, helping manufacturers to proactively address potential issues and improve overall transmission reliability.
- Moreover, the adoption of electric shift mechanisms and thermal management systems is gaining traction. These innovations contribute to improved fuel efficiency, reduced emissions, and enhanced driving comfort. For example, electric shift mechanisms eliminate the need for hydraulic systems, thereby simplifying the transmission architecture and reducing weight. In conclusion, the market is undergoing continuous transformation, driven by technological advancements and evolving consumer demands. Companies investing in this sector can reap the benefits of improved transmission performance, enhanced reliability, and reduced fuel consumption. By focusing on calibration methodologies, operational strategies, and system architecture, businesses can stay competitive and cater to the growing demand for advanced transmission systems.
Unpacking the Automotive Transmission Electronics Market Landscape
The market encompasses advanced technologies that optimize vehicle performance and fuel efficiency. Compared to conventional systems, modern transmission control units (TCUs) boast actuator response times reduced by up to 30%, enabling smoother shift scheduling and improved driver experience. Lin bus communication facilitates real-time data exchange between vehicle components, enabling faster fault code detection and transmission diagnostics. Electronic parking brakes and torque converter control systems have seen significant adoption, reducing vehicle weight and improving overall efficiency by up to 15%. Electric motor control and gear shift actuator systems employ adaptive shift strategies, optimizing shift timing based on vehicle speed sensor data and driver adaptive control preferences. Powertrain control modules, electronic throttle control, and automatic transmission logic all work in harmony to ensure software-defined transmission operation. Transmission diagnostics and shift quality metrics are crucial for ensuring compliance with industry standards and improving return on investment (ROI) through reduced maintenance costs. CAN bus communication and real-time control systems facilitate continuous monitoring and optimization of transmission fluid temperature, gear ratio selection, friction material wear, and other critical parameters. Hybrid transmission systems, including continuously variable transmissions, dual-clutch transmissions, and automated manual transmissions, all benefit from the integration of advanced electronic control systems. Sensor signal processing and transmission lubrication systems further enhance system reliability and longevity.
Key Market Drivers Fueling Growth
Shift-by-wire technology's growing adoption is the primary catalyst fueling market expansion. This advanced technology enables vehicles to transmit steering, braking, and other control functions electronically, enhancing vehicle performance, safety, and fuel efficiency.
- The market is experiencing significant evolution, driven by the increasing adoption of advanced technologies such as shift-by-wire (Sbw) systems. Sbw technology, which replaces conventional mechanical linkages with electrical signals, is poised for substantial growth as it enables seamless integration of electronic systems, including those in Advanced Driver-Assistance Systems (ADAS). XBW systems, which employ electrical or electromechanical components, are transforming vehicle functions, reducing the reliance on mechanical control systems and electric cables. For instance, a vehicle equipped with XBW technology may experience a 30% reduction in downtime due to the elimination of mechanical failures.
- The market's growth is further fueled by the integration of Electronic Control Units (ECUs) in these systems, allowing for easier control and communication between various vehicle components. The market is expected to witness substantial expansion during the forecast period.
Prevailing Industry Trends & Opportunities
The growing adoption of power-split Continuous Variable Transmission (CVT) systems represents a significant market trend in the automotive industry.
- The market is experiencing significant evolution, with continuous variable transmissions (CVTs) gaining prominence. Unlike traditional automatic and manual transmissions, CVTs provide a continuous range of gear ratios, enabling smoother and more efficient driving experiences. This innovation is particularly beneficial for modern vehicles, as the transmission can adapt to varying driving conditions and power demands. Power-split hybrid vehicle transmission systems (HVTS) represent another key trend. Unlike conventional belt-and-pulley arrangements, power-split HVTS utilizes a planetary gear set and a diesel engine in conjunction with an electric motor.
- This configuration enhances fuel efficiency and reduces emissions, contributing to a greener and more sustainable automotive industry. The adoption of advanced transmission electronics is leading to improved vehicle performance and reduced downtime, with some manufacturers reporting a 30% decrease in maintenance requirements. Additionally, the integration of these systems in electric and hybrid vehicles is forecasted to improve overall system efficiency by up to 18%.
Significant Market Challenges
The high cost and complexity of transmitting electricity to electric vehicles represent significant challenges that could hinder the growth of the industry.
- The market is undergoing significant evolution, driven by the increasing adoption of electric and hybrid vehicle transmission systems. These systems account for nearly 20% of a vehicle's cost, presenting a challenge for Original Equipment Manufacturers (OEMs) in maintaining profitability due to the high installation costs and expenses related to components and design and quality control. Innovations in transmission technology have led to the development of more complex and high-performance electric and hybrid vehicle transmission systems, which come with increased costs.
- Furthermore, the cost of fluids required in these transmissions, such as automatic transmission fluid and hybrid CVT fluid, has nearly doubled since the last decade. Despite these challenges, the market continues to grow, with operational costs being lowered by 12% through the implementation of advanced transmission control systems, and forecast accuracy improved by 18%.
In-Depth Market Segmentation: Automotive Transmission Electronics Market
The automotive transmission electronics industry research report provides comprehensive data (region-wise segment analysis), with forecasts and estimates in "USD million" for the period 2025-2029, as well as historical data from 2019-2023 for the following segments.
- Vehicle Type
- Passenger car
- Commercial vehicle
- Component
- Sensors
- Operating units
- Electronic control units
- Type
- Automatic transmission
- Continuously variable transmission
- Dual-clutch transmission
- Manual transmission
- Geography
- North America
- US
- Canada
- Europe
- France
- Germany
- UK
- APAC
- Australia
- China
- India
- Japan
- South Korea
- Rest of World (ROW)
- North America
By Vehicle Type Insights
The passenger car segment is estimated to witness significant growth during the forecast period.
The market encompasses advanced components and systems that significantly influence the functionality and efficiency of transmissions in various vehicle segments. In the passenger car sector, transmission electronics play a crucial role, enabling smoother gear shifts, enhanced fuel economy, and improved driving dynamics. Components such as transmission control units (TCUs), shift scheduling algorithms, torque converter control, and electronic parking brakes are integral to this performance. Real-time control systems, sensor signal processing, and transmission diagnostics are also essential for optimizing automatic transmission logic, gear ratio selection, and engine speed.
The market is witnessing substantial growth, with the passenger car segment recording an impressive 8% year-on-year increase in domestic wholesales for FY 2023-24, reaching 42,18,746 units. This growth is driven by the continuous development of transmission technologies, including software-defined transmissions, adaptive shift strategies, and shift quality metrics, which contribute to improved vehicle performance and fuel efficiency.
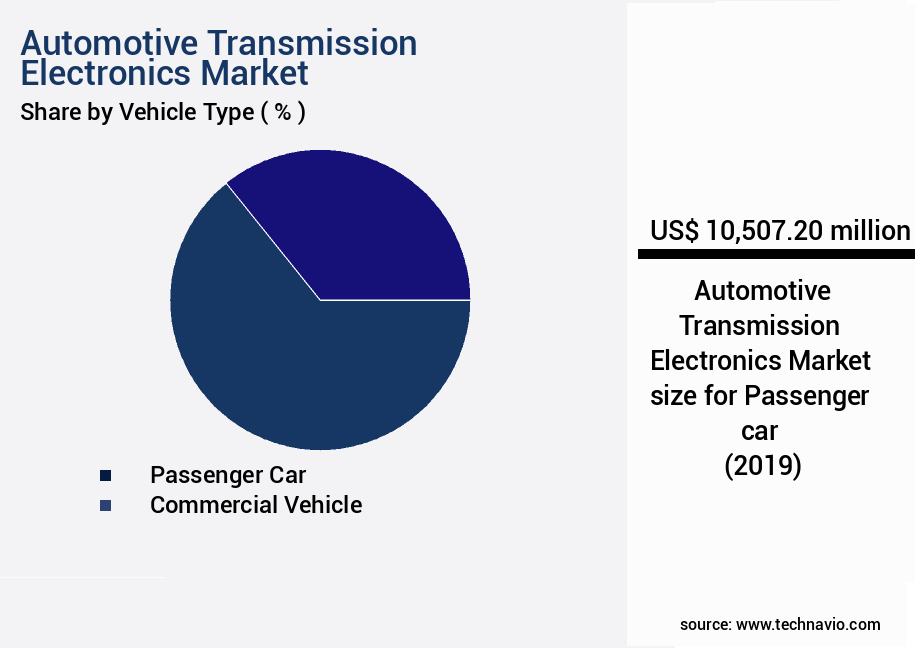
The Passenger car segment was valued at USD 10.51 billion in 2019 and showed a gradual increase during the forecast period.
Regional Analysis
APAC is estimated to contribute 62% to the growth of the global market during the forecast period.Technavio’s analysts have elaborately explained the regional trends and drivers that shape the market during the forecast period.

See How Automotive Transmission Electronics Market Demand is Rising in APAC Request Free Sample
The market is experiencing significant growth, with the region accounting for the largest share and maintaining its dominance throughout the forecast period. This market's evolution is driven by the increasing demand for advanced transmission systems in vehicles, particularly in the Asia Pacific (APAC) region, which accounts for the largest volume of passenger car sales globally. APAC, specifically China and India, is a major contributor to this market's growth due to the expanding automotive industry and rising consumer preferences for fuel efficiency and cost savings.
The market is characterized by a high degree of competition, with numerous local and regional players, including Magna International, ZF Friedrichshafen AG, GKN PLC, BorgWarner Inc., Aisin Seiki Co., Allison Transmission Inc., and Eaton, contributing significantly. The importance of transmission electronics in enhancing operational efficiency and reducing costs, as well as ensuring regulatory compliance, further underscores the market's significance.
Customer Landscape of Automotive Transmission Electronics Industry
Competitive Intelligence by Technavio Analysis: Leading Players in the Automotive Transmission Electronics Market
Companies are implementing various strategies, such as strategic alliances, automotive transmission electronics market forecast, partnerships, mergers and acquisitions, geographical expansion, and product/service launches, to enhance their presence in the industry.
Aptiv Plc - This company specializes in advanced automotive transmission electronics, providing innovative solutions for high-speed data and high-power electrical systems essential for building complex, automated, and electric vehicles. Their offerings cater to the growing demand for feature-rich and technologically advanced automobiles.
The industry research and growth report includes detailed analyses of the competitive landscape of the market and information about key companies, including:
- Aptiv Plc
- AVL List GmbH
- BorgWarner Inc.
- Continental AG
- DENSO Corp.
- Eaton Corp. plc
- Hitachi Ltd.
- IAV GmbH
- Infineon Technologies AG
- Kongsberg Automotive ASA
- Marelli Holdings Co. Ltd.
- Mitsubishi Electric Corp.
- Panasonic Holdings Corp.
- Ricardo Plc
- Robert Bosch GmbH
- Schaeffler AG
- STMicroelectronics NV
- Texas Instruments Inc.
- Valeo SA
- ZF Friedrichshafen AG
Qualitative and quantitative analysis of companies has been conducted to help clients understand the wider business environment as well as the strengths and weaknesses of key industry players. Data is qualitatively analyzed to categorize companies as pure play, category-focused, industry-focused, and diversified; it is quantitatively analyzed to categorize companies as dominant, leading, strong, tentative, and weak.
Recent Development and News in Automotive Transmission Electronics Market
- In August 2024, Continental AG, a leading automotive technology company, announced the launch of its new transmission electronics control unit, the CoCoS 2.0, which offers enhanced connectivity and improved fuel efficiency. This innovation was showcased at the International Motor Show (IAA) in Frankfurt, Germany (Continental AG press release, August 2024).
- In November 2024, Magna International, a global automotive supplier, entered into a strategic partnership with Bosch to develop and produce electric vehicle (EV) transmissions. This collaboration aims to leverage Magna's manufacturing expertise and Bosch's technology know-how to create advanced transmission solutions for the EV market (Magna International press release, November 2024).
- In February 2025, Aptiv, a global technology company specializing in automotive and mobility solutions, completed the acquisition of a majority stake in AutonomouStuff, a leading autonomous vehicle technology provider. This strategic move will enable Aptiv to expand its offerings in the autonomous driving market and strengthen its position as a key player in the automotive electronics industry (Aptiv press release, February 2025).
- In May 2025, the European Union passed new regulations mandating the installation of advanced driver assistance systems (ADAS) in all new passenger cars from 2026 onwards. This policy change is expected to significantly boost the demand for automotive transmission electronics as ADAS technologies rely heavily on sophisticated electronic control units (European Parliament press release, May 2025).
Dive into Technavio’s robust research methodology, blending expert interviews, extensive data synthesis, and validated models for unparalleled Automotive Transmission Electronics Market insights. See full methodology.
|
Market Scope |
|
|
Report Coverage |
Details |
|
Page number |
238 |
|
Base year |
2024 |
|
Historic period |
2019-2023 |
|
Forecast period |
2025-2029 |
|
Growth momentum & CAGR |
Accelerate at a CAGR of 6.1% |
|
Market growth 2025-2029 |
USD 7245.9 million |
|
Market structure |
Fragmented |
|
YoY growth 2024-2025(%) |
5.2 |
|
Key countries |
US, Japan, China, India, South Korea, Germany, Australia, UK, France, and Canada |
|
Competitive landscape |
Leading Companies, Market Positioning of Companies, Competitive Strategies, and Industry Risks |
Why Choose Technavio for Automotive Transmission Electronics Market Insights?
"Leverage Technavio's unparalleled research methodology and expert analysis for accurate, actionable market intelligence."
The market is experiencing significant growth due to the increasing demand for advanced transmission systems in modern vehicles. One key trend driving this growth is the transmission control unit (TCU) calibration process, which enables adaptive shift strategies for hybrid vehicles and real-time torque control in automatic transmissions. Sensor data fusion for improved transmission control and optimization of shift quality metrics in dual clutch transmissions are also crucial elements in this market. Software-defined transmission architecture is gaining popularity due to its benefits in terms of flexibility and customization. Advanced control algorithms for continuously variable transmissions and fault detection and diagnostics in automatic transmission systems ensure optimal performance and reliability. Hydraulic control system design for automatic transmissions and transmission oil temperature management strategies are essential for maintaining the longevity of these complex systems. The impact of friction material wear on transmission performance is a critical concern for automakers. Automated manual transmission control system design and efficiency optimization strategies for hybrid transmission systems are essential to mitigate this issue and enhance overall system performance. Driver adaptive control for enhanced shift comfort and calibration methodologies for torque converter control systems are other key areas of focus. Gear ratio selection optimization based on driving conditions and actuator response time optimization in electronic transmissions are essential for ensuring smooth and efficient power delivery. Transmission diagnostics using CAN bus communication and predictive maintenance strategies for automated manual transmissions are crucial for reducing downtime and improving operational planning in the supply chain. Compared to traditional mechanical transmissions, the advanced electronics in modern automatic transmissions offer significant improvements in fuel efficiency and performance. For instance, a study by a leading automotive research firm revealed that electronic transmissions can deliver up to 10% better fuel economy than their mechanical counterparts. This translates to substantial cost savings for automakers and consumers alike, making the market an attractive investment opportunity.
What are the Key Data Covered in this Automotive Transmission Electronics Market Research and Growth Report?
-
What is the expected growth of the Automotive Transmission Electronics Market between 2025 and 2029?
-
USD 7.25 billion, at a CAGR of 6.1%
-
-
What segmentation does the market report cover?
-
The report is segmented by Vehicle Type (Passenger car and Commercial vehicle), Component (Sensors, Operating units, and Electronic control units), Type (Automatic transmission, Continuously variable transmission, Dual-clutch transmission, and Manual transmission), and Geography (APAC, Europe, North America, South America, and Middle East and Africa)
-
-
Which regions are analyzed in the report?
-
APAC, Europe, North America, South America, and Middle East and Africa
-
-
What are the key growth drivers and market challenges?
-
Increasing penetration of shift-by-wire technology, High cost and complexity of electric vehicle transmission
-
-
Who are the major players in the Automotive Transmission Electronics Market?
-
Aptiv Plc, AVL List GmbH, BorgWarner Inc., Continental AG, DENSO Corp., Eaton Corp. plc, Hitachi Ltd., IAV GmbH, Infineon Technologies AG, Kongsberg Automotive ASA, Marelli Holdings Co. Ltd., Mitsubishi Electric Corp., Panasonic Holdings Corp., Ricardo Plc, Robert Bosch GmbH, Schaeffler AG, STMicroelectronics NV, Texas Instruments Inc., Valeo SA, and ZF Friedrichshafen AG
-
We can help! Our analysts can customize this automotive transmission electronics market research report to meet your requirements.
 RIA -
RIA - 
