BCD Power IC Market Analysis, Size, and Forecast 2026-2030: APAC (China, Japan, and South Korea), Europe (Germany, France, and Italy), North America (US, Canada, and Mexico), South America (Brazil and Argentina), Middle East and Africa (UAE, Saudi Arabia, and South Africa), and Rest of World (ROW)

BCD Power IC Market Analysis, Size, and Forecast 2026-2030:
APAC (China, Japan, and South Korea), Europe (Germany, France, and Italy), North America (US, Canada, and Mexico), South America (Brazil and Argentina), Middle East and Africa (UAE, Saudi Arabia, and South Africa), and Rest of World (ROW)

Published: Dec 2025 301 Pages SKU: IRTNTR45049

Market Overview at a Glance

$11.71 B
Market Opportunity
5.1%
CAGR 2025 - 2030
74.1%
APAC Growth
$28.26 B
High-voltage BCD segment 2024

BCD Power IC Market Size 2026-2030

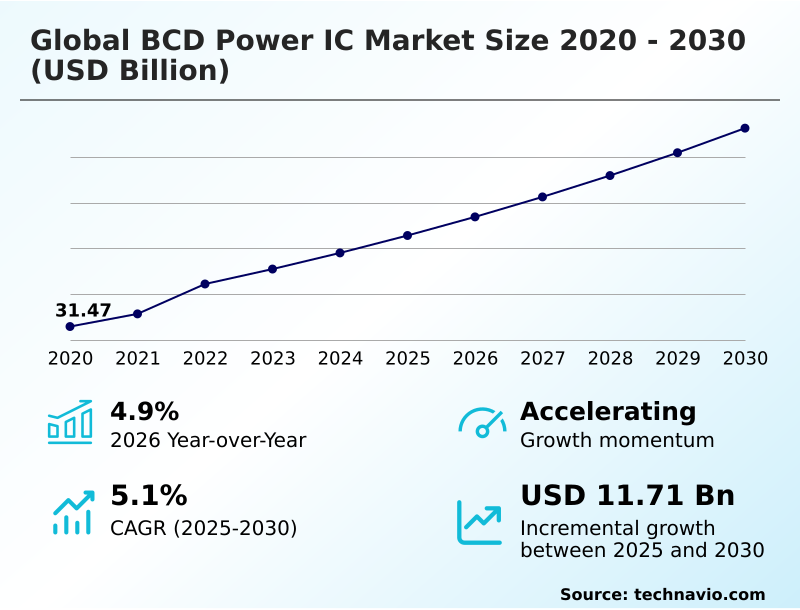
The bcd power ic market size is valued to increase by USD 11.71 billion, at a CAGR of 5.1% from 2025 to 2030. Growth in smart home and smart grid technology will drive the bcd power ic market.

Major Market Trends & Insights

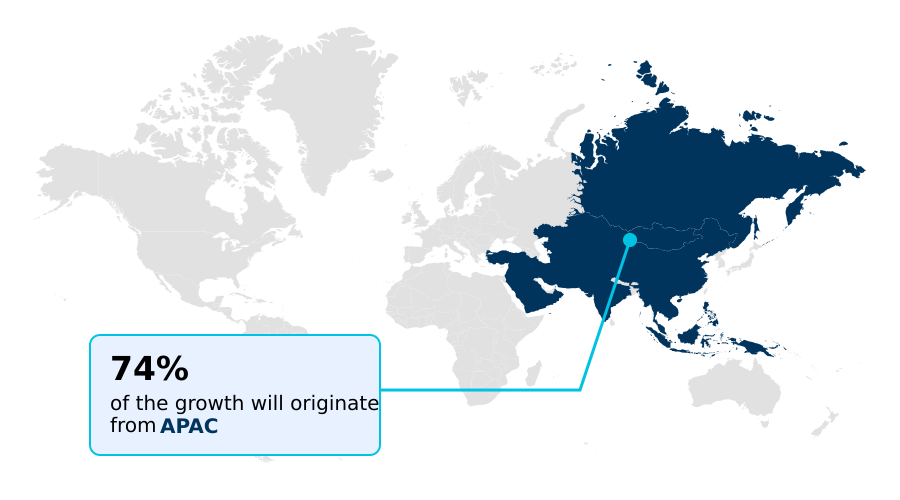
  • APAC dominated the market and accounted for a 74.1% growth during the forecast period.
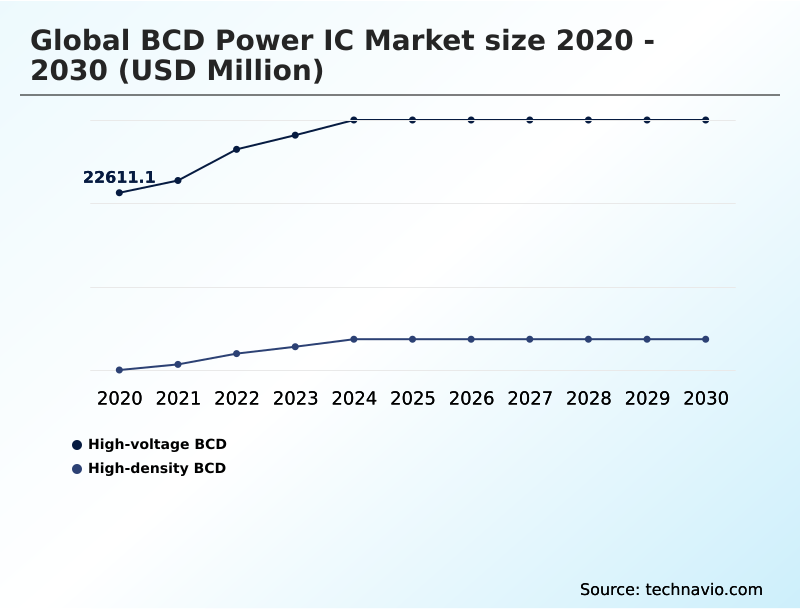
  • By Type - High-voltage BCD segment was valued at USD 28.26 billion in 2024
  • By End-user - ICT segment accounted for the largest market revenue share in 2024

Market Size & Forecast

  • Market Opportunities: USD 21.65 billion
  • Market Future Opportunities: USD 11.71 billion
  • CAGR from 2025 to 2030 : 5.1%

Market Summary

  • The BCD Power IC market is undergoing significant transformation, driven by the global imperatives of electrification and intelligent automation. This specialized semiconductor technology, which uniquely combines bipolar, CMOS, and DMOS structures on a single die, is fundamental to modern power management.
  • Key sectors such as automotive, industrial, and consumer electronics rely on these integrated circuits to deliver higher efficiency, greater power density, and sophisticated control functions within increasingly compact footprints.
  • For instance, in the automotive sector, an OEM can leverage advanced BCD-based gate drivers to optimize the switching performance of traction inverters in electric vehicles, directly enhancing powertrain efficiency and extending battery range. As demand for smart devices and energy-efficient systems intensifies, so does the pressure on manufacturers to innovate.
  • However, this push for higher integration also introduces significant design complexity and thermal management challenges, requiring substantial investment in advanced process technologies and sophisticated design architectures to maintain a competitive edge.

What will be the Size of the BCD Power IC Market during the forecast period?

Get Key Insights on Market Forecast (PDF) Request Free Sample

How is the BCD Power IC Market Segmented?

The bcd power ic industry research report provides comprehensive data (region-wise segment analysis), with forecasts and estimates in "USD million" for the period 2026-2030, as well as historical data from 2020-2024 for the following segments.

  • Type
    • High-voltage BCD
    • High-density BCD
  • End-user
    • ICT
    • Consumer electronics
    • Automotive
    • Manufacturing
    • Others
  • Packaging
    • QFN
    • SOT
    • BGA
    • DIP
  • Geography
    • APAC
      • China
      • Japan
      • South Korea
    • Europe
      • Germany
      • France
      • Italy
    • North America
      • US
      • Canada
      • Mexico
    • South America
      • Brazil
      • Argentina
    • Middle East and Africa
      • UAE
      • Saudi Arabia
      • South Africa
    • Rest of World (ROW)

By Type Insights

The high-voltage bcd segment is estimated to witness significant growth during the forecast period.

The market is segmented by type, end-user, and geography. The high-voltage BCD segment is crucial, driven by automotive electrification and industrial modernization. This technology integrates high-precision analog, digital logic, and robust DMOS power stages on a single chip.

There's a notable shift from 40V and 60V processes toward platforms supporting 100V, 200V, and even the 800V high-voltage platform for EV powertrains and renewable energy.

Manufacturers use silicon-on-insulator substrates for superior electrical isolation and latch-up immunity, which is critical for safety in advanced driver-assistance systems.

Innovations in this space enable enhanced power density and thermal resistance, with some solutions achieving AEC-Q100 compliance while allowing for significant reductions in module footprint.

This evolution in wafer fabrication and process node scaling supports the needs of next-generation software-defined vehicles and onboard chargers.

Request Free Sample

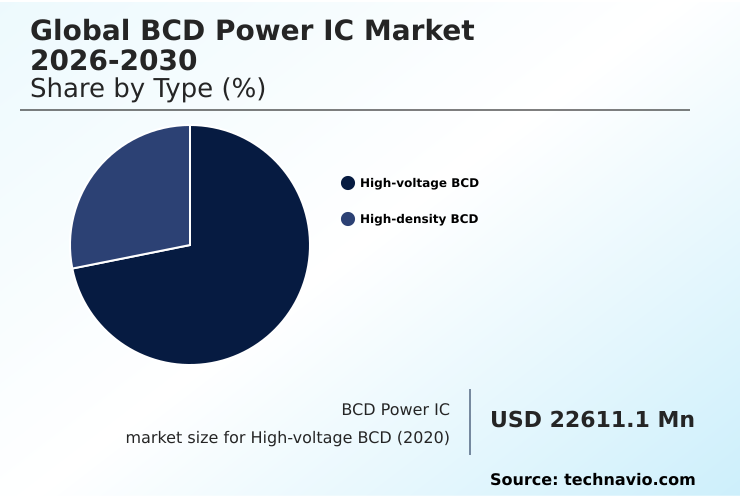
The High-voltage BCD segment was valued at USD 28.26 billion in 2024 and showed a gradual increase during the forecast period.

Request Free Sample

Regional Analysis

APAC is estimated to contribute 74.1% to the growth of the global market during the forecast period.Technavio’s analysts have elaborately explained the regional trends and drivers that shape the market during the forecast period.

See How BCD Power IC Market Demand is Rising in APAC Request Free Sample

The geographic landscape is being reshaped by strategic investments aimed at enhancing supply chain resilience. Major expansions in North America and Europe are complemented by emerging manufacturing hubs in Asia.

These initiatives are primarily focused on 300mm wafer manufacturing for analog and mixed-signal products, which heavily rely on BCD processes.

For example, a new facility with a projected capacity of 50,000 wafers per month is set to produce power management ICs and LDMOS devices.

This localization is critical for supporting the automotive industry's adoption of zone control architectures and advanced battery management systems.

The integration of wide-bandgap semiconductors with BCD-based controllers is another key area of regional focus, aiming to secure the supply of high-efficiency components for renewable energy systems that utilize maximum power point tracking and industrial applications that depend on 4-20mA loop power.

Market Dynamics

Our researchers analyzed the data with 2025 as the base year, along with the key drivers, trends, and challenges. A holistic analysis of drivers will help companies refine their marketing strategies to gain a competitive advantage.

  • The market is navigating a complex technological landscape, defined by the need for enhanced performance across diverse applications. The standard for bcd for automotive grade reliability is rising, driven by the intricate power demands of high voltage bcd for ev powertrains and the sophisticated control required by bcd power ics for zone control architecture.
  • Simultaneously, the consumer electronics sector pushes for higher integration in high density bcd in mobile devices, while the expanding world of connected devices requires ultra low power bcd for iot sensors. A critical area of innovation is the bcd integration with sic and gan, which promises significant gains in efficiency, especially for high frequency switching applications.
  • The general bcd process for smart power applications is being refined to address specific end-markets, from bcd power ics for 5g infrastructure to bcd technology for industrial automation. For high-performance computing, advanced bcd for data center pmics are essential. This specialization forces a continual evaluation of bcd vs discrete components efficiency.
  • Key developmental challenges include bcd power ic design complexity challenges and bcd power ic thermal performance optimization. Addressing these is crucial for applications like bcd power ic for renewable energy inverters and bcd power ic in smart home devices. For niche, high-reliability sectors, radiation hardened bcd for aerospace and specialized bcd power ics for medical implants are being developed.
  • Ultimately, the industry's focus is on improving bcd power ic energy efficiency and advancing bcd technology in battery management systems, where a focus on integrated solutions has led to designs that are over 25% more space-efficient, a crucial factor in supply chain decisions for EV manufacturers.

What are the key market drivers leading to the rise in the adoption of BCD Power IC Industry?

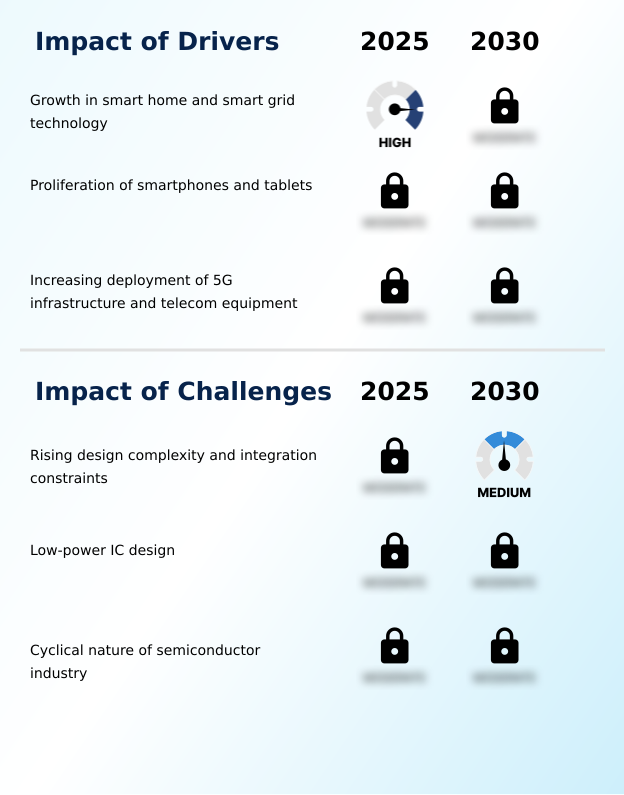
  • The growth in smart home devices and smart grid technology serves as a key driver for the BCD power IC market.

  • Market growth is primarily fueled by the proliferation of data-intensive and connected technologies. The rollout of 5G infrastructure, including 5g base station and massive MIMO antennas, necessitates highly reliable and compact power solutions that only high-density BCD technology can provide.
  • In the computing space, the rise of generative AI workloads has accelerated the adoption of 48V server architecture in hyperscale data centers, creating massive demand for efficient smart power devices and DC-DC converters.
  • These ICs deliver a 20% improvement in power delivery efficiency at the rack level.
  • The widespread use of smartphones and tablets continues to drive innovation in display drivers and gate drivers, with manufacturers focusing on reducing quiescent current to extend battery life.
  • This demand for efficient voltage regulation is also mirrored in the build-out of smart grid infrastructure.

What are the market trends shaping the BCD Power IC Industry?

  • A defining market trend is the intense focus on miniaturization and energy efficiency, driven by the demand for compact, high-performance electronics across multiple sectors.

  • Market trends are centered on achieving higher performance in smaller form factors. The focus on miniaturization and superior power conversion efficiency is driving the adoption of advanced packaging like wafer-level packaging and system-in-package solutions, which can reduce solution size by over 25%.
  • This mixed-signal integration is crucial for the industrial internet of things, where compact motor driver ics are essential for automated systems. The trend of combining bipolar precision with dense cmos logic enables sophisticated system-on-chip architectures. As a result, intelligent power modules are becoming more capable, with new designs improving thermal performance by 15% in high-density applications.
  • This evolution supports the expansion of technologies like usb-c power delivery and energy harvesting, where compact and efficient power management is a key differentiator.

What challenges does the BCD Power IC Industry face during its growth?

  • Rising design complexity and associated integration constraints present a key challenge affecting the industry's growth trajectory.

  • Key market challenges stem from increasing integration complexity and stringent performance requirements. The need to combine high-voltage and low-voltage circuits on a single monolithic die creates significant hurdles in thermal management and reliability, often extending design cycles by up to 20%.
  • As manufacturers push for lower on-resistance, they face trade-offs that can compromise device stability, a critical concern for power management ICs designed for ISO 26262 compliance. The cyclical nature of the industry also adds pressure, as seen when oversupply leads to a 10-15% drop in average selling prices, impacting investment in next-gen solutions like advanced multiphase controllers and e-fuses.
  • Packaging innovations, while beneficial, introduce new manufacturing challenges, as the industry balances the benefits of air-cavity QFN designs with the established reliability of through-hole mounting and surface-mount technology.

Exclusive Technavio Analysis on Customer Landscape

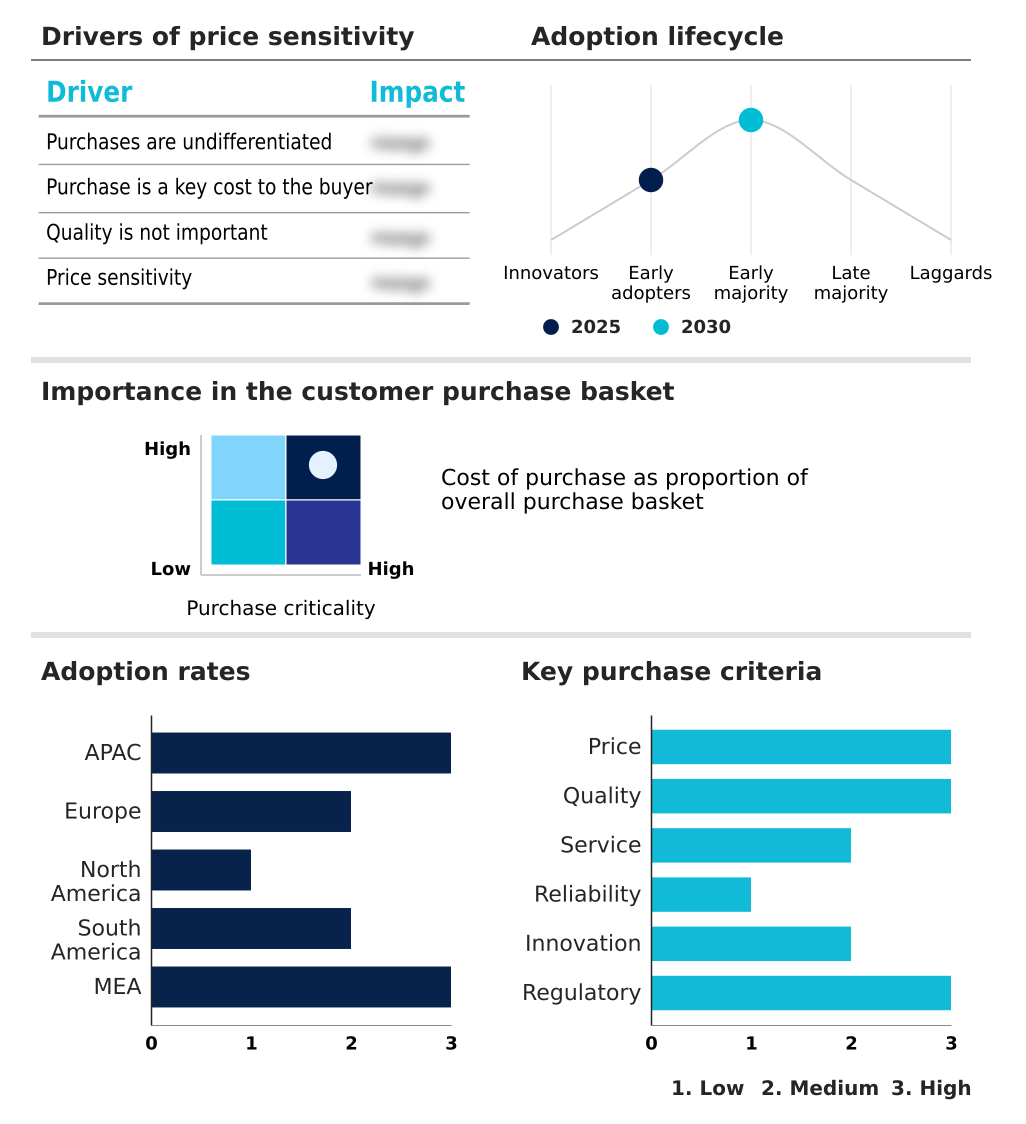
The bcd power ic market forecasting report includes the adoption lifecycle of the market, covering from the innovator’s stage to the laggard’s stage. It focuses on adoption rates in different regions based on penetration. Furthermore, the bcd power ic market report also includes key purchase criteria and drivers of price sensitivity to help companies evaluate and develop their market growth analysis strategies.

Customer Landscape of BCD Power IC Industry

Competitive Landscape

Companies are implementing various strategies, such as strategic alliances, bcd power ic market forecast, partnerships, mergers and acquisitions, geographical expansion, and product/service launches, to enhance their presence in the industry.

Analog Devices Inc. - Offerings include advanced BCD Power ICs engineered for precision analog functions and high-voltage power management in industrial, automotive, and consumer electronics applications.

The industry research and growth report includes detailed analyses of the competitive landscape of the market and information about key companies, including:

  • Analog Devices Inc.
  • China Resources Power Co Ltd
  • Diodes Inc.
  • GlobalFoundaries Inc.
  • Hua Hong Semiconductor Ltd.
  • Infineon Technologies AG
  • MagnaChip Semiconductor Corp.
  • NXP Semiconductors NV
  • ON Semiconductor Corp.
  • ROHM Co. Ltd.
  • STMicroelectronics NV
  • Taiwan Semiconductor Co. Ltd.
  • Texas Instruments Inc.
  • Tower Semiconductor Ltd.
  • United Microelectronics Corp.
  • Vishay Intertechnology Inc.

Qualitative and quantitative analysis of companies has been conducted to help clients understand the wider business environment as well as the strengths and weaknesses of key industry players. Data is qualitatively analyzed to categorize companies as pure play, category-focused, industry-focused, and diversified; it is quantitatively analyzed to categorize companies as dominant, leading, strong, tentative, and weak.

Recent Development and News in Bcd power ic market

  • In December 2024, Tower Semiconductor released its new 300mm 65nm BCD power management platform, targeting low-voltage mobile devices and high power density data center applications.
  • In April 2025, Magnachip Semiconductor Corp. announced its strategic decision to discontinue its display business, pivoting to operate as a pure-play power semiconductor provider focusing on its power discrete and IC businesses.
  • In May 2025, Texas Instruments Inc. completed the construction of its first 300mm wafer fabrication plant in Sherman, Texas, as part of a capital expenditure strategy to secure domestic supply for the automotive and industrial sectors.
  • In August 2025, Cirrus Logic and GlobalFoundries expanded their partnership to co-invest in the development of a next-generation BCD process, aiming to produce highly integrated mixed-signal solutions for consumer and automotive markets.

Dive into Technavio’s robust research methodology, blending expert interviews, extensive data synthesis, and validated models for unparalleled BCD Power IC Market insights. See full methodology.

Market Scope
Page number 301
Base year 2025
Historic period 2020-2024
Forecast period 2026-2030
Growth momentum & CAGR Accelerate at a CAGR of 5.1%
Market growth 2026-2030 USD 11712.0 million
Market structure Fragmented
YoY growth 2025-2026(%) 4.9%
Key countries China, Taiwan, Japan, South Korea, India, Indonesia, Germany, France, Italy, UK, The Netherlands, Spain, US, Canada, Mexico, Brazil, Argentina, Chile, UAE, Saudi Arabia, South Africa, Israel and Turkey
Competitive landscape Leading Companies, Market Positioning of Companies, Competitive Strategies, and Industry Risks

Request Free Sample

Research Analyst Overview

  • The BCD Power IC market is defined by its foundational technology, which integrates bipolar precision, CMOS logic, and DMOS power stages on a single monolithic die. This enables the creation of smart power devices, including sophisticated gate drivers and intelligent power modules, essential for modern electronics.
  • Innovations are focused on enhancing power density and power conversion efficiency through advanced process technologies like silicon-on-insulator and next-generation packaging such as system-in-package and wafer-level packaging. The migration to 300mm wafer fabrication represents a critical boardroom-level decision, requiring significant capital investment to achieve economies of scale and meet demand from the automotive and industrial sectors.
  • These sectors increasingly require ICs compliant with AEC-Q100 and ISO 26262 standards for applications like battery management systems, onboard chargers, motor driver ICs, and display drivers. Advanced BCD processes allow for the integration of smart high-side switches and e-fuses, with some designs achieving up to a 30% reduction in board space.
  • The technology is critical for multiphase controllers, point of load converters, and DC-DC converters, where managing on-resistance, quiescent current, and thermal management are paramount for reliable voltage regulation and preventing latch-up immunity issues.
  • High-density BCD variants feature ultra-low on-resistance LDMOS devices, while high-voltage BCD is expanding into radiation-hardened BCD for specialized applications, utilizing precise analog front-end ICs to maintain performance at high switching frequency.

What are the Key Data Covered in this BCD Power IC Market Research and Growth Report?

  • What is the expected growth of the BCD Power IC Market between 2026 and 2030?

    • USD 11.71 billion, at a CAGR of 5.1%

  • What segmentation does the market report cover?

    • The report is segmented by Type (High-voltage BCD, and High-density BCD), End-user (ICT, Consumer electronics, Automotive, Manufacturing, and Others), Packaging (QFN, SOT, BGA, and DIP) and Geography (APAC, Europe, North America, South America, Middle East and Africa)

  • Which regions are analyzed in the report?

    • APAC, Europe, North America, South America and Middle East and Africa

  • What are the key growth drivers and market challenges?

    • Growth in smart home and smart grid technology, Rising design complexity and integration constraints

  • Who are the major players in the BCD Power IC Market?

    • Analog Devices Inc., China Resources Power Co Ltd, Diodes Inc., GlobalFoundaries Inc., Hua Hong Semiconductor Ltd., Infineon Technologies AG, MagnaChip Semiconductor Corp., NXP Semiconductors NV, ON Semiconductor Corp., ROHM Co. Ltd., STMicroelectronics NV, Taiwan Semiconductor Co. Ltd., Texas Instruments Inc., Tower Semiconductor Ltd., United Microelectronics Corp. and Vishay Intertechnology Inc.

Market Research Insights

  • The market is shaped by a move towards highly integrated power solutions that deliver superior efficiency and reliability. The adoption of zone control architectures in automotive design has accelerated the demand for intelligent power distribution, where advanced BCD chips manage power delivery with enhanced diagnostics, improving system safety by over 20%.
  • In the data center space, the shift to 48V server architecture relies on high-density BCD converters to improve power conversion efficiency, with some solutions achieving a 15% reduction in energy loss at the point of load. This push for performance is also seen in the integration of wide-bandgap semiconductors, where BCD-based drivers are essential for control.
  • The evolution toward sophisticated system-on-chip architectures and advanced power delivery networks underscores the market's focus on maximizing performance within stringent thermal and spatial constraints.

We can help! Our analysts can customize this bcd power ic market research report to meet your requirements.

Get in touch

1. Executive Summary

1.1 Market overview

Executive Summary - Chart on Market Overview
Executive Summary - Data Table on Market Overview
Executive Summary - Chart on Global Market Characteristics
Executive Summary - Chart on Market by Geography
Executive Summary - Chart on Market Segmentation by Type
Executive Summary - Chart on Market Segmentation by End-user
Executive Summary - Chart on Market Segmentation by Packaging
Executive Summary - Chart on Incremental Growth
Executive Summary - Data Table on Incremental Growth
Executive Summary - Chart on Company Market Positioning

2. Technavio Analysis

2.1 Analysis of price sensitivity, lifecycle, customer purchase basket, adoption rates, and purchase criteria

2.2 Criticality of inputs and Factors of differentiation

Chart on Overview on criticality of inputs and factors of differentiation

2.3 Factors of disruption

Chart on Overview on factors of disruption

2.4 Impact of drivers and challenges

Chart on Impact of drivers and challenges in 2025 and 2030

3. Market Landscape

3.1 Market ecosystem

Chart on Parent Market
Data Table on - Parent Market

3.2 Market characteristics

Chart on Market characteristics analysis

3.3 Value chain analysis

Chart on Value chain analysis

4. Market Sizing

4.1 Market definition

Data Table on Offerings of companies included in the market definition

4.2 Market segment analysis

Market segments

4.3 Market size 2025

4.4 Market outlook: Forecast for 2025-2030

Chart on Global - Market size and forecast 2025-2030 ($ million)
Data Table on Global - Market size and forecast 2025-2030 ($ million)
Chart on Global Market: Year-over-year growth 2025-2030 (%)
Data Table on Global Market: Year-over-year growth 2025-2030 (%)

5. Historic Market Size

5.1 Global BCD Power IC Market 2020 - 2024

Historic Market Size - Data Table on Global BCD Power IC Market 2020 - 2024 ($ million)

5.2 Type segment analysis 2020 - 2024

Historic Market Size - Type Segment 2020 - 2024 ($ million)

5.3 End-user segment analysis 2020 - 2024

Historic Market Size - End-user Segment 2020 - 2024 ($ million)

5.4 Packaging segment analysis 2020 - 2024

Historic Market Size - Packaging Segment 2020 - 2024 ($ million)

5.5 Geography segment analysis 2020 - 2024

Historic Market Size - Geography Segment 2020 - 2024 ($ million)

5.6 Country segment analysis 2020 - 2024

Historic Market Size - Country Segment 2020 - 2024 ($ million)

6. Qualitative Analysis

6.1 Impact of AI on Global BCD Power IC Market

7. Five Forces Analysis

7.1 Five forces summary

Five forces analysis - Comparison between 2025 and 2030

7.2 Bargaining power of buyers

Bargaining power of buyers - Impact of key factors 2025 and 2030

7.3 Bargaining power of suppliers

Bargaining power of suppliers - Impact of key factors in 2025 and 2030

7.4 Threat of new entrants

Threat of new entrants - Impact of key factors in 2025 and 2030

7.5 Threat of substitutes

Threat of substitutes - Impact of key factors in 2025 and 2030

7.6 Threat of rivalry

Threat of rivalry - Impact of key factors in 2025 and 2030

7.7 Market condition

Chart on Market condition - Five forces 2025 and 2030

8. Market Segmentation by Type

8.1 Market segments

Chart on Type - Market share 2025-2030 (%)
Data Table on Type - Market share 2025-2030 (%)

8.2 Comparison by Type

Chart on Comparison by Type
Data Table on Comparison by Type

8.3 High-voltage BCD - Market size and forecast 2025-2030

Chart on High-voltage BCD - Market size and forecast 2025-2030 ($ million)
Data Table on High-voltage BCD - Market size and forecast 2025-2030 ($ million)
Chart on High-voltage BCD - Year-over-year growth 2025-2030 (%)
Data Table on High-voltage BCD - Year-over-year growth 2025-2030 (%)

8.4 High-density BCD - Market size and forecast 2025-2030

Chart on High-density BCD - Market size and forecast 2025-2030 ($ million)
Data Table on High-density BCD - Market size and forecast 2025-2030 ($ million)
Chart on High-density BCD - Year-over-year growth 2025-2030 (%)
Data Table on High-density BCD - Year-over-year growth 2025-2030 (%)

8.5 Market opportunity by Type

Market opportunity by Type ($ million)
Data Table on Market opportunity by Type ($ million)

9. Market Segmentation by End-user

9.1 Market segments

Chart on End-user - Market share 2025-2030 (%)
Data Table on End-user - Market share 2025-2030 (%)

9.2 Comparison by End-user

Chart on Comparison by End-user
Data Table on Comparison by End-user

9.3 ICT - Market size and forecast 2025-2030

Chart on ICT - Market size and forecast 2025-2030 ($ million)
Data Table on ICT - Market size and forecast 2025-2030 ($ million)
Chart on ICT - Year-over-year growth 2025-2030 (%)
Data Table on ICT - Year-over-year growth 2025-2030 (%)

9.4 Consumer electronics - Market size and forecast 2025-2030

Chart on Consumer electronics - Market size and forecast 2025-2030 ($ million)
Data Table on Consumer electronics - Market size and forecast 2025-2030 ($ million)
Chart on Consumer electronics - Year-over-year growth 2025-2030 (%)
Data Table on Consumer electronics - Year-over-year growth 2025-2030 (%)

9.5 Automotive - Market size and forecast 2025-2030

Chart on Automotive - Market size and forecast 2025-2030 ($ million)
Data Table on Automotive - Market size and forecast 2025-2030 ($ million)
Chart on Automotive - Year-over-year growth 2025-2030 (%)
Data Table on Automotive - Year-over-year growth 2025-2030 (%)

9.6 Manufacturing - Market size and forecast 2025-2030

Chart on Manufacturing - Market size and forecast 2025-2030 ($ million)
Data Table on Manufacturing - Market size and forecast 2025-2030 ($ million)
Chart on Manufacturing - Year-over-year growth 2025-2030 (%)
Data Table on Manufacturing - Year-over-year growth 2025-2030 (%)

9.7 Others - Market size and forecast 2025-2030

Chart on Others - Market size and forecast 2025-2030 ($ million)
Data Table on Others - Market size and forecast 2025-2030 ($ million)
Chart on Others - Year-over-year growth 2025-2030 (%)
Data Table on Others - Year-over-year growth 2025-2030 (%)

9.8 Market opportunity by End-user

Market opportunity by End-user ($ million)
Data Table on Market opportunity by End-user ($ million)

10. Market Segmentation by Packaging

10.1 Market segments

Chart on Packaging - Market share 2025-2030 (%)
Data Table on Packaging - Market share 2025-2030 (%)

10.2 Comparison by Packaging

Chart on Comparison by Packaging
Data Table on Comparison by Packaging

10.3 QFN - Market size and forecast 2025-2030

Chart on QFN - Market size and forecast 2025-2030 ($ million)
Data Table on QFN - Market size and forecast 2025-2030 ($ million)
Chart on QFN - Year-over-year growth 2025-2030 (%)
Data Table on QFN - Year-over-year growth 2025-2030 (%)

10.4 SOT - Market size and forecast 2025-2030

Chart on SOT - Market size and forecast 2025-2030 ($ million)
Data Table on SOT - Market size and forecast 2025-2030 ($ million)
Chart on SOT - Year-over-year growth 2025-2030 (%)
Data Table on SOT - Year-over-year growth 2025-2030 (%)

10.5 BGA - Market size and forecast 2025-2030

Chart on BGA - Market size and forecast 2025-2030 ($ million)
Data Table on BGA - Market size and forecast 2025-2030 ($ million)
Chart on BGA - Year-over-year growth 2025-2030 (%)
Data Table on BGA - Year-over-year growth 2025-2030 (%)

10.6 DIP - Market size and forecast 2025-2030

Chart on DIP - Market size and forecast 2025-2030 ($ million)
Data Table on DIP - Market size and forecast 2025-2030 ($ million)
Chart on DIP - Year-over-year growth 2025-2030 (%)
Data Table on DIP - Year-over-year growth 2025-2030 (%)

10.7 Market opportunity by Packaging

Market opportunity by Packaging ($ million)
Data Table on Market opportunity by Packaging ($ million)

11. Customer Landscape

11.1 Customer landscape overview

Analysis of price sensitivity, lifecycle, customer purchase basket, adoption rates, and purchase criteria

12. Geographic Landscape

12.1 Geographic segmentation

Chart on Market share by geography 2025-2030 (%)
Data Table on Market share by geography 2025-2030 (%)

12.2 Geographic comparison

Chart on Geographic comparison
Data Table on Geographic comparison

12.3 APAC - Market size and forecast 2025-2030

Chart on APAC - Market size and forecast 2025-2030 ($ million)
Data Table on APAC - Market size and forecast 2025-2030 ($ million)
Chart on APAC - Year-over-year growth 2025-2030 (%)
Data Table on APAC - Year-over-year growth 2025-2030 (%)
Chart on Regional Comparison - APAC
Data Table on Regional Comparison - APAC

12.3.1 China - Market size and forecast 2025-2030

Chart on China - Market size and forecast 2025-2030 ($ million)
Data Table on China - Market size and forecast 2025-2030 ($ million)
Chart on China - Year-over-year growth 2025-2030 (%)
Data Table on China - Year-over-year growth 2025-2030 (%)

12.3.2 Taiwan - Market size and forecast 2025-2030

Chart on Taiwan - Market size and forecast 2025-2030 ($ million)
Data Table on Taiwan - Market size and forecast 2025-2030 ($ million)
Chart on Taiwan - Year-over-year growth 2025-2030 (%)
Data Table on Taiwan - Year-over-year growth 2025-2030 (%)

12.3.3 Japan - Market size and forecast 2025-2030

Chart on Japan - Market size and forecast 2025-2030 ($ million)
Data Table on Japan - Market size and forecast 2025-2030 ($ million)
Chart on Japan - Year-over-year growth 2025-2030 (%)
Data Table on Japan - Year-over-year growth 2025-2030 (%)

12.3.4 South Korea - Market size and forecast 2025-2030

Chart on South Korea - Market size and forecast 2025-2030 ($ million)
Data Table on South Korea - Market size and forecast 2025-2030 ($ million)
Chart on South Korea - Year-over-year growth 2025-2030 (%)
Data Table on South Korea - Year-over-year growth 2025-2030 (%)

12.3.5 India - Market size and forecast 2025-2030

Chart on India - Market size and forecast 2025-2030 ($ million)
Data Table on India - Market size and forecast 2025-2030 ($ million)
Chart on India - Year-over-year growth 2025-2030 (%)
Data Table on India - Year-over-year growth 2025-2030 (%)

12.3.6 Indonesia - Market size and forecast 2025-2030

Chart on Indonesia - Market size and forecast 2025-2030 ($ million)
Data Table on Indonesia - Market size and forecast 2025-2030 ($ million)
Chart on Indonesia - Year-over-year growth 2025-2030 (%)
Data Table on Indonesia - Year-over-year growth 2025-2030 (%)

12.4 Europe - Market size and forecast 2025-2030

Chart on Europe - Market size and forecast 2025-2030 ($ million)
Data Table on Europe - Market size and forecast 2025-2030 ($ million)
Chart on Europe - Year-over-year growth 2025-2030 (%)
Data Table on Europe - Year-over-year growth 2025-2030 (%)
Chart on Regional Comparison - Europe
Data Table on Regional Comparison - Europe

12.4.1 Germany - Market size and forecast 2025-2030

Chart on Germany - Market size and forecast 2025-2030 ($ million)
Data Table on Germany - Market size and forecast 2025-2030 ($ million)
Chart on Germany - Year-over-year growth 2025-2030 (%)
Data Table on Germany - Year-over-year growth 2025-2030 (%)

12.4.2 France - Market size and forecast 2025-2030

Chart on France - Market size and forecast 2025-2030 ($ million)
Data Table on France - Market size and forecast 2025-2030 ($ million)
Chart on France - Year-over-year growth 2025-2030 (%)
Data Table on France - Year-over-year growth 2025-2030 (%)

12.4.3 Italy - Market size and forecast 2025-2030

Chart on Italy - Market size and forecast 2025-2030 ($ million)
Data Table on Italy - Market size and forecast 2025-2030 ($ million)
Chart on Italy - Year-over-year growth 2025-2030 (%)
Data Table on Italy - Year-over-year growth 2025-2030 (%)

12.4.4 UK - Market size and forecast 2025-2030

Chart on UK - Market size and forecast 2025-2030 ($ million)
Data Table on UK - Market size and forecast 2025-2030 ($ million)
Chart on UK - Year-over-year growth 2025-2030 (%)
Data Table on UK - Year-over-year growth 2025-2030 (%)

12.4.5 The Netherlands - Market size and forecast 2025-2030

Chart on The Netherlands - Market size and forecast 2025-2030 ($ million)
Data Table on The Netherlands - Market size and forecast 2025-2030 ($ million)
Chart on The Netherlands - Year-over-year growth 2025-2030 (%)
Data Table on The Netherlands - Year-over-year growth 2025-2030 (%)

12.4.6 Spain - Market size and forecast 2025-2030

Chart on Spain - Market size and forecast 2025-2030 ($ million)
Data Table on Spain - Market size and forecast 2025-2030 ($ million)
Chart on Spain - Year-over-year growth 2025-2030 (%)
Data Table on Spain - Year-over-year growth 2025-2030 (%)

12.5 North America - Market size and forecast 2025-2030

Chart on North America - Market size and forecast 2025-2030 ($ million)
Data Table on North America - Market size and forecast 2025-2030 ($ million)
Chart on North America - Year-over-year growth 2025-2030 (%)
Data Table on North America - Year-over-year growth 2025-2030 (%)
Chart on Regional Comparison - North America
Data Table on Regional Comparison - North America

12.5.1 US - Market size and forecast 2025-2030

Chart on US - Market size and forecast 2025-2030 ($ million)
Data Table on US - Market size and forecast 2025-2030 ($ million)
Chart on US - Year-over-year growth 2025-2030 (%)
Data Table on US - Year-over-year growth 2025-2030 (%)

12.5.2 Canada - Market size and forecast 2025-2030

Chart on Canada - Market size and forecast 2025-2030 ($ million)
Data Table on Canada - Market size and forecast 2025-2030 ($ million)
Chart on Canada - Year-over-year growth 2025-2030 (%)
Data Table on Canada - Year-over-year growth 2025-2030 (%)

12.5.3 Mexico - Market size and forecast 2025-2030

Chart on Mexico - Market size and forecast 2025-2030 ($ million)
Data Table on Mexico - Market size and forecast 2025-2030 ($ million)
Chart on Mexico - Year-over-year growth 2025-2030 (%)
Data Table on Mexico - Year-over-year growth 2025-2030 (%)

12.6 South America - Market size and forecast 2025-2030

Chart on South America - Market size and forecast 2025-2030 ($ million)
Data Table on South America - Market size and forecast 2025-2030 ($ million)
Chart on South America - Year-over-year growth 2025-2030 (%)
Data Table on South America - Year-over-year growth 2025-2030 (%)
Chart on Regional Comparison - South America
Data Table on Regional Comparison - South America

12.6.1 Brazil - Market size and forecast 2025-2030

Chart on Brazil - Market size and forecast 2025-2030 ($ million)
Data Table on Brazil - Market size and forecast 2025-2030 ($ million)
Chart on Brazil - Year-over-year growth 2025-2030 (%)
Data Table on Brazil - Year-over-year growth 2025-2030 (%)

12.6.2 Argentina - Market size and forecast 2025-2030

Chart on Argentina - Market size and forecast 2025-2030 ($ million)
Data Table on Argentina - Market size and forecast 2025-2030 ($ million)
Chart on Argentina - Year-over-year growth 2025-2030 (%)
Data Table on Argentina - Year-over-year growth 2025-2030 (%)

12.6.3 Chile - Market size and forecast 2025-2030

Chart on Chile - Market size and forecast 2025-2030 ($ million)
Data Table on Chile - Market size and forecast 2025-2030 ($ million)
Chart on Chile - Year-over-year growth 2025-2030 (%)
Data Table on Chile - Year-over-year growth 2025-2030 (%)

12.7 Middle East and Africa - Market size and forecast 2025-2030

Chart on Middle East and Africa - Market size and forecast 2025-2030 ($ million)
Data Table on Middle East and Africa - Market size and forecast 2025-2030 ($ million)
Chart on Middle East and Africa - Year-over-year growth 2025-2030 (%)
Data Table on Middle East and Africa - Year-over-year growth 2025-2030 (%)
Chart on Regional Comparison - Middle East and Africa
Data Table on Regional Comparison - Middle East and Africa

12.7.1 UAE - Market size and forecast 2025-2030

Chart on UAE - Market size and forecast 2025-2030 ($ million)
Data Table on UAE - Market size and forecast 2025-2030 ($ million)
Chart on UAE - Year-over-year growth 2025-2030 (%)
Data Table on UAE - Year-over-year growth 2025-2030 (%)

12.7.2 Saudi Arabia - Market size and forecast 2025-2030

Chart on Saudi Arabia - Market size and forecast 2025-2030 ($ million)
Data Table on Saudi Arabia - Market size and forecast 2025-2030 ($ million)
Chart on Saudi Arabia - Year-over-year growth 2025-2030 (%)
Data Table on Saudi Arabia - Year-over-year growth 2025-2030 (%)

12.7.3 South Africa - Market size and forecast 2025-2030

Chart on South Africa - Market size and forecast 2025-2030 ($ million)
Data Table on South Africa - Market size and forecast 2025-2030 ($ million)
Chart on South Africa - Year-over-year growth 2025-2030 (%)
Data Table on South Africa - Year-over-year growth 2025-2030 (%)

12.7.4 Israel - Market size and forecast 2025-2030

Chart on Israel - Market size and forecast 2025-2030 ($ million)
Data Table on Israel - Market size and forecast 2025-2030 ($ million)
Chart on Israel - Year-over-year growth 2025-2030 (%)
Data Table on Israel - Year-over-year growth 2025-2030 (%)

12.7.5 Turkey - Market size and forecast 2025-2030

Chart on Turkey - Market size and forecast 2025-2030 ($ million)
Data Table on Turkey - Market size and forecast 2025-2030 ($ million)
Chart on Turkey - Year-over-year growth 2025-2030 (%)
Data Table on Turkey - Year-over-year growth 2025-2030 (%)

12.8 Market opportunity by geography

Market opportunity by geography ($ million)
Data Tables on Market opportunity by geography ($ million)

13. Drivers, Challenges, and Opportunity

13.1 Market drivers

Growth in smart home and smart grid technology
Proliferation of smartphones and tablets
Increasing deployment of 5G infrastructure and telecom equipment

13.2 Market challenges

Rising design complexity and integration constraints
Low-power IC design
Cyclical nature of semiconductor industry

13.3 Impact of drivers and challenges

Impact of drivers and challenges in 2025 and 2030

13.4 Market opportunities

Miniaturization and energy efficiency focus
High-voltage BCD adoption accelerates
Consumer electronics and IoT expansion

14. Competitive Landscape

14.1 Overview

14.2

Overview on criticality of inputs and factors of differentiation

14.3 Landscape disruption

Overview on factors of disruption

14.4 Industry risks

Impact of key risks on business

15. Competitive Analysis

15.1 Companies profiled

Companies covered

15.2 Company ranking index

15.3 Market positioning of companies

Matrix on companies position and classification

15.4 Analog Devices Inc.

Analog Devices Inc. - Overview
Analog Devices Inc. - Business segments
Analog Devices Inc. - Key news
Analog Devices Inc. - Key offerings
Analog Devices Inc. - Segment focus
SWOT

15.5 China Resources Power Co Ltd

China Resources Power Co Ltd - Overview
China Resources Power Co Ltd - Business segments
China Resources Power Co Ltd - Key offerings
China Resources Power Co Ltd - Segment focus
SWOT

15.6 Diodes Inc.

Diodes Inc. - Overview
Diodes Inc. - Product / Service
Diodes Inc. - Key offerings
SWOT

15.7 GlobalFoundaries Inc.

GlobalFoundaries Inc. - Overview
GlobalFoundaries Inc. - Product / Service
GlobalFoundaries Inc. - Key news
GlobalFoundaries Inc. - Key offerings
SWOT

15.8 Hua Hong Semiconductor Ltd.

Hua Hong Semiconductor Ltd. - Overview
Hua Hong Semiconductor Ltd. - Product / Service
Hua Hong Semiconductor Ltd. - Key offerings
SWOT

15.9 MagnaChip Semiconductor Corp.

MagnaChip Semiconductor Corp. - Overview
MagnaChip Semiconductor Corp. - Product / Service
MagnaChip Semiconductor Corp. - Key offerings
SWOT

15.10 NXP Semiconductors NV

NXP Semiconductors NV - Overview
NXP Semiconductors NV - Product / Service
NXP Semiconductors NV - Key offerings
SWOT

15.11 ON Semiconductor Corp.

ON Semiconductor Corp. - Overview
ON Semiconductor Corp. - Business segments
ON Semiconductor Corp. - Key news
ON Semiconductor Corp. - Key offerings
ON Semiconductor Corp. - Segment focus
SWOT

15.12 ROHM Co. Ltd.

ROHM Co. Ltd. - Overview
ROHM Co. Ltd. - Business segments
ROHM Co. Ltd. - Key news
ROHM Co. Ltd. - Key offerings
ROHM Co. Ltd. - Segment focus
SWOT

15.13 STMicroelectronics NV

STMicroelectronics NV - Overview
STMicroelectronics NV - Business segments
STMicroelectronics NV - Key news
STMicroelectronics NV - Key offerings
STMicroelectronics NV - Segment focus
SWOT

15.14 Taiwan Semiconductor Co. Ltd.

Taiwan Semiconductor Co. Ltd. - Overview
Taiwan Semiconductor Co. Ltd. - Product / Service
Taiwan Semiconductor Co. Ltd. - Key news
Taiwan Semiconductor Co. Ltd. - Key offerings
SWOT

15.15 Texas Instruments Inc.

Texas Instruments Inc. - Overview
Texas Instruments Inc. - Business segments
Texas Instruments Inc. - Key offerings
Texas Instruments Inc. - Segment focus
SWOT

15.16 Tower Semiconductor Ltd.

Tower Semiconductor Ltd. - Overview
Tower Semiconductor Ltd. - Product / Service
Tower Semiconductor Ltd. - Key news
Tower Semiconductor Ltd. - Key offerings
SWOT

15.17 United Microelectronics Corp.

United Microelectronics Corp. - Overview
United Microelectronics Corp. - Product / Service
United Microelectronics Corp. - Key offerings
SWOT

15.18 Vishay Intertechnology Inc.

Vishay Intertechnology Inc. - Overview
Vishay Intertechnology Inc. - Product / Service
Vishay Intertechnology Inc. - Key offerings
SWOT

16. Appendix

16.1 Scope of the report

Market definition
Objectives
Notes and caveats

16.2 Inclusions and exclusions checklist

Inclusions checklist
Exclusions checklist

16.3 Currency conversion rates for US$

16.4 Research methodology

16.5 Data procurement

Information sources

16.6 Data validation

16.7 Validation techniques employed for market sizing

16.8 Data synthesis

16.9 360 degree market analysis

16.10 List of abbreviations

Research Methodology

Technavio presents a detailed picture of the market by way of study, synthesis, and summation of data from multiple sources. The analysts have presented the various facets of the market with a particular focus on identifying the key industry influencers. The data thus presented is comprehensive, reliable, and the result of extensive research, both primary and secondary.

INFORMATION SOURCES

Primary sources

  • Manufacturers and suppliers
  • Channel partners
  • Industry experts
  • Strategic decision makers

Secondary sources

  • Industry journals and periodicals
  • Government data
  • Financial reports of key industry players
  • Historical data
  • Press releases

DATA ANALYSIS

Data Synthesis

  • Collation of data
  • Estimation of key figures
  • Analysis of derived insights

Data Validation

  • Triangulation with data models
  • Reference against proprietary databases
  • Corroboration with industry experts

REPORT WRITING

Qualitative

  • Market drivers
  • Market challenges
  • Market trends
  • Five forces analysis

Quantitative

  • Market size and forecast
  • Market segmentation
  • Geographical insights
  • Competitive landscape

Interested in this report?

Get your sample now to see our research methodology and insights!

Download Now

Frequently Asked Questions

BCD Power IC market growth will increase by USD 11712.0 million during 2026-2030 .

The BCD Power IC market is expected to grow at a CAGR of 5.1% during 2026-2030 .

BCD Power IC market is segmented by Type (High-voltage BCD, High-density BCD) End-user (ICT, Consumer electronics, Automotive, Manufacturing, Others) Packaging (QFN, SOT, BGA, DIP)

Analog Devices Inc., China Resources Power Co Ltd, Diodes Inc., GlobalFoundaries Inc., Hua Hong Semiconductor Ltd., Infineon Technologies AG, MagnaChip Semiconductor Corp., NXP Semiconductors NV, ON Semiconductor Corp., ROHM Co. Ltd., STMicroelectronics NV, Taiwan Semiconductor Co. Ltd., Texas Instruments Inc., Tower Semiconductor Ltd., United Microelectronics Corp., Vishay Intertechnology Inc. are a few of the key vendors in the BCD Power IC market.

APAC will register the highest growth rate of 74.1% among the other regions. Therefore, the BCD Power IC market in APAC is expected to garner significant business opportunities for the vendors during the forecast period.

China, Taiwan, Japan, South Korea, India, Indonesia, Germany, France, Italy, UK, The Netherlands, Spain, US, Canada, Mexico, Brazil, Argentina, Chile, UAE, Saudi Arabia, South Africa, Israel, Turkey

  • Growth in smart home and smart grid technology is the driving factor this market.

The BCD Power IC market vendors should focus on grabbing business opportunities from the Type segment as it accounted for the largest market share in the base year.