APAC Beer Market Size 2026-2030
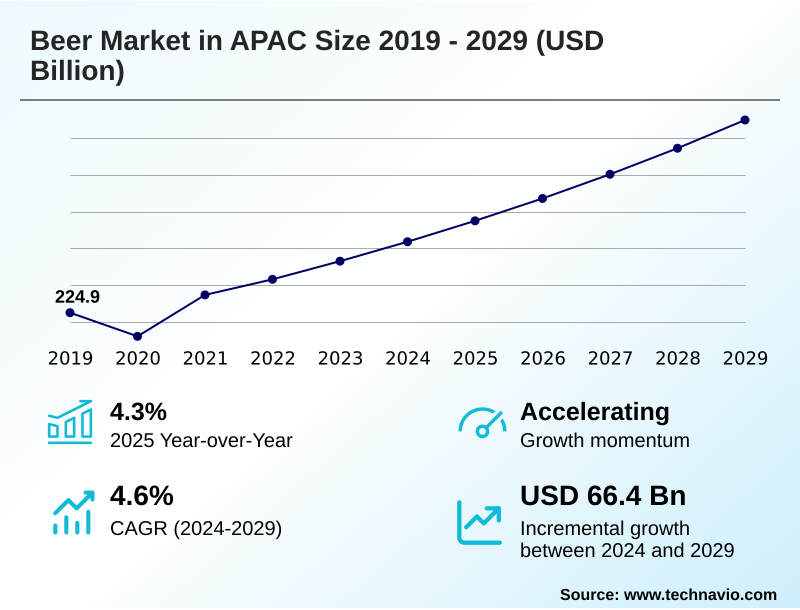
The APAC Beer Market size was valued at USD 275 billion in 2025, growing at a CAGR of 4.9% during the forecast period 2026-2030.
Major Market Trends & Insights
- By Distribution Channel - On-trade segment was valued at USD 172 billion in 2024
- By Packaging - Bottles segment accounted for the largest market revenue share in 2024
Market Size & Forecast
- Historic Market Opportunities 2020-2024: USD 136.5 billion
- Market Future Opportunities 2025-2030: USD 73.5 billion
- CAGR from 2025 to 2030 : 4.9%
Market Summary
- The beer market in APAC demonstrates a clear shift toward premiumization, with craft and imported styles now constituting over 10% of sales in key metropolitan areas, a 4% increase from previous periods. This evolution is primarily driven by rising disposable incomes and the adventurous palates of younger consumers.
- For instance, a typical operational scenario involves brewers leveraging local ingredient sourcing, such as yuzu or jasmine tea, to create differentiated products, which requires adjustments in the brewing process and supply chain. This strategy helps differentiate from competitors.
- However, the industry faces the challenge of navigating stringent advertising restrictions, which can increase marketing costs by up to 20% as companies pivot to digital and experiential campaigns. The constant introduction of new products, including low ABV formulations, keeps the market dynamic, catering to a diverse and evolving consumer base.
What will be the Size of the APAC Beer Market during the forecast period?
Get Key Insights on Market Forecast (PDF) Request Free Sample
How is the APAC Beer Market Segmented?
The apac beer industry research report provides comprehensive data (region-wise segment analysis), with forecasts and analysis for the period 2026-2030, as well as historical data from 2020-2024 for the following segments.
- Distribution channel
- On-trade
- Off-trade
- Packaging
- Bottles
- Cans
- Product
- Lager
- Ale
- Pilsner
- Others
- Geography
- APAC
- China
- Japan
- India
- APAC
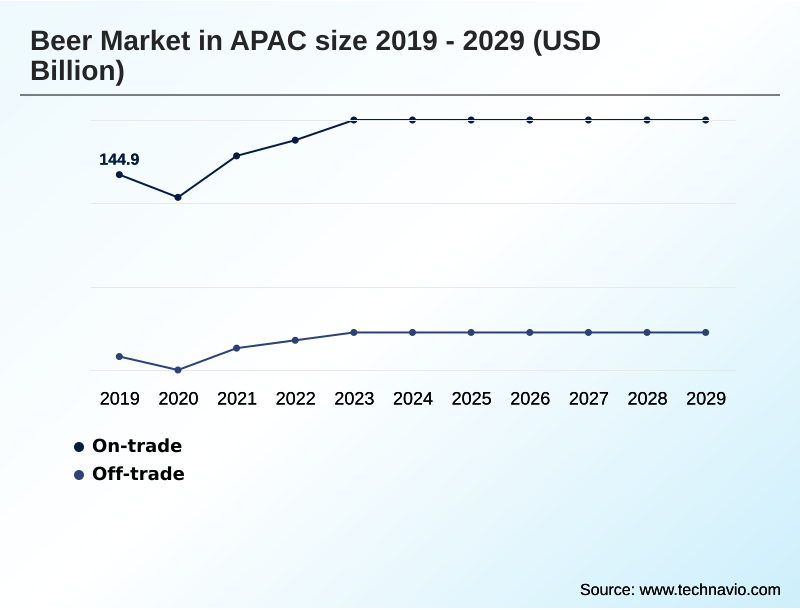
How is the APAC Beer Market Segmented by Distribution Channel?
The on-trade segment is estimated to witness significant growth during the forecast period.
The on-trade channel, which accounts for over 65% of revenue in the beer market in APAC, is defined by consumption in establishments like bars and restaurants where social drinking culture drives demand.
This segment is experiencing a significant shift, with premium and craft offerings growing 15% faster than standard lagers. The focus on draught beer systems and curated menus enhances the consumer experience, supporting higher price points.
Operational success in this channel hinges on effective cold chain logistics and brand storytelling to build consumer loyalty.
Success in this segment requires a focus on lager brewing, ale fermentation, and maintaining specific carbonation levels to meet the quality expectations that justify a 20% price premium over off-trade equivalents.
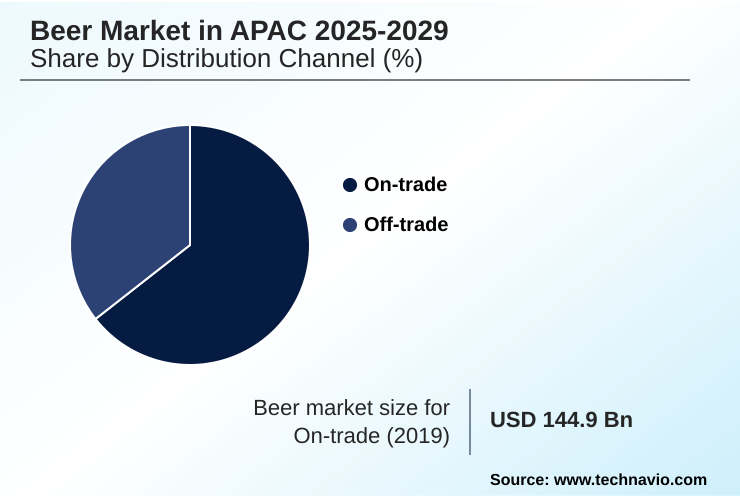
The On-trade segment was valued at USD 172 billion in 2024 and showed a gradual increase during the forecast period.
What are the key Drivers, Trends, and Challenges in the APAC Beer Market?
Our researchers analyzed the data with 2025 as the base year, along with the key drivers, trends, and challenges. A holistic analysis of drivers will help companies refine their marketing strategies to gain a competitive advantage.
- Understanding the nuances of the beer market in APAC requires a deep dive into its multifaceted dynamics. Strategic planning must account for the impact of premiumization on APAC beer market, as consumers increasingly favor quality over quantity.
- This shift is closely tied to the growth of craft beer in emerging economies, where local breweries are gaining traction by offering unique flavor profiles. Consequently, an analysis of low alcohol beer market trends and analysis reveals a significant opportunity to cater to health-conscious demographics, a segment that has grown by over 15% in recent years.
- Success also hinges on an effective beer distribution channel strategy in APAC, balancing the reach of modern retail with the social importance of on-trade venues. Furthermore, a detailed examination of consumer preferences for canned vs bottled beer is crucial for optimizing packaging and logistics, as cans often offer a 10% cost advantage in shipping and handling.
- Navigating these complexities is key to capturing share in this diverse region.
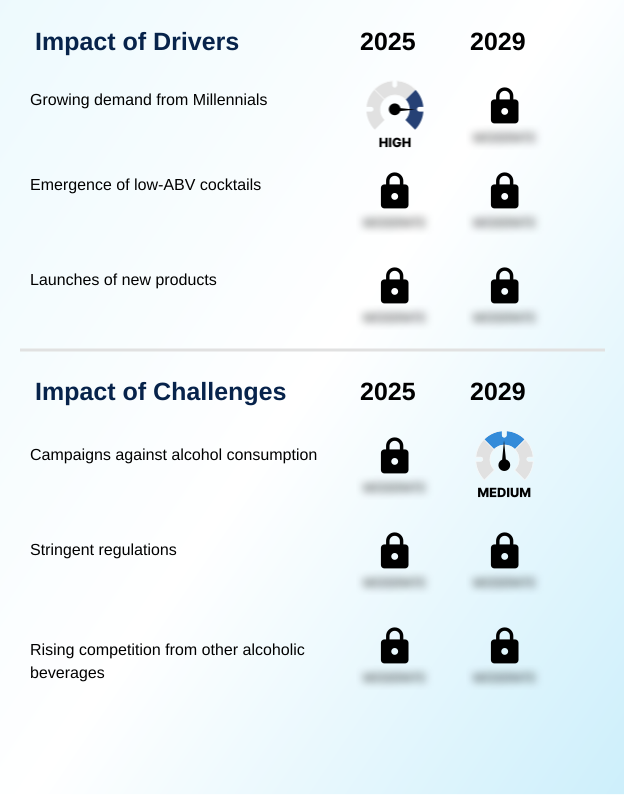
What are the key market drivers leading to the rise in the adoption of APAC Beer Industry?
- A key driver for market growth is the rising popularity of beer among millennials and Gen Z, whose preference for unique experiences and premium products fuels demand for craft and low ABV options.
- The growing popularity of beer among millennials and Gen Z is a significant driver, as this demographic's preference for high-quality, unique experiences has fueled a 20% surge in the premium and craft segments.
- These younger consumers are less influenced by tradition and more by brand storytelling and social media marketing, readily embracing international styles and innovative products.
- Another powerful driver is the advent of new products, particularly the emergence of low ABV options, which cater to the health and wellness trend.
- These products expand consumption occasions and attract a broader audience, with sales in the low- and no-alcohol category growing by nearly 9% annually. This constant flavor profile analysis and innovation keeps the market dynamic and appealing.
What are the market trends shaping the APAC Beer Industry?
- The market is characterized by a notable trend toward consolidation, with an increasing number of mergers and acquisitions reshaping the competitive landscape and strengthening distribution networks.
- A primary trend reshaping the beer market in APAC is the rapid expansion of online distribution channels, which has led to a 15% increase in direct-to-consumer sales for some brands. This digital transformation allows niche and craft brewers to bypass traditional retail gatekeepers and reach a wider audience through e-commerce platforms and dedicated mobile apps.
- The shift is supported by the development of sophisticated logistics, enabling last-mile delivery. Another key trend is the increasing number of mergers and acquisitions, where large corporations acquire local players to gain immediate access to established distribution networks and consumer loyalty, consolidating the supply chain.
- This strategic activity is particularly prevalent in emerging economies, where disposable income growth is fueling new demand, prompting a 10% year-over-year rise in investment in local production facilities.
What challenges does the APAC Beer Industry face during its growth?
- Campaigns against alcohol consumption, driven by public health initiatives and increasing health consciousness among consumers, present a significant challenge to the industry's growth trajectory.
- A significant challenge facing the beer market in APAC is the stringent regulatory environment, where heavy excise duty structures can inflate retail prices by up to 60% in some countries, limiting accessibility for price-sensitive consumers. These financial burdens are compounded by advertising restrictions and complex licensing requirements, which hamper brand-building and market entry.
- Another major hurdle is the rising cross-category competition from other alcoholic beverages like spirits and wine, as well as ready-to-drink alternatives. This intense rivalry for retail shelf space and consumer attention fragments the market, forcing brewers to invest more heavily in marketing and innovation to maintain a 5% growth in consumer loyalty.
- These factors create a difficult operating environment where compliance and competition erode margins.
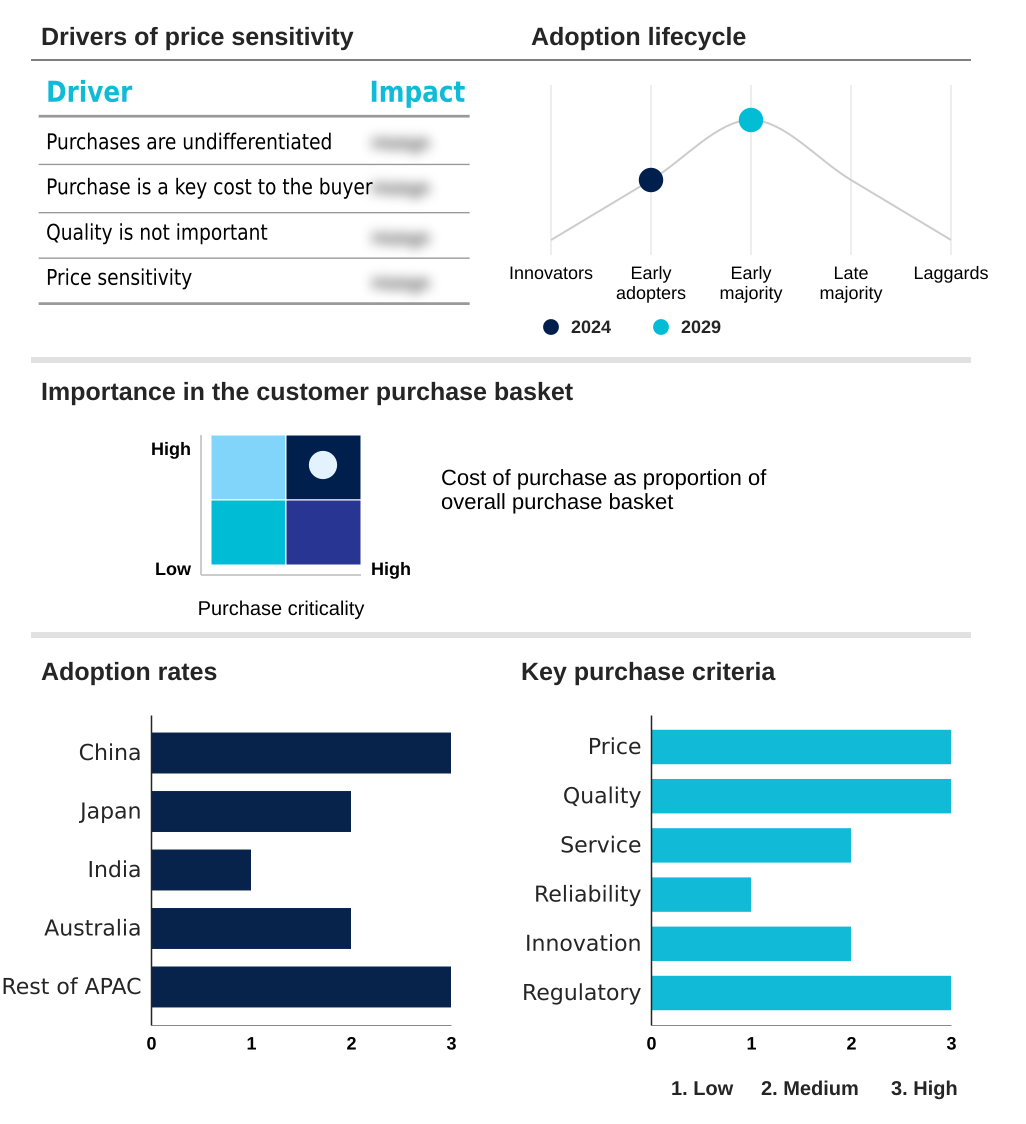
Exclusive Technavio Analysis on Customer Landscape
The apac beer market forecasting report includes the adoption lifecycle of the market, covering from the innovator’s stage to the laggard’s stage. It focuses on adoption rates in different regions based on penetration. Furthermore, the apac beer market report also includes key purchase criteria and drivers of price sensitivity to help companies evaluate and develop their market growth analysis strategies.
Customer Landscape of APAC Beer Industry
Competitive Landscape
Companies are implementing various strategies, such as strategic alliances, apac beer market forecast, partnerships, mergers and acquisitions, geographical expansion, and product/service launches, to enhance their presence in the industry.
Boon Rawd Brewery Co. Ltd. - Offerings include the brewing, packaging, and distribution of a diverse portfolio of beer products, featuring lagers, premium variants, and non-alcoholic options tailored for regional preferences.
The industry research and growth report includes detailed analyses of the competitive landscape of the market and information about key companies, including:
- Boon Rawd Brewery Co. Ltd.
- China Resources Beverages Ltd.
- Guangzhou Zhujiang Brewery Co Ltd
- HITEJINROBEVERAGE Co. Ltd.
- Kirin Holdings Co. Ltd.
- Lotte Chilsung Beverage Co. Ltd.
- Mohan Meakin Ltd.
- Orion Breweries Ltd.
- Bali Hai Brewery Indonesia
- San Miguel Brewery Inc.
- Suntory Beverage and Food Ltd.
- Taiwan Tobacco and Liquor Corp
- Thai Beverage Public Co. Ltd.
- Tsingtao Brewery Co. Ltd.
- Yuksom Breweries
Qualitative and quantitative analysis of companies has been conducted to help clients understand the wider business environment as well as the strengths and weaknesses of key industry players. Data is qualitatively analyzed to categorize companies as pure play, category-focused, industry-focused, and diversified; it is quantitatively analyzed to categorize companies as dominant, leading, strong, tentative, and weak.
Market Intelligence Radar: High-Impact Developments & Growth Signals
- In the Packaged Foods and Meats industry, the increased adoption of advanced track-and-trace solutions for enhanced supply chain transparency is compelling beer manufacturers to invest in similar technologies. This directly impacts the beer market in APAC by improving management of returnable bottle systems and ensuring product integrity through better cold chain logistics, which is critical for maintaining the flavor profile of craft beers.
- Stricter food safety regulations, such as the Food Safety Modernization Act (FSMA) standards, are creating new compliance burdens for beer producers. This development necessitates more rigorous water quality management and pasteurization protocols, impacting the operational costs and brewing process for both large-scale and microbrewery operations.
- A significant trend is the increasing consumer demand for private-label brands in retail, which now command up to 40% value share in some categories. For the beer market in APAC, this creates pressure on branded products and influences strategies around off-trade distribution and retail shelf space, forcing brewers to innovate on packaging line efficiency to compete on cost.
- The expansion of online retail channels and direct-to-consumer models within the broader food sector is reshaping how beer is sold. This shift requires brewers to develop robust e-commerce platforms and influencer partnerships, fundamentally changing their approach to marketing and distribution away from a sole reliance on traditional on-trade and off-trade channels.
Dive into Technavio’s robust research methodology, blending expert interviews, extensive data synthesis, and validated models for unparalleled APAC Beer Market insights. See full methodology.
| Market Scope | |
|---|---|
| Page number | 204 |
| Base year | 2025 |
| Historic period | 2020-2024 |
| Forecast period | 2026-2030 |
| Growth momentum & CAGR | Accelerate at a CAGR of 4.9% |
| Market growth 2026-2030 | USD 73.5 billion |
| Market structure | Fragmented |
| YoY growth 2025-2026(%) | 4.4% |
| Key countries | China, Japan, India, Australia and Rest of APAC |
| Competitive landscape | Leading Companies, Market Positioning of Companies, Competitive Strategies, and Industry Risks |
Research Analyst Overview
- The beer market in APAC operates within a complex ecosystem where raw material suppliers of hops and barley, advanced brewing technology providers, and manufacturers form the production core.
- The value chain is heavily influenced by a fragmented regulatory landscape, with national and state-level bodies dictating excise duties and advertising restrictions that can vary by as much as 50% between neighboring regions.
- Distribution is split between on-trade channels, which account for a significant portion of premium sales, and off-trade channels like supermarkets and e-commerce platforms, where volume and convenience are key. This off-trade segment has seen a 12% growth in online sales.
- End-user demand is shaped by factors like disposable income, urbanization, and the growing craft beer movement, which fosters innovation and SKU diversification.
What are the Key Data Covered in this APAC Beer Market Research and Growth Report?
-
What is the expected growth of the APAC Beer Market between 2026 and 2030?
-
The APAC Beer Market is expected to grow by USD 73.5 billion during 2026-2030, registering a CAGR of 4.9%. Year-over-year growth in 2026 is estimated at 4.4%%. This acceleration is shaped by growing popularity among millennials and gen z, which is intensifying demand across multiple end-use verticals covered in the report.
-
-
What segmentation does the market report cover?
-
The report is segmented by Distribution Channel (On-trade, and Off-trade), Packaging (Bottles, and Cans), Product (Lager, Ale, Pilsner, and Others) and Geography (APAC). Among these, the On-trade segment is estimated to witness significant growth during the forecast period, driven by rising adoption across key application areas. Each segment includes detailed qualitative and quantitative analysis, along with historical data from 2020-2024 and forecasts through 2030 with year-over-year growth rates.
-
-
Which regions are analyzed in the report?
-
The report covers APAC. Country-level analysis includes China, Japan, India, Australia and Rest of APAC, with dedicated market size tables and year-over-year growth for each.
-
-
What are the key growth drivers and market challenges?
-
The primary driver is growing popularity among millennials and gen z, which is accelerating investment and industry demand. The main challenge is campaigns against alcohol consumption, creating operational barriers for key market participants. The report quantifies the impact of each driver and challenge across 2026 and 2030 with comparative analysis.
-
-
Who are the major players in the APAC Beer Market?
-
Key vendors include Boon Rawd Brewery Co. Ltd., China Resources Beverages Ltd., Guangzhou Zhujiang Brewery Co Ltd, HITEJINROBEVERAGE Co. Ltd., Kirin Holdings Co. Ltd., Lotte Chilsung Beverage Co. Ltd., Mohan Meakin Ltd., Orion Breweries Ltd., Bali Hai Brewery Indonesia, San Miguel Brewery Inc., Suntory Beverage and Food Ltd., Taiwan Tobacco and Liquor Corp, Thai Beverage Public Co. Ltd., Tsingtao Brewery Co. Ltd. and Yuksom Breweries. The report provides qualitative and quantitative analysis categorizing companies as dominant, leading, strong, tentative, and weak based on their market positioning. Company profiles include business segment analysis, SWOT assessment, key offerings, and recent strategic developments.
-
Market Research Insights
- The competitive landscape in the beer market in APAC is highly active, with the top five vendors accounting for nearly 60% of the total market share. These leading players are focused on strategic expansion and portfolio diversification to capture growth in emerging economies.
- For example, key companies are establishing new regional headquarters to better manage local operations and respond to consumer tastes, leading to a 15% increase in localized product launches. This strategy of strengthening regional infrastructure is a direct response to the rising prominence of local craft brewers, who are gaining recognition for quality and innovation.
- The intense rivalry is further fueled by high fixed costs in production and distribution, compelling all players to compete aggressively for market share through both product innovation and strategic mergers and acquisitions.
We can help! Our analysts can customize this apac beer market research report to meet your requirements.
 RIA -
RIA - 
