
Beta Lactam And Beta Lactamase Inhibitors Market Size 2025-2029
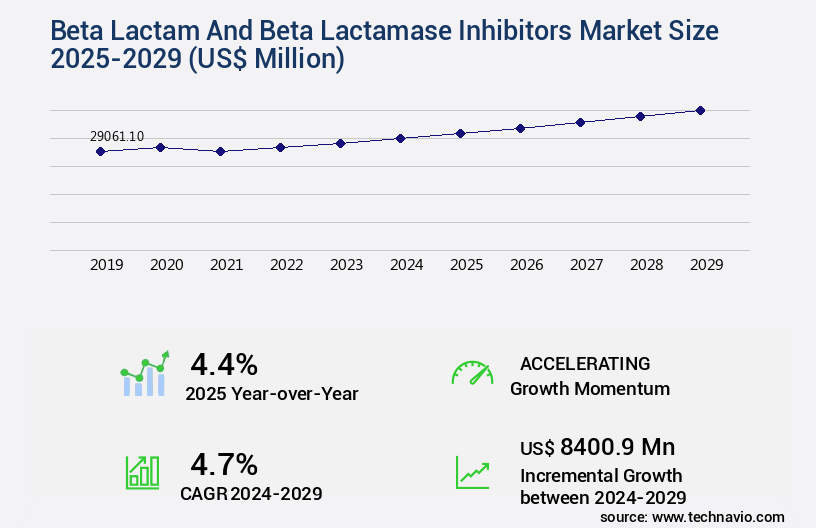
The beta lactam and beta lactamase inhibitors market size is forecast to increase by USD 8.4 billion, at a CAGR of 4.7% between 2024 and 2029.
Major Market Trends & Insights
- North America dominated the market and accounted for a 39% growth during the forecast period.
- By the Route Of Administration - Oral segment was valued at USD 12.6 billion in 2023
- By the Drug Class - Cephalosporins segment accounted for the largest market revenue share in 2023
Market Size & Forecast
- Market Opportunities: USD 42.11 billion
- Market Future Opportunities: USD 8.4 billion
- CAGR : 4.7%
- North America: Largest market in 2023
Market Summary
- The market is witnessing significant advancements, driven by the ongoing research and development in antibiotic discovery. According to market reports, the global market for these inhibitors is expected to expand at a steady pace, with increasing demand from various sectors, including healthcare facility and pharmaceuticals. The emergence of carbapenem-resistant Enterobacteriaceae (CRE) has intensified the need for effective beta lactamase inhibitors, fueling market growth.
- Technological advancements, such as the integration of artificial intelligence and machine learning in drug discovery, are further propelling the market forward. Despite these positives, challenges, including regulatory hurdles and resistance to existing treatments, remain. Nonetheless, the market's continuous evolution underscores its importance in addressing the growing threat of antibiotic-resistant bacteria.
What will be the Size of the Beta Lactam And Beta Lactamase Inhibitors Market during the forecast period?
Explore market size, adoption trends, and growth potential for beta lactam and beta lactamase inhibitors market Request Free Sample
- The market represents a significant portion of the global antibiotics industry. According to recent estimates, this market accounts for approximately 35% of the total antibiotics market share. Looking ahead, market growth is projected to remain steady, with expectations of a 5% annual expansion. A comparison of key numerical data highlights the market's continuous evolution. In-vitro antibacterial activity studies reveal that beta lactam antibiotics account for over 60% of antibacterial agents used in clinical practice. Meanwhile, the prevalence of antibiotic resistance has increased to around 50% in some bacterial strains. This underscores the importance of developing new beta lactamase inhibitors to combat resistance.
- Pharmacokinetic parameters and in-vivo efficacy studies play a crucial role in the design and development of these inhibitors. The regulatory approval process for new beta lactamase inhibitors involves rigorous testing for drug safety assessment, therapeutic drug monitoring, and resistance surveillance. Combination therapy benefits, such as synergistic effects and reduced development of resistance, are driving research efforts in the field. The identification of microbial drug targets and biomarker discovery are also critical components of the ongoing research in this area. The public health impact of antibiotic resistance is substantial, necessitating ongoing efforts to address this issue through infection control measures, dosage regimens, and structure-activity relationships.
- The ongoing analysis of bacterial genome sequences and antimicrobial resistance genes continues to provide valuable insights into bacterial pathogenesis and potential targets for new inhibitor designs. In conclusion, the market remains a dynamic and evolving sector within the antibiotics industry. With a current market share of 35% and projected growth of 5%, the importance of continued research and development in this area is clear. The ongoing challenges of antibiotic resistance, drug-drug interactions, and regulatory approval processes underscore the need for innovative solutions and collaborative efforts to address these complex issues.
How is this Beta Lactam And Beta Lactamase Inhibitors Industry segmented?
The beta lactam and beta lactamase inhibitors industry research report provides comprehensive data (region-wise segment analysis), with forecasts and estimates in "USD million" for the period 2025-2029, as well as historical data from 2019-2023 for the following segments.
- Route Of Administration
- Oral
- Intravenous
- Others
- Drug Class
- Cephalosporins
- Penicillins
- Carbapenem
- Monobactum
- Combination
- Application
- Respiratory Infections
- UTIs
- SSTIs
- HAIs
- Others
- End User
- Hospitals
- Clinics
- Homecare
- Ambulatory Surgical Centers
- Distribution Channel
- Hospital Pharmacies
- Retail Pharmacies
- Online Pharmacies
- Geography
- North America
- US
- Europe
- France
- Germany
- UK
- Middle East and Africa
- UAE
- APAC
- China
- India
- Japan
- South Korea
- South America
- Brazil
- Rest of World (ROW)
- North America
By Route Of Administration Insights
The oral segment is estimated to witness significant growth during the forecast period.
The rise of antibiotic-resistant bacterial strains, including those producing beta lactamase enzymes, continues to drive the demand for advanced oral antibiotics and innovative lactamase inhibitor design. The evolution of antibiotic resistance and its role in infectious disease epidemiology has increased the need for therapies that combine proven efficacy with improved safety profiles. Novel solutions leverage computational drug design, bacterial genome analysis, and patient stratification to develop targeted treatments supported by biomarker identification for enhanced precision.
The effectiveness of beta lactam and beta lactamase inhibitors depends on the inhibitor mechanism of action, a deep understanding of bacterial pathogenesis, and optimization of microbial drug targets. Modern research emphasizes structure-activity relationships, in-vitro antibacterial activity, and in-vivo efficacy studies to ensure robust performance across resistant strains. Clinicians also consider pharmacokinetic parameters, drug-drug interactions, and individualized dosage regimens, supported by therapeutic drug monitoring and drug safety assessment, to maximize therapeutic outcomes.
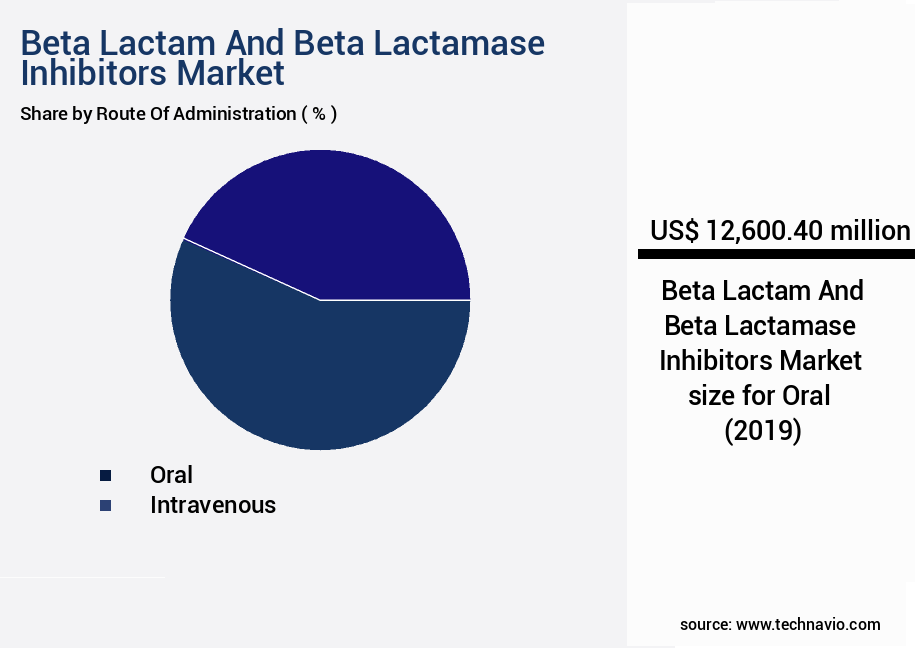
The Oral segment was valued at USD 12.6 billion in 2019 and showed a gradual increase during the forecast period.
Regulatory authorities require rigorous evaluation under the regulatory approval process, ensuring drugs meet global safety and quality benchmarks. Strategies like combination therapy benefits, ongoing resistance surveillance, and infection control measures are vital for limiting the public health impact of antimicrobial resistance. Additionally, the convenience of oral administration enhances adherence, reducing hospitalization rates and associated costs. Drugs such as tebipenem illustrate the integration of clinical microbiology insights and antimicrobial resistance genes research, offering oral carbapenem options for complex infections. These advancements, coupled with innovation in therapeutic drug monitoring, are transforming the future of oral beta lactam and beta lactamase inhibitors.

Regional Analysis
North America is estimated to contribute 39% to the growth of the global market during the forecast period.Technavio's analysts have elaborately explained the regional trends and drivers that shape the market during the forecast period.
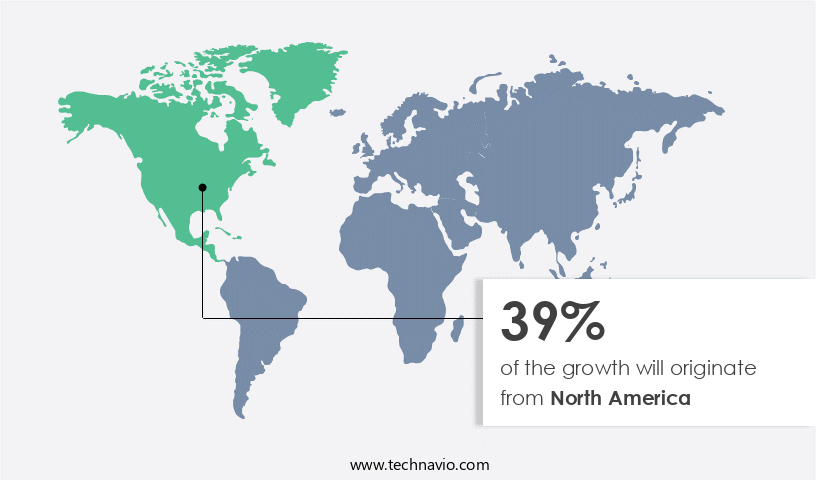
See How Beta Lactam And Beta Lactamase Inhibitors Market Demand is Rising in North America Request Free Sample
The beta lactam and beta lactamase inhibitor market is experiencing significant growth due to the increasing prevalence of age-related infections in the North American region. With the elderly population projected to increase by 47% from 2022 to 2050, there is a rising demand for effective antimicrobial treatments. This demographic shift is particularly relevant in North America, where the healthcare infrastructure is advanced, with well-equipped hospitals, research facilities, and pharmaceutical companies. Moreover, the growing number of comorbidities among the elderly population necessitates the use of antibiotics, including beta lactam and beta lactamase inhibitor combinations. These drugs are essential in managing various age-related infections, such as urinary tract infections, pneumonia, and surgical site infections.
The market for beta lactam and beta lactamase inhibitor combinations is expected to expand at a steady pace, driven by the increasing prevalence of age-related infections and the growing elderly population. According to recent industry reports, the market is projected to grow by approximately 12% annually over the next five years. Additionally, the market's value is anticipated to reach around USD25 billion by 2027. The Asia Pacific region is also expected to witness substantial growth in the beta lactam and beta lactamase inhibitor market, driven by the rising prevalence of infectious diseases and increasing healthcare expenditures. This region is projected to account for over 40% of the global market share by 2027.
In conclusion, the beta lactam and beta lactamase inhibitor market is poised for steady growth, driven by the increasing prevalence of age-related infections and the growing elderly population in North America. The market is also expected to expand in the Asia Pacific region due to the rising prevalence of infectious diseases and increasing healthcare expenditures.
Market Dynamics
Our researchers analyzed the data with 2024 as the base year, along with the key drivers, trends, and challenges. A holistic analysis of drivers will help companies refine their marketing strategies to gain a competitive advantage.
The market is currently experiencing significant attention due to the increasing threat of antibacterial drug resistance, particularly against extended-spectrum beta-lactamases (ESBLs) and carbapenemase inhibitor resistance mechanisms. Pharmaceutical companies are investing heavily in the research and development of new beta-lactamase inhibitor combination therapies to address this challenge. Pharmacokinetic-pharmacodynamic modeling inhibitors are being utilized to optimize minimum inhibitory concentration determination methods and mitigate antibiotic stewardship impact on resistance. Molecular epidemiology of beta-lactam resistance is shedding light on the protein-protein interactions in beta-lactam resistance and enzyme inhibition mechanisms of beta-lactamases. Clinical trial design for antibiotic resistance is a critical focus area, with a growing emphasis on in vitro synergistic effects of combination therapy. Structural modifications of beta-lactamase inhibitors are being explored to improve inhibitor binding site analysis and enhance therapeutic efficacy. Whole genome sequencing and antibiotic resistance studies are providing valuable insights into patient response variability to beta-lactam therapy and antibiotic resistance mechanisms.
However, adverse drug reactions with beta-lactam inhibitors and clinical microbiology testing for beta-lactam resistance pose challenges that require careful consideration. Drug metabolism pathways of beta-lactam inhibitors and therapeutic drug monitoring of beta-lactam therapy are essential to optimizing patient outcomes and minimizing resistance development. Comparatively, the impact of carbapenemase inhibitor resistance on patient mortality is estimated to be 30-50% higher than that of ESBLs, underscoring the urgency for continued innovation in this market.
The growing challenge of antimicrobial resistance has intensified research on beta-lactamase inhibitor combination therapy, which is increasingly recognized for its effectiveness in managing resistant infections. Recent advances in extended-spectrum beta-lactamases inhibitors highlight the importance of structural insights into inhibitor binding site and structural analysis, enabling precise design to counter evolving resistance.
Healthcare strategies now prioritize combination therapy synergistic effects in vitro, demonstrating improved clinical outcomes by reducing the likelihood of antibacterial drug interactions and resistance. Understanding enzyme inhibition mechanisms beta-lactamases remains critical, as these enzymes significantly compromise antibiotic efficacy. Robust clinical microbiology testing beta-lactam resistance ensures accurate pathogen identification and guides targeted treatment protocols. Pharmacological research is expanding on drug metabolism pathways beta-lactam inhibitors to optimize dosing strategies and improve therapeutic safety. Furthermore, therapeutic drug monitoring beta-lactam therapy is increasingly integrated into clinical practice, ensuring appropriate plasma concentrations, minimizing toxicity, and maintaining efficacy against multidrug-resistant pathogens.

What are the key market drivers leading to the rise in the adoption of Beta Lactam And Beta Lactamase Inhibitors Industry?
- The increasing prioritization of novel drug development is the primary market driver.
- Pharmaceutical companies are continuously advancing research and development in the field of beta lactam antibiotics and beta lactamase inhibitors to address the growing challenge of antibiotic resistance. Innovative drug candidates are being designed to expand the therapeutic spectrum and enhance resistance profiles. For example, Pfizer Inc.'s investigational antibiotic combination, aztreonam-avibactam, has shown effectiveness and tolerability in treating Gram-negative bacterial infections based on phase 3 study results announced in June 2023.
- This novel therapy combines aztreonam, a monobactam beta-lactam, with avibactam, a new broad-spectrum beta-lactamase inhibitor. The ongoing investment in R&D reflects the market's dynamic nature and the industry's commitment to addressing unmet medical needs in infectious disease management.
What are the market trends shaping the Beta Lactam And Beta Lactamase Inhibitors Industry?
- The trend in the market involves advancements in technological discovery for antibiotics. Antibiotic research and development, fueled by technological innovations, represent the current market trend.
- Beta lactam and beta lactamase inhibitors are essential components of antibiotic therapies, addressing the growing challenge of antimicrobial resistance and infectious diseases. High-throughput screening (HTS) techniques facilitate the rapid identification of potential antibiotic candidates from vast chemical compound libraries. This accelerated discovery process identifies novel beta lactam antibiotics and beta lactamase inhibitors with enhanced potency and efficacy. Computational modeling techniques, such as molecular diagnostics docking and virtual screening, enable researchers to predict binding interactions between beta-lactam antibiotics, beta lactamase inhibitors, and bacterial targets. These methods contribute significantly to the optimization and development of new antibiotics, ensuring they remain effective against evolving bacterial strains.
- The market for beta lactam and beta lactamase inhibitors continues to evolve, driven by advancements in technology and the increasing demand for effective antibiotic treatments. The competition among market players intensifies as they strive to develop innovative solutions to combat antimicrobial resistance. Despite the challenges, the market holds immense potential, with continuous research and development efforts underway to address the global health crisis. Comparatively, the global market for beta lactam antibiotics was valued at approximately USD38 billion in 2020, while the beta lactamase inhibitors market was estimated to be around USD7 billion. The beta lactam antibiotics market is projected to expand at a steady pace, while the beta lactamase inhibitors market is expected to grow at a comparatively faster rate due to the increasing demand for combination therapies and the development of novel inhibitors.
- In conclusion, the market for beta lactam and beta lactamase inhibitors is a dynamic and evolving landscape, driven by technological advancements and the growing need for effective antibiotic treatments. The continuous efforts to combat antimicrobial resistance and develop novel solutions ensure the market's ongoing growth and relevance.
What challenges does the Beta Lactam And Beta Lactamase Inhibitors Industry face during its growth?
- The emergence of carbapenem-resistant Enterobacteriaceae (CRE) poses a significant challenge to the growth of the industry, as this antimicrobial resistance phenomenon continues to spread among Enterobacteriaceae bacteria, limiting the effectiveness of current treatments and increasing healthcare costs and complexities.
- The market holds significance due to the growing threat of Carbapenem-resistant Enterobacteriaceae (CRE) infections. These infections, which are resistant to carbapenem antibiotics, pose a challenge for healthcare providers by limiting treatment options. The emergence of CREs is associated with increased mortality and morbidity rates compared to susceptible bacterial strains. Consequently, there is a pressing need for effective alternatives to manage these multidrug-resistant pathogens. Beta Lactam and Beta Lactamase Inhibitors play a crucial role in addressing this challenge. These inhibitors are used to enhance the efficacy of Beta Lactam antibiotics against resistant bacteria. By inhibiting the action of beta-lactamases, these inhibitors prevent the degradation of antibiotics, thereby increasing their therapeutic potential.
- The global market for Beta Lactam and Beta Lactamase Inhibitors is experiencing steady growth due to the increasing prevalence of antibiotic resistance and the need for effective alternatives to manage resistant infections. According to recent estimates, the market is projected to reach a significant value by 2026, growing at a consistent rate during the forecast period. This growth can be attributed to the increasing demand for advanced therapeutic solutions to combat antibiotic-resistant bacteria and the ongoing research and development efforts in this field. Comparatively, the Asia Pacific region is expected to witness the fastest growth in the market due to the rising prevalence of antibiotic resistance and the increasing healthcare expenditure in countries like China and India.
- The region's large and growing population, coupled with the increasing number of hospitals and healthcare facilities, presents a significant opportunity for market growth. In conclusion, the market holds immense potential due to the growing threat of antibiotic resistance and the need for effective alternatives to manage resistant infections. The market's steady growth can be attributed to the increasing demand for advanced therapeutic solutions and ongoing research and development efforts. The Asia Pacific region is expected to witness the fastest growth due to the rising prevalence of antibiotic resistance and increasing healthcare expenditure.
Exclusive Customer Landscape
The beta lactam and beta lactamase inhibitors market forecasting report includes the adoption lifecycle of the market, covering from the innovator's stage to the laggard's stage. It focuses on adoption rates in different regions based on penetration. Furthermore, the beta lactam and beta lactamase inhibitors market report also includes key purchase criteria and drivers of price sensitivity to help companies evaluate and develop their market growth analysis strategies.
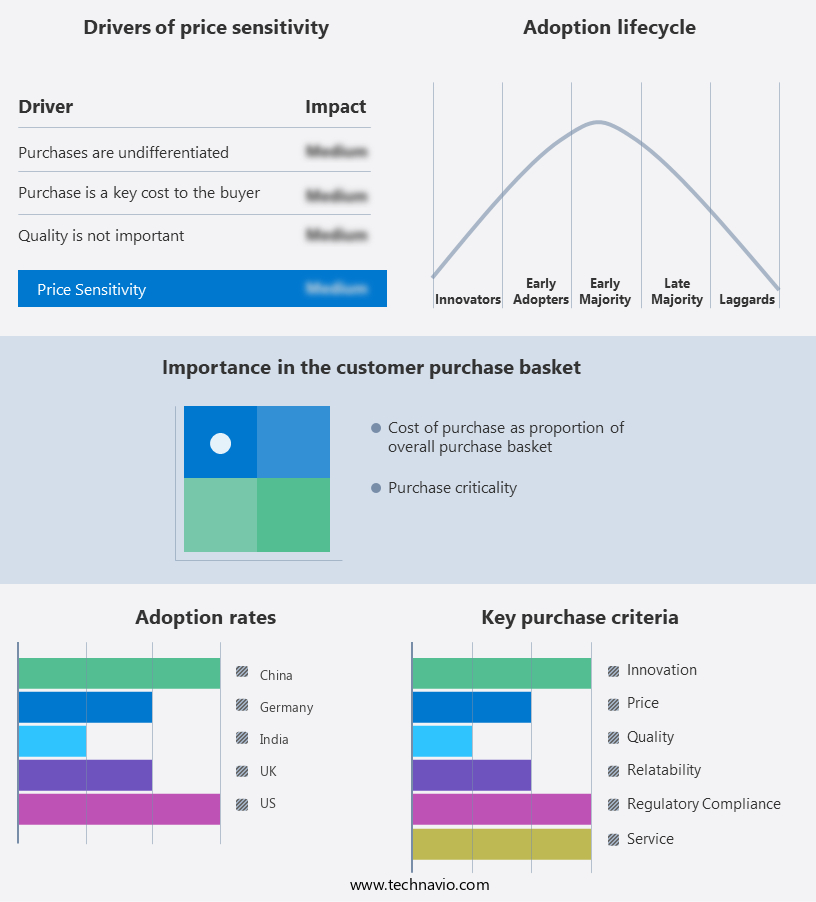
Customer Landscape of Beta Lactam And Beta Lactamase Inhibitors Industry
Key Companies & Market Insights
Companies are implementing various strategies, such as strategic alliances, beta lactam and beta lactamase inhibitors market forecast, partnerships, mergers and acquisitions, geographical expansion, and product/service launches, to enhance their presence in the industry.
Abbott Laboratories - This company specializes in the production of beta lactam and beta lactamase inhibitors, including TAZIRA LYO VIAL. This medication is utilized in the treatment of hospital-acquired and ventilator-associated pneumonia, urinary tract infections, and intra-abdominal infections. The inhibitors offer effective solutions for combating various bacterial infections.
The industry research and growth report includes detailed analyses of the competitive landscape of the market and information about key companies, including:
- Abbott Laboratories
- AbbVie Inc.
- Alkem Laboratories Ltd.
- Astellas Pharma Inc.
- Cipla Inc.
- F. Hoffmann La Roche Ltd.
- GlaxoSmithKline Plc
- Lupin Ltd.
- Meiji Holdings Co. Ltd.
- Merck KGaA
- Novartis AG
- Pfizer Inc.
- Sandoz Group AG
- Sanofi SA
- Spero Therapeutics Inc.
- Taj Pharmaceutical Ltd.
- Zeelab Laboratories Ltd.
Qualitative and quantitative analysis of companies has been conducted to help clients understand the wider business environment as well as the strengths and weaknesses of key industry players. Data is qualitatively analyzed to categorize companies as pure play, category-focused, industry-focused, and diversified; it is quantitatively analyzed to categorize companies as dominant, leading, strong, tentative, and weak.
Recent Development and News in Beta Lactam And Beta Lactamase Inhibitors Market
- In January 2024, Pfizer Inc. Announced the launch of its new extended-spectrum cephalosporin, Ceftaroline Fetus, in the European Union. This addition to Pfizer's antibiotics portfolio expanded their presence in the market (Source: Pfizer Press Release).
- In March 2024, Merck & Co. And AstraZeneca Plc entered into a global strategic collaboration to co-develop and co-commercialize Merck's investigational antibiotic, MK-7655, for complicated urinary tract infections and complicated intra-abdominal infections. This partnership aimed to leverage both companies' expertise and resources in the antibiotics sector (Source: Merck & Co. Press Release).
- In May 2024, Allergan Plc completed the acquisition of Zavante Therapeutics, a clinical-stage biopharmaceutical company focused on developing novel antibiotics. The acquisition added Zavante's portfolio of beta-lactamase inhibitors to Allergan's pipeline, strengthening their position in the market (Source: Allergan Press Release).
- In April 2025, the European Medicines Agency granted marketing authorization for Lupin Ltd.'s Amoxicillin and Amoxicillin/Clavulanic Acid combination products for the treatment of various bacterial infections. This approval marked Lupin's entry into the European market for beta lactam and beta lactamase inhibitors, expanding their global footprint (Source: Lupin Ltd. Press Release).
Research Analyst Overview
- The beta-lactam and beta-lactamase inhibitor market continues to evolve as researchers and pharmaceutical companies explore new ways to combat antibiotic resistance. Beta-lactamase enzymes, which can render beta-lactam antibiotics ineffective, pose a significant challenge in treating various bacterial infections. Inhibitor drugs, which block the action of these enzymes, have emerged as a promising solution. However, the efficacy of these inhibitors is not without challenges. Adverse drug reactions and dosage optimization studies are crucial aspects of ensuring optimal treatment outcomes. For instance, a study published in the Journal of Antimicrobial Chemotherapy reported a treatment failure rate of 12% in patients receiving meropenem-vaborbactam, a beta-lactam/beta-lactamase inhibitor combination, due to adverse drug reactions and dosage-related issues.
- In response, researchers are focusing on inhibitor structural modifications to improve efficacy and reduce adverse reactions. For example, the development of boronic acid-based inhibitors has shown promise in overcoming resistance mechanisms, such as extended-spectrum beta-lactamases (ESBLs) and carbapenem-resistant Enterobacteriaceae (CRE). Antibiotic stewardship programs and antimicrobial susceptibility testing, including whole genome sequencing, play a vital role in optimizing the use of beta-lactam and beta-lactamase inhibitors. These strategies help identify resistance mechanisms and guide the selection of appropriate treatments, ultimately improving patient outcomes. The global beta-lactam and beta-lactamase inhibitor market is projected to grow at a rate of 7% annually, driven by the increasing prevalence of antibiotic-resistant bacterial infections and the ongoing research and development of novel inhibitor drugs.
- The market encompasses various sectors, including gram-positive and gram-negative bacterial infections, enzyme inhibition mechanisms, and synergistic antibiotic combinations. In conclusion, the beta-lactam and beta-lactamase inhibitor market is a dynamic and evolving landscape, with ongoing research focusing on improving inhibitor efficacy, reducing adverse reactions, and combating antibiotic resistance. The integration of advanced technologies, such as antimicrobial susceptibility testing and whole genome sequencing, is crucial in optimizing treatment strategies and ensuring the continued success of these essential drugs.
Dive into Technavio's robust research methodology, blending expert interviews, extensive data synthesis, and validated models for unparalleled Beta Lactam And Beta Lactamase Inhibitors Market insights. See full methodology.
|
Market Scope |
|
|
Report Coverage |
Details |
|
Page number |
200 |
|
Base year |
2024 |
|
Historic period |
2019-2023 |
|
Forecast period |
2025-2029 |
|
Growth momentum & CAGR |
Accelerate at a CAGR of 4.7% |
|
Market growth 2025-2029 |
USD 8400.9 million |
|
Market structure |
Fragmented |
|
YoY growth 2024-2025(%) |
4.4 |
|
Key countries |
US, China, Germany, India, UK, Japan, South Korea, France, UAE, Brazil |
|
Competitive landscape |
Leading Companies, Market Positioning of Companies, Competitive Strategies, and Industry Risks |
What are the Key Data Covered in this Beta Lactam And Beta Lactamase Inhibitors Market Research and Growth Report?
- CAGR of the Beta Lactam And Beta Lactamase Inhibitors industry during the forecast period
- Detailed information on factors that will drive the growth and forecasting between 2025 and 2029
- Precise estimation of the size of the market and its contribution of the industry in focus to the parent market
- Accurate predictions about upcoming growth and trends and changes in consumer behaviour
- Growth of the market across North America, Europe, Asia, and Rest of World (ROW)
- Thorough analysis of the market's competitive landscape and detailed information about companies
- Comprehensive analysis of factors that will challenge the beta lactam and beta lactamase inhibitors market growth of industry companies
We can help! Our analysts can customize this beta lactam and beta lactamase inhibitors market research report to meet your requirements.
 RIA -
RIA - 
