
Bevel Gears Market Size 2025-2029
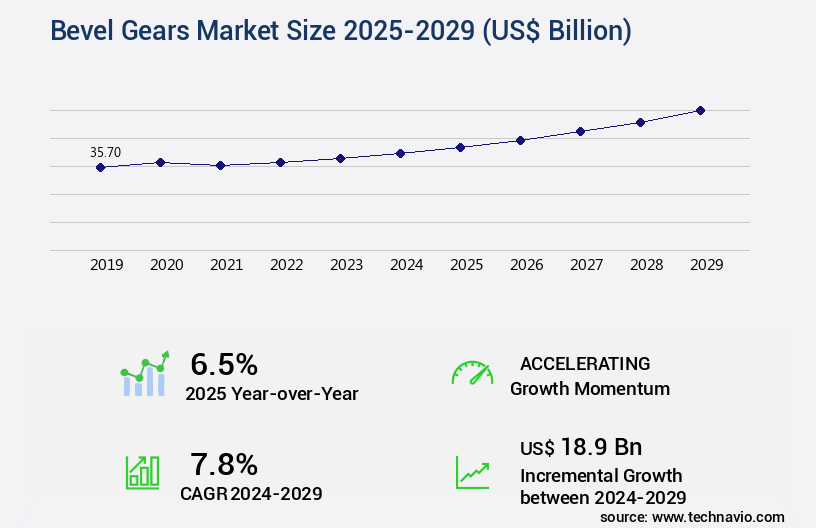
The bevel gears market size is valued to increase USD 18.9 billion, at a CAGR of 7.8% from 2024 to 2029. Expansion of manufacturing facilities will drive the bevel gears market.
Major Market Trends & Insights
- APAC dominated the market and accounted for a 44% growth during the forecast period.
- By Type - Straight bevel gears segment was valued at USD 20.70 billion in 2023
- By segment2 - segment2_1 segment accounted for the largest market revenue share in 2023
Market Size & Forecast
- Market Opportunities: USD 69.75 billion
- Market Future Opportunities: USD 18.90 billion
- CAGR from 2024 to 2029 : 7.8%
Market Summary
- The market represents a significant segment within the broader mechanical power transmission industry, with a global value exceeding USD 3.5 billion in 2021. This market's expansion is driven by the increasing adoption of bevel gears in various industries, including automotive, power generation, and heavy machinery. Bevel gears' versatility and robustness make them an essential component in transmitting power between perpendicular or intersecting shafts. Their application in heavy-duty machinery, such as wind turbines and mining equipment, is particularly noteworthy. In the automotive sector, bevel gears are crucial for transmitting power between the differential and the wheels, ensuring optimal vehicle performance.
- Competition from alternative power transmission solutions, such as helical gears and CVTs, poses a challenge to the market. However, bevel gears' unique advantages, including their ability to handle large torque loads and high-speed applications, keep them in demand. The manufacturing sector's expansion, particularly in emerging economies, is another key driver for the market. The growing adoption of automation and robotics in manufacturing processes further increases the demand for bevel gears, as they are integral components in these systems. Despite these positive trends, the market faces challenges, including increasing raw material costs and the need for continuous innovation to meet evolving industry demands.
- In conclusion, the market is a dynamic and essential component of the mechanical power transmission industry, with a global value surpassing USD 3.5 billion in 2021. Its versatility, robustness, and unique advantages continue to drive its adoption across various industries, despite competition from alternative solutions and challenges such as increasing raw material costs and the need for continuous innovation.
What will be the Size of the Bevel Gears Market during the forecast period?
Get Key Insights on Market Forecast (PDF) Request Free Sample
How is the Bevel Gears Market Segmented ?
The bevel gears industry research report provides comprehensive data (region-wise segment analysis), with forecasts and estimates in "USD billion" for the period 2025-2029, as well as historical data from 2019-2023 for the following segments.
- Type
- Straight bevel gears
- Spiral bevel gears
- Geography
- North America
- US
- Canada
- Europe
- France
- Germany
- Italy
- UK
- APAC
- China
- India
- Japan
- South Korea
- Rest of World (ROW)
- North America
By Type Insights
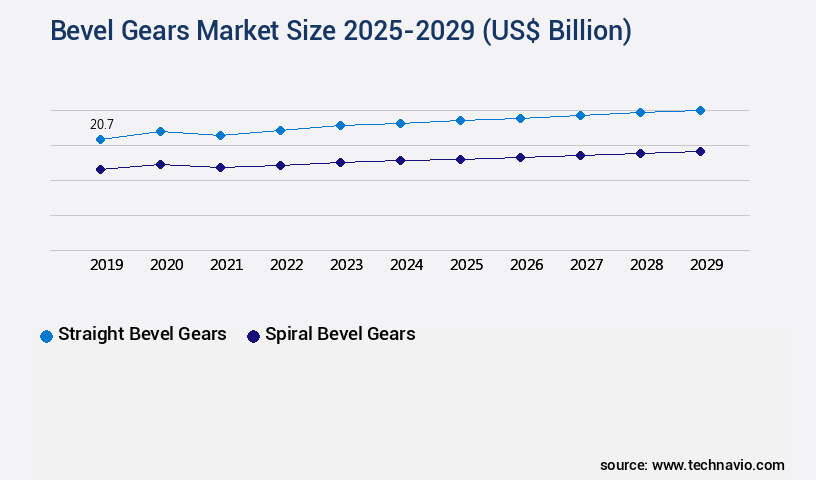
The straight bevel gears segment is estimated to witness significant growth during the forecast period.
The market showcases ongoing advancements in gear technology, with straight bevel gears remaining a key focus. These gears, characterized by their straight teeth cut at a 90-degree angle, are essential in applications demanding both high torque and precision. Straight bevel gears are pivotal in gearboxes and differentials, facilitating seamless power transmission. Conic section geometry and manufacturing tolerances are crucial factors in their design, ensuring meshing accuracy and reducing noise vibration harshness. Bearing selection guides, casing design considerations, and tooth contact ratio are intricately linked to their performance. Involute profile, surface finish requirements, and quality control procedures are essential for optimal tooth profile design and precision machining techniques.
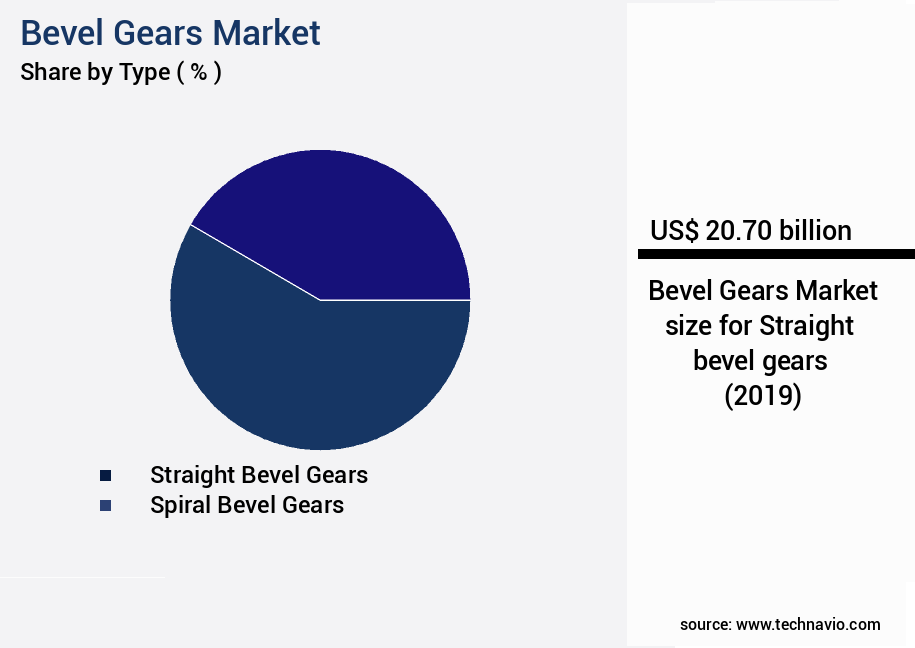
The Straight bevel gears segment was valued at USD 20.70 billion in 2019 and showed a gradual increase during the forecast period.
Dynamic load analysis, fatigue life prediction, and hypoid gear geometry are critical in assessing their durability. With the integration of cutting-edge technologies like finite element analysis and pressure angle calculation, the assembly process is optimized for enhanced efficiency and torque capacity limits. The selection of appropriate materials, such as those with optimal stress concentration factors, is vital for optimal performance. Straight bevel gears facilitate efficient power transmission, with pitch diameter calculation and face width calculation playing significant roles in their design principles. The market continues to evolve, with advancements in lubrication system design, shaft alignment methods, module calculation, axial pitch calculation, and grinding wheel specifications shaping the future of this sector.
Regional Analysis
APAC is estimated to contribute 44% to the growth of the global market during the forecast period. Technavio's analysts have elaborately explained the regional trends and drivers that shape the market during the forecast period.

See How Bevel Gears Market Demand is Rising in APAC Request Free Sample
The Asia Pacific the market is witnessing substantial growth, fueled by expanding production capabilities and increasing renewable energy capacity in the region. This focus on growth is driving the demand for high-quality bevel gears, which are crucial for various applications in industries such as automotive and renewable energy. In May 2023, Toyota Kirloskar Motor (TKM) in India initiated three-shift operations at its Bidadi plant, increasing production output by over 30%. This expansion underscores TKM's commitment to meeting the rising automotive demand in the region.
Additionally, TKM established a new e-Drive manufacturing line at Toyota Kirloskar Auto Parts (TKAP), signaling a strategic focus on electric vehicle (EV) components. The market's growth is further evidenced by the increasing adoption of EVs and the expansion of renewable energy infrastructure in the Asia Pacific region.
Market Dynamics
Our researchers analyzed the data with 2024 as the base year, along with the key drivers, trends, and challenges. A holistic analysis of drivers will help companies refine their marketing strategies to gain a competitive advantage.
The market encompasses the design, manufacturing, and application of bevel gears, a type of gear used to transmit power between perpendicular shafts. Hypoid and spiral bevel gears are popular designs in this market, each with unique design parameters. Hypoid bevel gears have a cone-shaped tooth profile, while spiral bevel gears feature helical teeth. Manufacturing processes for bevel gears include cutting, grinding, and hobbing. These methods require precise calculation of tooth thickness to ensure proper meshing and efficient power transmission. The influence of gear ratio on efficiency is significant, as higher ratios can lead to increased power loss and heat generation. Lubrication plays a crucial role in bevel gear life, with advanced techniques ensuring optimal film thickness and reducing wear. Surface finish optimization and advanced failure analysis using finite element analysis help improve gear durability. Bevel gears are also subjected to high stress levels, necessitating heat treatment optimization and advanced manufacturing techniques. Material selection impacts gear durability, with high-strength alloys often used for heavy-duty applications. Precision machining and noise reduction design are essential for bevel gears, particularly in robotics applications where precise movement is required. Measuring backlash and improving the assembly process are crucial for maintaining quality control. Designing for high torque applications and optimizing meshing accuracy are ongoing challenges in the market. Advanced lubrication techniques ensure efficient operation and prolonged gear life. The market continues to evolve, with ongoing research and development focusing on improving manufacturing processes, material selection, and design techniques.
What are the key market drivers leading to the rise in the adoption of Bevel Gears Industry?
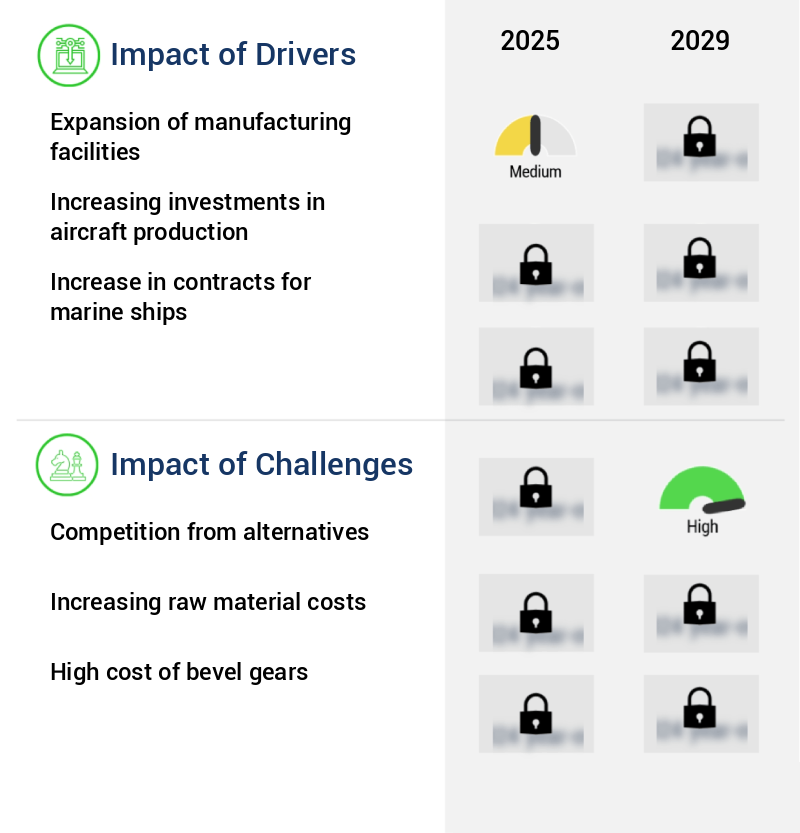
- The expansion of manufacturing facilities serves as the primary catalyst for market growth.
- The market is experiencing a significant surge, fueled by the expansion of manufacturing facilities worldwide. This growth is driven by the increasing production capabilities and the rising demand for bevel gears in diverse applications. For instance, in late 2024, Cisco, a leading technology company, announced the establishment of a new manufacturing facility in Chennai, India, dedicated to producing advanced network control systems.
- This strategic move underscores Cisco's commitment to bolstering its manufacturing and export capabilities in the Indian market. In turn, it drives the demand for bevel gears utilized in precision machinery and network infrastructure. The market's evolution is a testament to the growing industrial landscape and the crucial role these gears play in various sectors.
What are the market trends shaping the Bevel Gears Industry?
- The increasing use of automation and robotics is a notable trend in the upcoming market. This technological advancement is mandated by growing business demands for efficiency and productivity.
- The market is experiencing a significant surge, fueled by the increasing adoption of automation and robotics across various sectors. This trend is driven by substantial investments in new manufacturing facilities and advanced technologies, aimed at enhancing production efficiency and meeting the rising demand for precision-engineered products. For instance, Mitsubishi Electric, a leading global player in industrial automation, announced plans to establish a new factory in India in mid-2022. This facility, designed to produce advanced factory automation control systems, including high-efficiency inverters, addresses the escalating need for automation solutions in India's rapidly growing industrial sector.
- The establishment of this factory is expected to streamline production processes, reduce operational costs, and improve product quality, ultimately boosting the adoption of bevel gears in various applications. This evolving market landscape underscores the importance of bevel gears in enabling industrial automation and driving manufacturing efficiency.
What challenges does the Bevel Gears Industry face during its growth?
- The growth of the industry is significantly influenced by the intense competition posed by alternative options.
- The market experiences continuous evolution, shaped by the growing adoption of alternative gear types in various sectors. Among these alternatives, worm gears, helical gears, and spur gears offer unique advantages that challenge bevel gears' dominance. Worm gears, in particular, are renowned for their high torque output and substantial speed reduction capabilities. Their compact design makes them suitable for applications with space constraints, and their self-locking feature ensures safety in mechanical systems. However, the efficiency of worm gears is generally lower than that of bevel gears due to higher friction losses.
- Despite this, the versatility and specific benefits of these alternative gears make them attractive options for industries such as automotive, aerospace, and power generation.
Exclusive Technavio Analysis on Customer Landscape
The bevel gears market forecasting report includes the adoption lifecycle of the market, covering from the innovator's stage to the laggard's stage. It focuses on adoption rates in different regions based on penetration. Furthermore, the bevel gears market report also includes key purchase criteria and drivers of price sensitivity to help companies evaluate and develop their market growth analysis strategies.

Customer Landscape of Bevel Gears Industry
Competitive Landscape
Companies are implementing various strategies, such as strategic alliances, bevel gears market forecast, partnerships, mergers and acquisitions, geographical expansion, and product/service launches, to enhance their presence in the industry.
AmTech International - The company specializes in manufacturing and supplying various types of bevel gears, including straight bevel gears, spiral bevel gears, and anti-backlash gears, catering to diverse industrial applications with a focus on precision and durability.
The industry research and growth report includes detailed analyses of the competitive landscape of the market and information about key companies, including:
- AmTech International
- Arrow Gear
- B and R Machine and Gear Corp
- Bevel Gears India Pvt Ltd
- Bharat Gears Ltd.
- FA.TA. Ricambi S.p.A.
- Gear Motions Inc.
- Gibbs Gears Precision Engineers Ltd
- Gleason Corp.
- KLINGELNBERG GmbH
- Kohara Gear Industry Co. Ltd.
- Martin Sprocket and Gear Inc.
- Nippon Gear Co Ltd.
- Renold Plc
- Richconn Technoloy Co Ltd
- WM Berg Inc.
- ZF Friedrichshafen AG
Qualitative and quantitative analysis of companies has been conducted to help clients understand the wider business environment as well as the strengths and weaknesses of key industry players. Data is qualitatively analyzed to categorize companies as pure play, category-focused, industry-focused, and diversified; it is quantitatively analyzed to categorize companies as dominant, leading, strong, tentative, and weak.
Recent Development and News in Bevel Gears Market
- In January 2024, Renold Plc, a leading manufacturer of engineering components, announced the launch of its new range of Bevel Helical Gears, designed to offer increased efficiency and durability for industrial applications (Renold Plc Press Release).
- In March 2024, NSK Ltd. and Schaeffler AG, two major players in the market, formed a strategic partnership to expand their product offerings and enhance their market presence (Nikkei Asia).
- In May 2024, TimkenSteel Corporation, a leading producer of alloy and carbon steel, completed the acquisition of a bevel gear manufacturing plant from ThyssenKrupp AG, significantly expanding its production capacity and market share in the bevel gears sector (TimkenSteel Corporation SEC Filing).
- In April 2025, the European Union announced the approval of new regulations to boost the adoption of energy-efficient bevel gears in various industries, creating a significant growth opportunity for market participants (European Commission Press Release).
Dive into Technavio's robust research methodology, blending expert interviews, extensive data synthesis, and validated models for unparalleled Bevel Gears Market insights. See full methodology.
|
Market Scope |
|
|
Report Coverage |
Details |
|
Page number |
200 |
|
Base year |
2024 |
|
Historic period |
2019-2023 |
|
Forecast period |
2025-2029 |
|
Growth momentum & CAGR |
Accelerate at a CAGR of 7.8% |
|
Market growth 2025-2029 |
USD 18.9 billion |
|
Market structure |
Fragmented |
|
YoY growth 2024-2025(%) |
6.5 |
|
Key countries |
China, US, Germany, Japan, UK, South Korea, India, France, Canada, and Italy |
|
Competitive landscape |
Leading Companies, Market Positioning of Companies, Competitive Strategies, and Industry Risks |
Research Analyst Overview
- The bevel gear market continues to evolve, driven by advancements in conic section geometry and manufacturing tolerances. These innovations enable the production of gears with improved noise vibration harshness (NVH) performance and higher tooth contact ratios. Bevel gears find extensive applications in various sectors, including automotive, aerospace, and power generation. For instance, the automotive industry witnesses a significant increase in sales of vehicles equipped with advanced drivetrain systems, leading to a growing demand for high-performance bevel gears. Manufacturers are focusing on optimizing bearing selection, casing design considerations, and lubrication system design to enhance power transmission efficiency and torque capacity limits.
- Surface finish requirements and quality control procedures are essential to ensure meshing accuracy testing and maintain conjugate action between gears. Additionally, the industry anticipates a robust growth of 5% in the next five years, fueled by the increasing adoption of spiral bevel gears in diverse applications. A notable example of this market trend is the implementation of advanced hobbing machine parameters and assembly process optimization techniques in the production of hypoid gears for heavy-duty vehicles. This results in a substantial reduction in stress concentration factors and an increase in power transmission efficiency. Furthermore, the integration of finite element analysis and pressure angle calculation in gear design principles enables manufacturers to predict fatigue life and improve tooth profile design.
- In conclusion, the bevel gear market is characterized by continuous innovation and unfolding patterns. Manufacturers are focusing on optimizing various aspects of gear production, from conic section geometry to gearbox design principles, to meet the evolving demands of diverse industries. These efforts contribute to the ongoing advancements in gear technology and the development of more efficient, reliable, and high-performance bevel gears.
What are the Key Data Covered in this Bevel Gears Market Research and Growth Report?
-
What is the expected growth of the Bevel Gears Market between 2025 and 2029?
-
USD 18.9 billion, at a CAGR of 7.8%
-
-
What segmentation does the market report cover?
-
The report is segmented by Type (Straight bevel gears and Spiral bevel gears) and Geography (APAC, Europe, North America, Middle East and Africa, and South America)
-
-
Which regions are analyzed in the report?
-
APAC, Europe, North America, Middle East and Africa, and South America
-
-
What are the key growth drivers and market challenges?
-
Expansion of manufacturing facilities, Competition from alternatives
-
-
Who are the major players in the Bevel Gears Market?
-
AmTech International, Arrow Gear, B and R Machine and Gear Corp, Bevel Gears India Pvt Ltd, Bharat Gears Ltd., FA.TA. Ricambi S.p.A., Gear Motions Inc., Gibbs Gears Precision Engineers Ltd, Gleason Corp., KLINGELNBERG GmbH, Kohara Gear Industry Co. Ltd., Martin Sprocket and Gear Inc., Nippon Gear Co Ltd., Renold Plc, Richconn Technoloy Co Ltd, WM Berg Inc., and ZF Friedrichshafen AG
-
Market Research Insights
- The market for bevel gears is a dynamic and ever-evolving entity in the realm of mechanical engineering. Two distinct yet interconnected aspects of this market are worth noting. First, the demand for bevel gears in various industries continues to grow, with an estimated 15% of all gears produced being bevel gears. Second, advancements in technology have led to improvements in manufacturing processes, such as robotic machining and process simulation tools, which have increased production efficiency by up to 20%. These advancements have also enabled the integration of automation systems and design for manufacturing strategies, further streamlining the production process.
- Additionally, the industry anticipates a growth rate of around 5% annually over the next decade, driven by the increasing adoption of bevel gears in industries like automotive, aerospace, and renewable energy.
We can help! Our analysts can customize this bevel gears market research report to meet your requirements.
 RIA -
RIA - 
