Biometric Access Control Systems Market Size 2025-2029
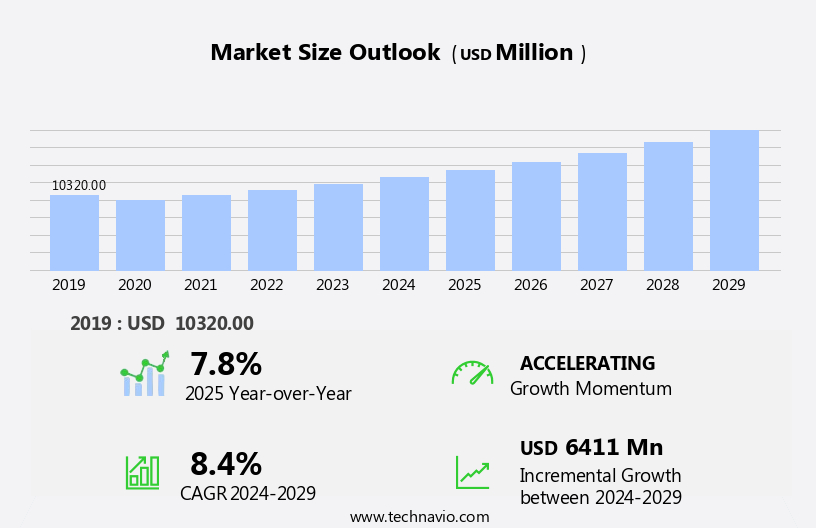
The biometric access control systems market size is forecast to increase by USD 6.41 billion at a CAGR of 8.4% between 2024 and 2029.
- The market is driven by the increasing need for advanced surveillance and security measures in various sectors, including corporate offices, healthcare facilities, and educational institutions. This demand is fueled by the desire to enhance security and streamline access control processes, leading to significant market growth. Machine learning, artificial intelligence (AI), and deep learning enhance security and user experience (UX). However, high installation and maintenance costs associated with biometric access control systems pose a significant challenge for market expansion.
- Companies must navigate these costs to effectively compete and capitalize on the market's potential. To remain competitive, organizations must explore cost-effective solutions, such as cloud-based systems, and focus on providing value-added services to offset the initial investment. The market's continuous dynamism is reflected in the evolving patterns of integration platforms and the adoption of cloud security solutions. By addressing these challenges and leveraging the latest technologies, market players can seize opportunities and thrive in the evolving biometric access control systems landscape.
What will be the Size of the Biometric Access Control Systems Market during the forecast period?
Explore in-depth regional segment analysis with market size data - historical 2019-2023 and forecasts 2025-2029 - in the full report.
Request Free Sample
The market is experiencing significant growth, driven by the increasing demand for advanced security solutions. Access control policies are becoming more complex, leading to the adoption of multi-factor authentication systems, including proximity readers and biometric readers. Privacy policies are a top concern, with vulnerability management and penetration testing playing crucial roles in mitigating risks. Encryption algorithms, directory services, and disaster recovery plans are essential components of robust security frameworks. Two-factor authentication and authorization servers enhance security by adding an extra layer of protection. Data masking, incident response, and user provisioning are essential for maintaining data privacy and ensuring regulatory compliance. Access control panels, business continuity, and password management are critical for maintaining smooth operations.
Blockchain technology, smart cards, and identity providers offer new possibilities for secure access control. Biometric keypads and authentication servers provide added convenience and security. Compliance frameworks, such as HIPAA and PCI-DSS, continue to shape the market. Cost is a critical consideration when selecting a biometric recognition system, such as multi-factor authentication or multimodal biometric systems. Security policies and audits are essential for maintaining the integrity of access control systems. Service providers play a vital role in implementing and managing these complex systems, offering expertise in areas such as encryption, incident response, and user de-provisioning. Overall, the market is dynamic and evolving, with a focus on advanced security solutions and regulatory compliance.
How is this Biometric Access Control Systems Industry segmented?
The biometric access control systems industry research report provides comprehensive data (region-wise segment analysis), with forecasts and estimates in "USD million" for the period 2025-2029, as well as historical data from 2019-2023 for the following segments.
- Application
- Commercial
- Residential
- End-user
- Government and defence
- Manufacturing
- BFSI
- Transportation
- Others
- Technology
- Fingerprint recognition
- Facial recognition
- Iris recognition
- Voice recognition
- Palm vein recognition
- Mobility Type
- Fixed
- Portable
- Geography
- North America
- US
- Canada
- Europe
- France
- Germany
- Italy
- UK
- APAC
- China
- India
- Japan
- South Korea
- Rest of World (ROW)
- North America
By Application Insights
The Commercial segment is estimated to witness significant growth during the forecast period. Biometric access control systems have become an integral part of modern security infrastructure, offering enhanced security and convenience. These systems use various biometric sensors, such as fingerprint, facial recognition, iris scanning, and voice recognition, for user authentication. The user interface is designed to be intuitive and user-friendly, ensuring a seamless experience for authorized personnel. Liveness detection technology is employed to prevent unauthorized access through fake biometric data. Database management and data encryption ensure the security of user information, while multi-factor authentication adds an additional layer of security. Hardware components, including optical sensors and image sensors, are essential for biometric data capture.
Cloud security and API integrations enable remote access and management of these systems. Machine learning algorithms and artificial intelligence are used for spoof detection and behavioral biometrics, enhancing system accuracy and efficiency. Physical and logical access control systems are integrated, allowing for comprehensive security solutions. Access control systems are designed to be scalable, catering to the varying needs of commercial facilities in terms of the number of users and access points. Biometric verification ensures that only authorized personnel can access secure areas, such as server rooms, data centers, and confidential file storage rooms. Regulatory compliance and data privacy are prioritized, with template protection and template storage ensuring the security of biometric data.
System integration and network security are crucial components of these systems, ensuring seamless integration with existing infrastructure and protection against cyber threats.
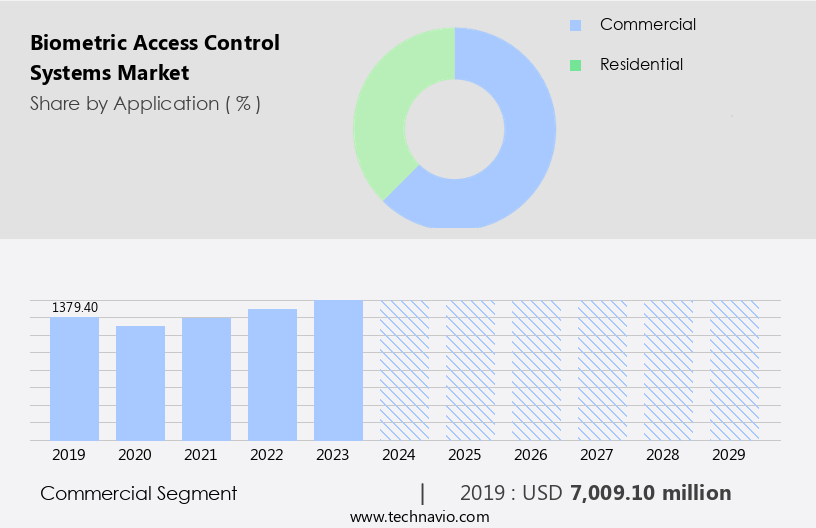
The Commercial segment was valued at USD 7.01 billion in 2019 and showed a gradual increase during the forecast period.
Regional Analysis
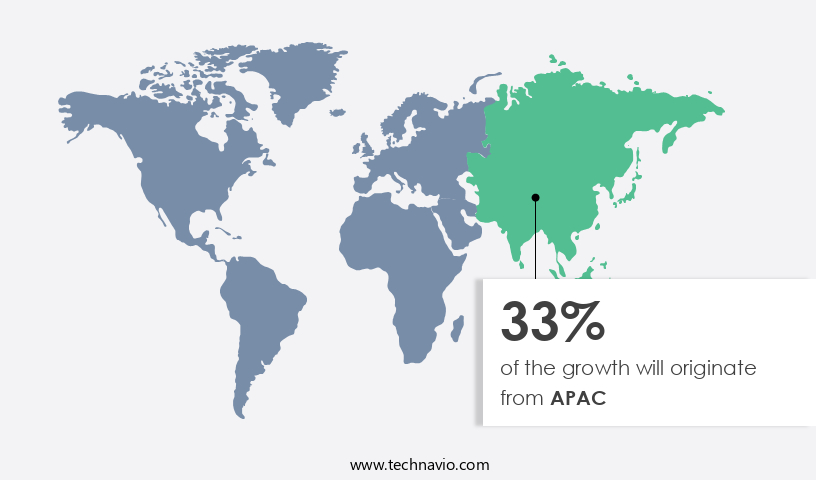
APAC is estimated to contribute 33% to the growth of the global market during the forecast period. Technavio's analysts have elaborately explained the regional trends and drivers that shape the market during the forecast period.
The market is experiencing significant growth, with North America leading the way in 2024. Key countries such as Canada, Mexico, and the US contribute substantially to the regional market due to heightened security and surveillance demands in sectors like BFSI, transportation, and healthcare. The threat of terrorist attacks and increasing instances of cyberattacks and data theft are major drivers. Biometric enrollment and verification through optical sensors and fingerprint scanning are integral components, ensuring a secure user interface (UI) and multi-factor authentication. Hardware components, including database management and data encryption, protect sensitive information. Another key trend shaping the market is the emergence of cloud-based biometric systems, which offer flexibility, scalability, and cost savings.
Iris scanning, facial recognition, and voice recognition add layers of authentication. Physical and logical access control systems integrate with API integrations and identity management for comprehensive security. Network security and system integration ensure regulatory compliance and data privacy. Behavioral biometrics and spoof detection prevent unauthorized access. Access control systems employ authorization protocols, biometric matching algorithms, and user experience (UX) considerations for seamless and secure access. Cloud security and integration platforms further strengthen the market's growth trajectory.
Market Dynamics
Our researchers analyzed the data with 2024 as the base year, along with the key drivers, trends, and challenges. A holistic analysis of drivers will help companies refine their marketing strategies to gain a competitive advantage.
What are the Biometric Access Control Systems market drivers leading to the rise in the adoption of Industry?
- The escalating demand for enhanced surveillance and security measures serves as the primary market catalyst. Biometric access control systems are gaining significant traction in various sectors due to the increasing need for robust security. These systems employ unique biological characteristics, such as iris scanning and fingerprint scanning, for identity management and authentication. The integration of APIs and advanced authentication protocols enhances network security, making it difficult for unauthorized access.
- The technology is also being adopted in the retail sector to secure point-of-sale transactions and prevent fraud. The market is expected to continue its growth trajectory due to the increasing demand for advanced security solutions. The market is driven by the growing demand for advanced security measures in the financial, government, transportation, healthcare, and defense sectors. With the rise in cybercrimes and hacking attempts, there is a pressing need to secure confidential data and information.
What are the Biometric Access Control Systems market trends shaping the Industry?
- Cloud-based biometric systems are gaining increasing popularity in the market, representing a significant trend in this industry. These systems enable organizations to store and manage biometric data through the cloud, offering advantages such as enhanced security, scalability, and cost efficiency. Biometric access control systems have been increasingly adopted by organizations for enhanced security and convenience. Cloud-based biometric systems, in particular, are gaining traction due to their cost savings, flexibility, and scalability. These systems enable the storage and processing of biometric data on cloud servers, providing access to biometric authentication services from anywhere, at any time. Additionally, advanced biometric matching algorithms, such as facial recognition and deep learning, ensure accurate and reliable authentication.
- Cloud-based biometric systems also prioritize user experience (UX). Moreover, data security is a top priority for these systems, with regulatory compliance and infrared sensors ensuring the protection of biometric data. Integration with other systems, such as access control and identity management platforms, is also a significant advantage of cloud-based biometric systems. These systems offer a cost-effective solution for organizations looking to implement biometric access control while maintaining data security and regulatory compliance. One of the key advantages of cloud-based biometric systems is data privacy. Template storage is securely managed by the service provider, ensuring that sensitive biometric information is not stored on local servers, reducing the risk of data breaches.
How does Biometric Access Control Systems market face challenges during its growth?
- The escalating installation and maintenance expenses associated with biometric access control systems represent a significant challenge to the industry's growth trajectory. Biometric access control systems have gained traction among various industries, particularly in sectors with high security requirements, such as banking, financial services, and insurance (BSFI), and healthcare. However, the implementation and maintenance of these systems come with substantial costs, making them a significant investment compared to traditional authentication methods like passwords and personal identification numbers (PINs). Biometric enrollment, liveness detection, and user interface (UI) development are essential hardware components that add to the overall cost.
- Facial recognition, iris recognition, and retina scan systems are often used in high-security environments, such as nuclear plants or classified sites, which significantly increase the cost of implementation. Despite the initial investment, these systems offer enhanced security features, including liveness detection and multi-factor authentication, making them an attractive option for organizations seeking to bolster their security infrastructure. Biometric access control systems use various sensors, such as optical sensors for fingerprint recognition, to capture and analyze user data. Mobile biometrics, which includes fingerprint sensors on smartphones and tablets, have also gained popularity due to their convenience and cost-effectiveness. Regardless of the type of biometric system, it's essential to prioritize hardware components' quality and reliability to ensure accurate and consistent results.
Exclusive Customer Landscape
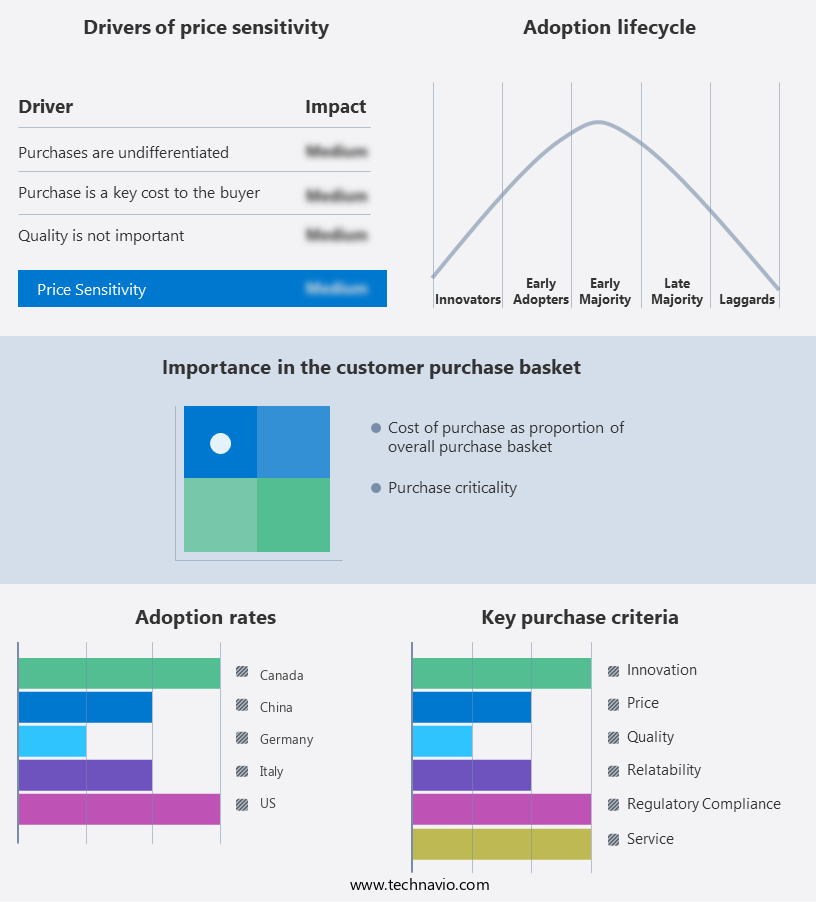
The biometric access control systems market forecasting report includes the adoption lifecycle of the market, covering from the innovator's stage to the laggard's stage. It focuses on adoption rates in different regions based on penetration. Furthermore, the biometric access control systems market report also includes key purchase criteria and drivers of price sensitivity to help companies evaluate and develop their market growth analysis strategies.
Customer Landscape
Key Companies & Market Insights
Companies are implementing various strategies, such as strategic alliances, biometric access control systems market forecast, partnerships, mergers and acquisitions, geographical expansion, and product/service launches, to enhance their presence in the industry.
3M Co. - This company specializes in biometric access control solutions, featuring the miY touch indoor touch screen biometric access control reader.
The industry research and growth report includes detailed analyses of the competitive landscape of the market and information about key companies, including:
- 3M Co.
- ACCO Brands Corp.
- Anviz Global Inc.
- Fujitsu Ltd.
- Godrej and Boyce Manufacturing Co. Ltd.
- HID Global Corp.
- Hitachi Ltd.
- Honeywell International Inc.
- Invixium
- Johnson Controls International Plc
- M2SYS
- Mantra Softech India Pvt. Ltd.
- NEC Corp.
- Nedap NV
- Robert Bosch GmbH
- Safran SA
- Spectra Technovision Pvt. Ltd.
- Star Alliance
- Umbrella Technologies
Qualitative and quantitative analysis of companies has been conducted to help clients understand the wider business environment as well as the strengths and weaknesses of key industry players. Data is qualitatively analyzed to categorize companies as pure play, category-focused, industry-focused, and diversified; it is quantitatively analyzed to categorize companies as dominant, leading, strong, tentative, and weak.
Recent Development and News in Biometric Access Control Systems Market
- In January 2024, Safran Identity & Security, a leading biometric solutions provider, announced the launch of MorphoWave Compact, a contactless, multi-biometric access control system. This new product uses facial, fingerprint, and contactless smart card recognition, offering enhanced security and convenience (Safran Identity & Security press release).
- In March 2024, HID Global, a renowned identity technology company, partnered with Microsoft to integrate HID's biometric access control solutions with Microsoft Azure Active Directory. This collaboration aims to provide a more secure and seamless user experience for enterprises (HID Global press release).
- In May 2024, IDEMIA, a global leader in identity and security, acquired the biometric division of Sagem Securite from Safran. This acquisition significantly strengthened IDEMIA's position in the biometric access control market (IDEMIA press release).
- In April 2025, the Indian government announced the 'Digital India Biometric Mission' to digitize and streamline various public services using biometric access control systems. This initiative aims to improve efficiency and reduce fraud in government services (Press Information Bureau, India, press release).
Research Analyst Overview
The market continues to evolve, driven by advancements in technology and the expanding application across various sectors. These systems employ hardware components such as optical and infrared sensors, biometric sensors, and image sensors, to capture and analyze user data for identification and authentication purposes. The market's dynamics are shaped by the ongoing development of biometric matching algorithms, template protection, and spoof detection techniques. Facial recognition, deep learning, and voice recognition are increasingly being integrated into biometric access control systems, enhancing user experience (UX) and improving accuracy. Data security is a paramount concern, with data encryption, database management, and regulatory compliance playing crucial roles in ensuring data privacy.
Multi-factor authentication, single sign-on (SSO), and API integrations facilitate seamless system integration and identity management. Biometric verification and authorization protocols provide an additional layer of security, while machine learning and artificial intelligence (AI) enable continuous learning and adaptability. Biometric access control systems are not limited to physical access control but also extend to logical access control and network security. The future of biometric access control systems lies in the seamless integration of these technologies and the prioritization of user experience and data privacy.
Moreover, database management, data encryption, and authorization protocols are additional expenses that come with implementing biometric systems. While biometric access control systems offer robust security benefits, their implementation and maintenance costs can be a barrier to entry for some organizations. However, the growing demand for enhanced security measures and the advancements in biometric technology are expected to drive the market's growth. Organizations must carefully evaluate their security needs and budgets to determine whether the investment in biometric access control systems is worthwhile.
Dive into Technavio's robust research methodology, blending expert interviews, extensive data synthesis, and validated models for unparalleled Biometric Access Control Systems Market insights. See full methodology.
|
Market Scope |
|
|
Report Coverage |
Details |
|
Page number |
251 |
|
Base year |
2024 |
|
Historic period |
2019-2023 |
|
Forecast period |
2025-2029 |
|
Growth momentum & CAGR |
Accelerate at a CAGR of 8.4% |
|
Market growth 2025-2029 |
USD 6.41 billion |
|
Market structure |
Fragmented |
|
YoY growth 2024-2025(%) |
7.8 |
|
Key countries |
US, China, UK, India, Canada, Germany, France, Japan, Italy, and South Korea |
|
Competitive landscape |
Leading Companies, Market Positioning of Companies, Competitive Strategies, and Industry Risks |
What are the Key Data Covered in this Biometric Access Control Systems Market Research and Growth Report?
- CAGR of the Biometric Access Control Systems industry during the forecast period
- Detailed information on factors that will drive the growth and forecasting between 2025 and 2029
- Precise estimation of the size of the market and its contribution of the industry in focus to the parent market
- Accurate predictions about upcoming growth and trends and changes in consumer behaviour
- Growth of the market across North America, Europe, APAC, Middle East and Africa, and South America
- Thorough analysis of the market's competitive landscape and detailed information about companies
- Comprehensive analysis of factors that will challenge the biometric access control systems market growth of industry companies
We can help! Our analysts can customize this biometric access control systems market research report to meet your requirements.
 RIA -
RIA - 
