Biometric POS Terminals Market Analysis, Size, and Forecast 2026-2030: North America (US, Canada, and Mexico), Europe (Germany, UK, and France), APAC (China, India, and Japan), Middle East and Africa (UAE, Saudi Arabia, and South Africa), South America (Brazil, Argentina, and Colombia), and Rest of World (ROW)

Biometric POS Terminals Market Analysis, Size, and Forecast 2026-2030:
North America (US, Canada, and Mexico), Europe (Germany, UK, and France), APAC (China, India, and Japan), Middle East and Africa (UAE, Saudi Arabia, and South Africa), South America (Brazil, Argentina, and Colombia), and Rest of World (ROW)

Published: Apr 2026 313 Pages SKU: IRTNTR45317

Market Overview at a Glance

$22.60 B
Market Opportunity
23.9%
CAGR 2025 - 2030
36.5%
North America Growth
$4.25 B
Retail segment 2024

Biometric POS Terminals Market Size 2026-2030

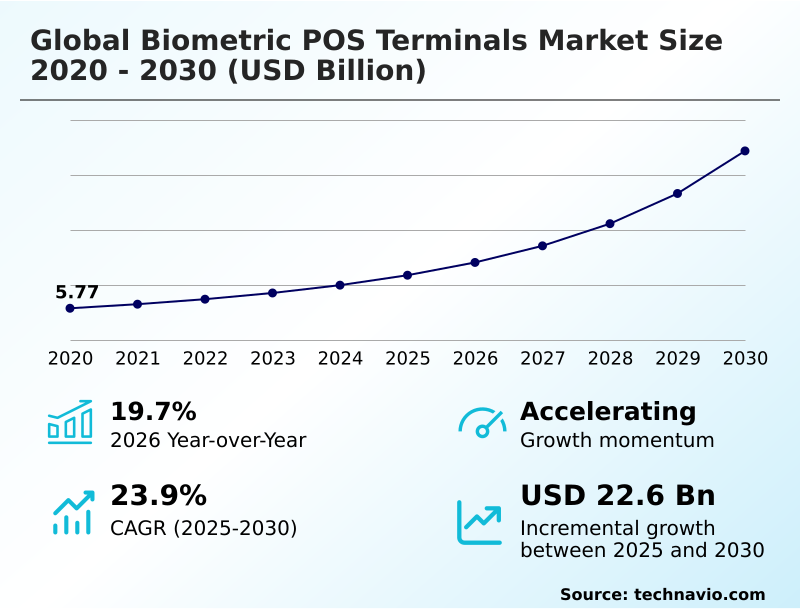
The biometric pos terminals market size is valued to increase by USD 22.60 billion, at a CAGR of 23.9% from 2025 to 2030. Escalating demand for enhanced transaction security and fraud mitigation will drive the biometric pos terminals market.

Major Market Trends & Insights

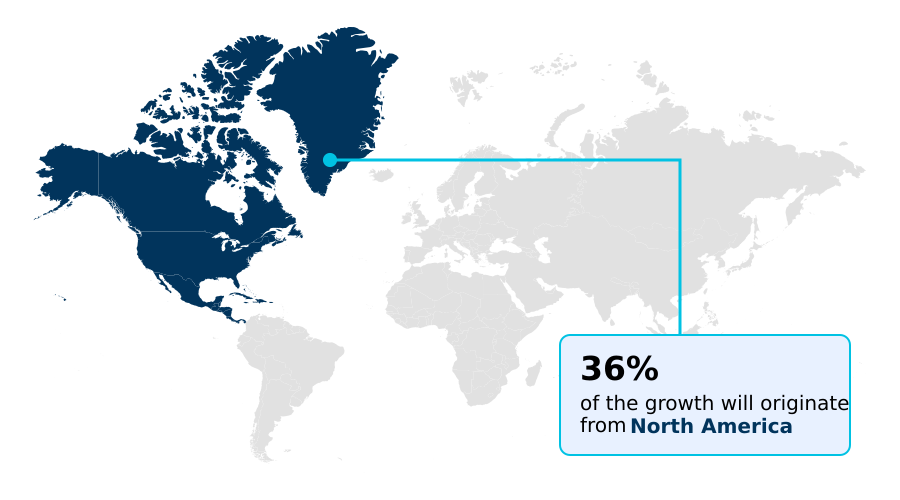
  • North America dominated the market and accounted for a 36.5% growth during the forecast period.
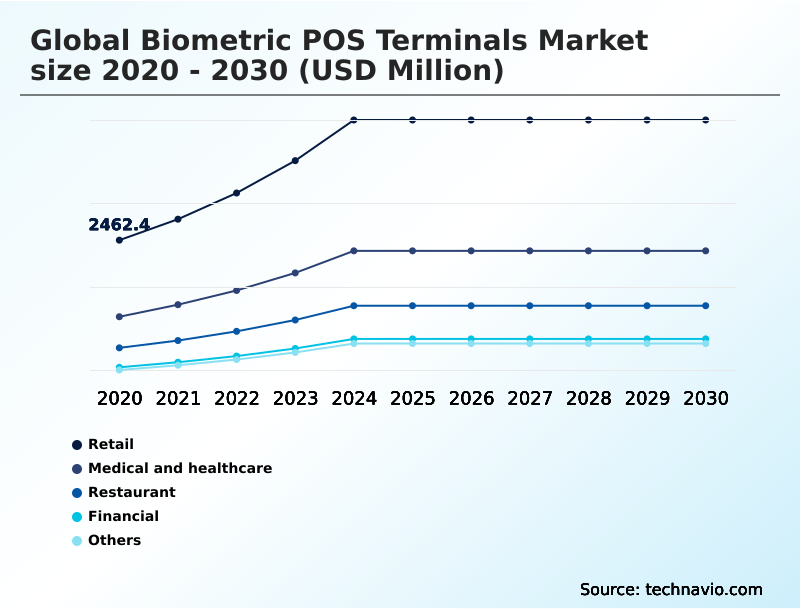
  • By End-user - Retail segment was valued at USD 4.25 billion in 2024
  • By Technology - Fingerprint identification segment accounted for the largest market revenue share in 2024

Market Size & Forecast

  • Market Opportunities: USD 28.61 billion
  • Market Future Opportunities: USD 22.60 billion
  • CAGR from 2025 to 2030 : 23.9%

Market Summary

  • The biometric pos terminals market revolves around specialized electronic hardware integrating biological authentication for secure financial transactions. Unlike traditional systems reliant on PINs or cards, these terminals use physiological traits like fingerprints, palm vein patterns, and facial features to authorize payments, using technologies like fingerprint identification.
  • The process involves capturing a live biometric sample via high-resolution sensors, converting it into an encrypted template, and matching it against a secure database or an on-device secure element. Key applications span retail, hospitality, healthcare, and finance, where terminals facilitate secure checkouts, digital kyc verification, and fraud-proof subsidy distribution.
  • The industry is driven by the need to eliminate card-present fraud while providing a frictionless, contactless consumer experience. For instance, in a high-volume retail environment, this technology not only secures transactions but also integrates with loyalty programs for instant customer recognition, streamlining the checkout process and enhancing operational efficiency without requiring customers to present physical credentials.
  • This evolution toward inherence-based authentication is fundamental to building trust in modern physical commerce.

What will be the Size of the Biometric POS Terminals Market during the forecast period?

Get Key Insights on Market Forecast (PDF) Request Free Sample

How is the Biometric POS Terminals Market Segmented?

The biometric pos terminals industry research report provides comprehensive data (region-wise segment analysis), with forecasts and estimates in "USD million" for the period 2026-2030, as well as historical data from 2020-2024 for the following segments.

  • End-user
    • Retail
    • Medical and healthcare
    • Restaurant
    • Financial
    • Others
  • Technology
    • Fingerprint identification
    • Palm vein identification
    • Others
  • Type
    • Standalone POS terminals
    • Integrated POS terminals
  • Sector
    • Large enterprises
    • SMEs
  • Geography
    • North America
      • US
      • Canada
      • Mexico
    • Europe
      • Germany
      • UK
      • France
    • APAC
      • China
      • India
      • Japan
    • Middle East and Africa
      • UAE
      • Saudi Arabia
      • South Africa
    • South America
      • Brazil
      • Argentina
      • Colombia
    • Rest of World (ROW)

By End-user Insights

The retail segment is estimated to witness significant growth during the forecast period.

The retail segment is rapidly adopting advanced point-of-sale systems to enhance transaction security and streamline operations. Deployment of multimodal biometrics, combining methods like fingerprint identification and facial recognition, provides robust multi-factor authentication to combat sophisticated fraud mitigation challenges.

These systems incorporate advanced liveness detection to prevent spoofing attack vectors, ensuring legitimate identity verification for every contactless transaction. For high-value goods, some retailers are even exploring iris scan and palm vein recognition.

The integration of this technology with existing inventory and loyalty platforms is a key focus, with successful implementations reducing new device setup times by up to 30%, showcasing a clear path to improved operational efficiency and a more secure biometric authentication environment.

Request Free Sample

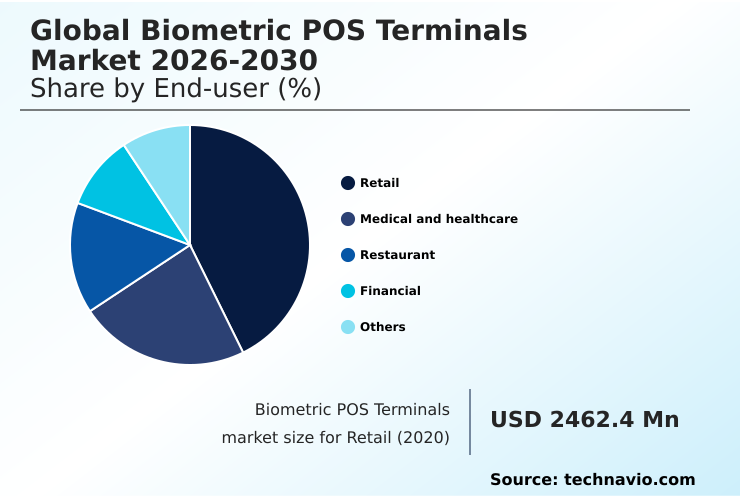
The Retail segment was valued at USD 4.25 billion in 2024 and showed a gradual increase during the forecast period.

Request Free Sample

Regional Analysis

North America is estimated to contribute 36.5% to the growth of the global market during the forecast period.Technavio’s analysts have elaborately explained the regional trends and drivers that shape the market during the forecast period.

See How Biometric POS Terminals Market Demand is Rising in North America Request Free Sample

The geographic landscape is diverse, with regional preferences shaping technology adoption.

In North America, which accounts for over 36% of incremental growth, a focus on preventing chargeback fraud drives the adoption of terminals with high-precision optical sensor and capacitive sensor technology.

European markets prioritize strict data localization and consent management protocols, aligning with data privacy regulations.

Meanwhile, APAC is a leader in large-scale biometric enrollment programs linked to national ID systems, with vascular pattern recognition gaining traction in markets like Japan for its high security.

In the Middle East, a push towards a digital economy is evident, with some nations targeting 70% of all retail transactions to be digital. These systems enhance customer recognition while adhering to regional requirements for data portability.
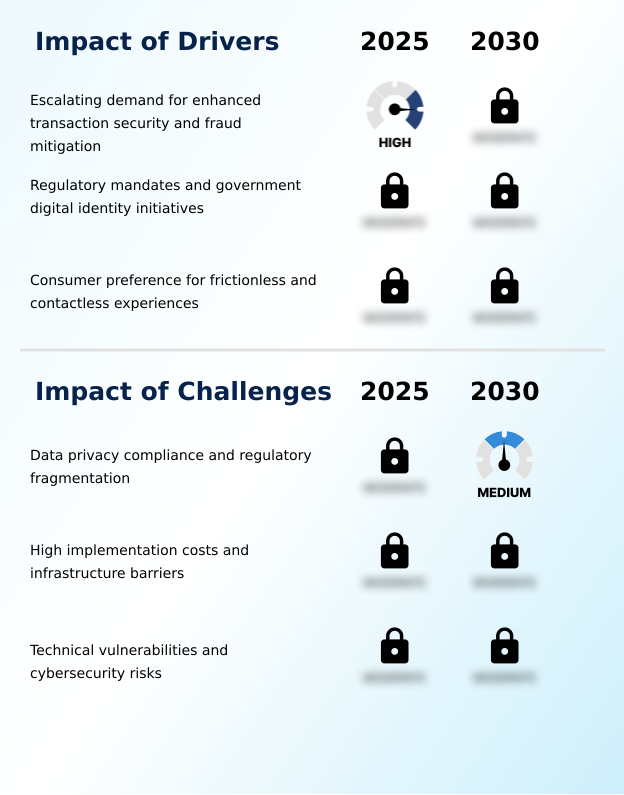
Market Dynamics

Our researchers analyzed the data with 2025 as the base year, along with the key drivers, trends, and challenges. A holistic analysis of drivers will help companies refine their marketing strategies to gain a competitive advantage.

  • The global biometric pos terminals market 2026-2030 for retail is driven by the need for improving checkout speed with biometrics and integrating biometrics with loyalty programs. In parallel, the global biometric pos terminals market 2026-2030 for banking focuses on high-security applications, where the fingerprint vs palm vein pos security debate is central.
  • For both sectors, multimodal biometrics for fraud prevention is a critical strategy. The technical foundation lies in advanced liveness detection in payment terminals and robust security protocols, including a secure element for biometric templates to guard against a spoofing attack on pos.
  • The rise of softpos biometric authentication solutions and android-based biometric pos platforms is making the technology more accessible, addressing the challenges of biometric pos terminals for smes adoption. A key concern remains privacy compliance for pos biometric data, along with the technical challenges of biometric data storage. Businesses must conduct a thorough cost-benefit analysis of biometric terminals before deployment.
  • The future of naked payments technology looks promising, especially with the impact of ai on biometric verification improving accuracy. Specific use cases are also driving growth, such as biometric pos in healthcare patient id and using biometric authentication for age verification.
  • Furthermore, the development of biometric hardware for digital currency is poised to create new opportunities, underscoring the technology's versatile and expanding role in secure commerce. In comparative deployments, systems integrating these advanced features have shown to reduce identity-related fraud incidents by a factor greater than those using single-factor methods.

What are the key market drivers leading to the rise in the adoption of Biometric POS Terminals Industry?

  • The escalating demand for enhanced transaction security and effective fraud mitigation propels the market's growth.

  • The drive for a stronger payment ecosystem and zero-trust security models is accelerating the adoption of biometric-enabled hardware. The need for high-assurance verification pushes merchant acquiring services to demand terminals that can thwart a presentation attack.
  • Innovations in on-device authentication, including the biometric smart card, are critical, as is efficient biometric data processing to maintain high user throughput.
  • Advanced systems boast a false acceptance rate that is orders of magnitude lower than legacy systems, while also minimizing the false rejection rate to avoid customer friction.
  • This evolution supports the growth of tokenless payment methods, with deployments in high-traffic retail environments reducing queue times by over 25% during peak hours.

What are the market trends shaping the Biometric POS Terminals Industry?

  • The convergence of multimodal biometrics and artificial intelligence is a prominent trend shaping the market. This involves a shift from single-factor biological verification to systems processing multiple identifiers simultaneously.

  • The market is experiencing a strategic shift towards naked payments, enabling a completely frictionless checkout experience where no physical card or device is needed. This trend is powered by softpos solutions and hardware featuring a powerful neural processing unit for high-speed processing.
  • To address data privacy compliance and cybersecurity risk, data is increasingly processed at the point of capture through edge computing. The biometric template is converted into an encrypted template and stored within a hardware secure element, aligning with sovereign digital identity principles where users control their digital personal data.
  • This on-device approach mitigates technical vulnerability and has been shown to reduce transaction processing times by nearly 40% in standardized networks.

What challenges does the Biometric POS Terminals Industry face during its growth?

  • Navigating complex data privacy compliance requirements and regulatory fragmentation presents a key challenge to industry growth.

  • Navigating regulatory fragmentation remains a primary market challenge, complicating pci dss compliance and emv certification for hardware used in cross-border payment scenarios. The integration with legacy systems requires complex backend system integration, and organizations must act as a responsible data fiduciary. On the technical front, threats from deepfake technology demand constant innovation in security algorithms.
  • Poor sensor accuracy can lead to authentication failures, negatively impacting user throughput and the customer experience. The high upfront cost is also a barrier, with unit costs often 2-3 times higher than standard terminals, creating a significant hurdle for SMEs seeking to adopt this technology for processes like digital kyc verification.

Exclusive Technavio Analysis on Customer Landscape

The biometric pos terminals market forecasting report includes the adoption lifecycle of the market, covering from the innovator’s stage to the laggard’s stage. It focuses on adoption rates in different regions based on penetration. Furthermore, the biometric pos terminals market report also includes key purchase criteria and drivers of price sensitivity to help companies evaluate and develop their market growth analysis strategies.

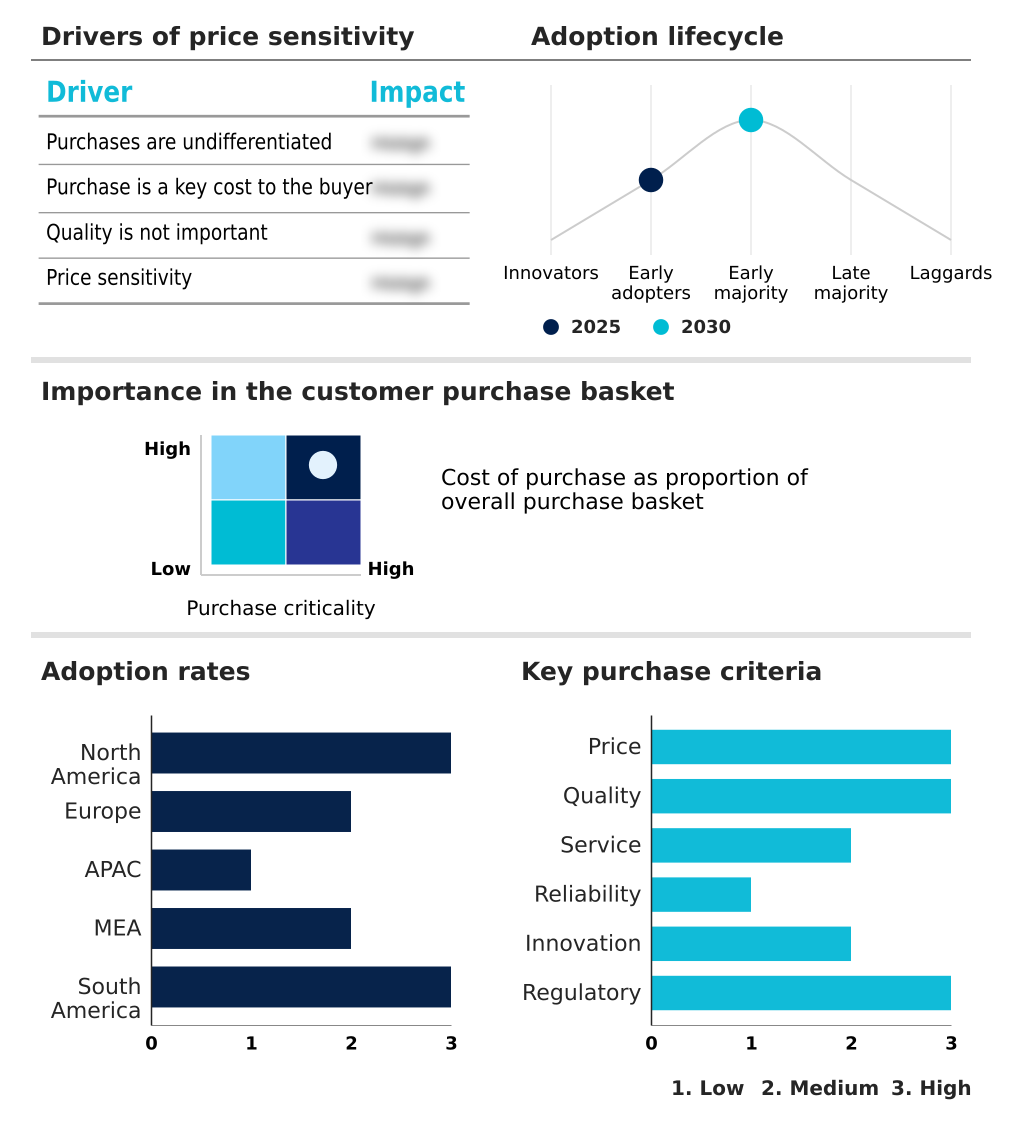
Customer Landscape of Biometric POS Terminals Industry

Competitive Landscape

Companies are implementing various strategies, such as strategic alliances, biometric pos terminals market forecast, partnerships, mergers and acquisitions, geographical expansion, and product/service launches, to enhance their presence in the industry.

Aratek Biometric - A biometric authentication platform facilitates secure payments and identity verification via fingerprint scanning, addressing modern security demands.

The industry research and growth report includes detailed analyses of the competitive landscape of the market and information about key companies, including:

  • Aratek Biometric
  • BioWallet Services Ltd.
  • Bitel
  • DERMALOG Systems GmbH
  • Diebold Nixdorf Incorp.
  • Fingo Ltd.
  • Fujitsu Ltd.
  • Giesecke Devrient GmbH
  • HID Global Corp.
  • IDEMIA France SAS
  • Ingenico Group SA
  • M2SYS Technology
  • NCR Voyix Corp.
  • NEC Corp.
  • SmartMetric Inc.
  • Thales Group
  • Toshiba Corp.
  • VeriFone Inc.
  • Worldline SA
  • Zebra Technologies Corp.

Qualitative and quantitative analysis of companies has been conducted to help clients understand the wider business environment as well as the strengths and weaknesses of key industry players. Data is qualitatively analyzed to categorize companies as pure play, category-focused, industry-focused, and diversified; it is quantitatively analyzed to categorize companies as dominant, leading, strong, tentative, and weak.

Recent Development and News in Biometric pos terminals market

  • In November, 2025, the Government of India operationalized its Digital Personal Data Protection Rules, establishing a comprehensive legal framework for managing biometric data with an 18-month compliance period.
  • In January, 2026, the Egyptian digital credit bureau i-score collaborated with international payment networks to create a new credit scoring model utilizing biometric transaction data to support digital lending.
  • In February, 2026, the Brazilian Central Bank launched a pilot program to integrate biometric palm scanning technology at retail points of sale to facilitate transactions with its digital currency, the Drex.
  • In April, 2026, the Reserve Bank of India implemented a revised authentication framework for digital payments, officially permitting the use of biometrics as an alternative to one-time passwords.

Dive into Technavio’s robust research methodology, blending expert interviews, extensive data synthesis, and validated models for unparalleled Biometric POS Terminals Market insights. See full methodology.

Market Scope
Page number 313
Base year 2025
Historic period 2020-2024
Forecast period 2026-2030
Growth momentum & CAGR Accelerate at a CAGR of 23.9%
Market growth 2026-2030 USD 22599.0 million
Market structure Fragmented
YoY growth 2025-2026(%) 19.7%
Key countries US, Canada, Mexico, Germany, UK, France, Italy, Spain, The Netherlands, China, India, Japan, South Korea, Australia, Indonesia, UAE, Saudi Arabia, South Africa, Egypt, Nigeria, Brazil, Argentina and Colombia
Competitive landscape Leading Companies, Market Positioning of Companies, Competitive Strategies, and Industry Risks

Request Free Sample

Research Analyst Overview

  • The market's evolution is defined by a move toward sophisticated hardware and intelligent software. Core technologies like fingerprint identification and palm vein recognition, often utilizing an optical sensor or ultrasonic sensor, are becoming standard. The industry is rapidly adopting multimodal biometrics to deliver a superior identity assurance level.
  • A critical boardroom consideration is the investment in systems with advanced liveness detection and anti-spoofing algorithm capabilities to counter threats from spoofing attack vectors, including presentation attack and deepfake technology. On-device processing via edge computing and a neural processing unit ensures that biometric data processing is swift and secure.
  • The biometric template is transformed into an encrypted template and stored in a secure element, a key feature for both a biometric smart card and terminal-based on-device authentication. This technical depth is essential for achieving pci dss compliance and emv certification.
  • The process, from biometric enrollment and template matching to digital kyc verification, supports the future of naked payments and softpos solutions. Deployments have demonstrated up to a 30% reduction in transaction processing times, reinforcing the business case for this technological shift. Vascular pattern recognition is an emerging area, while providers increasingly offer hardware-as-a-service models to lower adoption barriers.
  • This all contributes to minimizing the false rejection rate and false acceptance rate, enhancing both security and user experience.

What are the Key Data Covered in this Biometric POS Terminals Market Research and Growth Report?

  • What is the expected growth of the Biometric POS Terminals Market between 2026 and 2030?

    • USD 22.60 billion, at a CAGR of 23.9%

  • What segmentation does the market report cover?

    • The report is segmented by End-user (Retail, Medical and healthcare, Restaurant, Financial, and Others), Technology (Fingerprint identification, Palm vein identification, and Others), Type (Standalone POS terminals, and Integrated POS terminals), Sector (Large enterprises, and SMEs) and Geography (North America, Europe, APAC, Middle East and Africa, South America)

  • Which regions are analyzed in the report?

    • North America, Europe, APAC, Middle East and Africa and South America

  • What are the key growth drivers and market challenges?

    • Escalating demand for enhanced transaction security and fraud mitigation, Data privacy compliance and regulatory fragmentation

  • Who are the major players in the Biometric POS Terminals Market?

    • Aratek Biometric, BioWallet Services Ltd., Bitel, DERMALOG Systems GmbH, Diebold Nixdorf Incorp., Fingo Ltd., Fujitsu Ltd., Giesecke Devrient GmbH, HID Global Corp., IDEMIA France SAS, Ingenico Group SA, M2SYS Technology, NCR Voyix Corp., NEC Corp., SmartMetric Inc., Thales Group, Toshiba Corp., VeriFone Inc., Worldline SA and Zebra Technologies Corp.

Market Research Insights

  • Market dynamics are shaped by a confluence of security needs and consumer expectations. The push for enhanced transaction security and robust fraud mitigation is driving the adoption of biometric-enabled hardware capable of high-assurance verification. This aligns with a zero-trust security approach within the broader payment ecosystem.
  • Consumers increasingly demand contactless transaction methods that offer a frictionless checkout, leading to the rise of tokenless payment solutions. However, this evolution introduces challenges, including data privacy compliance and navigating regulatory fragmentation. Merchant acquiring firms and organizations acting as a data fiduciary must manage digital personal data through clear consent management, ensuring data portability and often data localization.
  • Success hinges on balancing cybersecurity risk and technical vulnerability with high user throughput, efficient backend system integration, and seamless identity verification for applications like age verification and customer recognition, ultimately reducing chargeback fraud and enabling secure cross-border payment and digital currency integration under a framework of sovereign digital identity.

We can help! Our analysts can customize this biometric pos terminals market research report to meet your requirements.

Get in touch

1. Executive Summary

1.1 Market overview

Executive Summary - Chart on Market Overview
Executive Summary - Data Table on Market Overview
Executive Summary - Chart on Global Market Characteristics
Executive Summary - Chart on Market by Geography
Executive Summary - Chart on Market Segmentation by End-user
Executive Summary - Chart on Market Segmentation by Technology
Executive Summary - Chart on Market Segmentation by Type
Executive Summary - Chart on Market Segmentation by Sector
Executive Summary - Chart on Incremental Growth
Executive Summary - Data Table on Incremental Growth
Executive Summary - Chart on Company Market Positioning

2. Technavio Analysis

2.1 Analysis of price sensitivity, lifecycle, customer purchase basket, adoption rates, and purchase criteria

2.2 Criticality of inputs and Factors of differentiation

Chart on Overview on criticality of inputs and factors of differentiation

2.3 Factors of disruption

Chart on Overview on factors of disruption

2.4 Impact of drivers and challenges

Chart on Impact of drivers and challenges in 2025 and 2030

3. Market Landscape

3.1 Market ecosystem

Chart on Parent Market
Data Table on - Parent Market

3.2 Market characteristics

Chart on Market characteristics analysis

3.3 Value chain analysis

Chart on Value chain analysis

4. Market Sizing

4.1 Market definition

Data Table on Offerings of companies included in the market definition

4.2 Market segment analysis

Market segments

4.3 Market size 2025

4.4 Market outlook: Forecast for 2025-2030

Chart on Global - Market size and forecast 2025-2030 ($ million)
Data Table on Global - Market size and forecast 2025-2030 ($ million)
Chart on Global Market: Year-over-year growth 2025-2030 (%)
Data Table on Global Market: Year-over-year growth 2025-2030 (%)

5. Historic Market Size

5.1 Global Biometric POS Terminals Market 2020 - 2024

Historic Market Size - Data Table on Global Biometric POS Terminals Market 2020 - 2024 ($ million)

5.2 End-user segment analysis 2020 - 2024

Historic Market Size - End-user Segment 2020 - 2024 ($ million)

5.3 Technology segment analysis 2020 - 2024

Historic Market Size - Technology Segment 2020 - 2024 ($ million)

5.4 Type segment analysis 2020 - 2024

Historic Market Size - Type Segment 2020 - 2024 ($ million)

5.5 Sector segment analysis 2020 - 2024

Historic Market Size - Sector Segment 2020 - 2024 ($ million)

5.6 Geography segment analysis 2020 - 2024

Historic Market Size - Geography Segment 2020 - 2024 ($ million)

5.7 Country segment analysis 2020 - 2024

Historic Market Size - Country Segment 2020 - 2024 ($ million)

6. Qualitative Analysis

6.1 Impact of AI on global biometric POS terminals market

6.2 Impact of geopolitical conflicts on global biometric POS terminals market

7. Five Forces Analysis

7.1 Five forces summary

Five forces analysis - Comparison between 2025 and 2030

7.2 Bargaining power of buyers

Bargaining power of buyers - Impact of key factors 2025 and 2030

7.3 Bargaining power of suppliers

Bargaining power of suppliers - Impact of key factors in 2025 and 2030

7.4 Threat of new entrants

Threat of new entrants - Impact of key factors in 2025 and 2030

7.5 Threat of substitutes

Threat of substitutes - Impact of key factors in 2025 and 2030

7.6 Threat of rivalry

Threat of rivalry - Impact of key factors in 2025 and 2030

7.7 Market condition

Chart on Market condition - Five forces 2025 and 2030

8. Market Segmentation by End-user

8.1 Market segments

Chart on End-user - Market share 2025-2030 (%)
Data Table on End-user - Market share 2025-2030 (%)

8.2 Comparison by End-user

Chart on Comparison by End-user
Data Table on Comparison by End-user

8.3 Retail - Market size and forecast 2025-2030

Chart on Retail - Market size and forecast 2025-2030 ($ million)
Data Table on Retail - Market size and forecast 2025-2030 ($ million)
Chart on Retail - Year-over-year growth 2025-2030 (%)
Data Table on Retail - Year-over-year growth 2025-2030 (%)

8.4 Medical and healthcare - Market size and forecast 2025-2030

Chart on Medical and healthcare - Market size and forecast 2025-2030 ($ million)
Data Table on Medical and healthcare - Market size and forecast 2025-2030 ($ million)
Chart on Medical and healthcare - Year-over-year growth 2025-2030 (%)
Data Table on Medical and healthcare - Year-over-year growth 2025-2030 (%)

8.5 Restaurant - Market size and forecast 2025-2030

Chart on Restaurant - Market size and forecast 2025-2030 ($ million)
Data Table on Restaurant - Market size and forecast 2025-2030 ($ million)
Chart on Restaurant - Year-over-year growth 2025-2030 (%)
Data Table on Restaurant - Year-over-year growth 2025-2030 (%)

8.6 Financial - Market size and forecast 2025-2030

Chart on Financial - Market size and forecast 2025-2030 ($ million)
Data Table on Financial - Market size and forecast 2025-2030 ($ million)
Chart on Financial - Year-over-year growth 2025-2030 (%)
Data Table on Financial - Year-over-year growth 2025-2030 (%)

8.7 Others - Market size and forecast 2025-2030

Chart on Others - Market size and forecast 2025-2030 ($ million)
Data Table on Others - Market size and forecast 2025-2030 ($ million)
Chart on Others - Year-over-year growth 2025-2030 (%)
Data Table on Others - Year-over-year growth 2025-2030 (%)

8.8 Market opportunity by End-user

Market opportunity by End-user ($ million)
Data Table on Market opportunity by End-user ($ million)

9. Market Segmentation by Technology

9.1 Market segments

Chart on Technology - Market share 2025-2030 (%)
Data Table on Technology - Market share 2025-2030 (%)

9.2 Comparison by Technology

Chart on Comparison by Technology
Data Table on Comparison by Technology

9.3 Fingerprint identification - Market size and forecast 2025-2030

Chart on Fingerprint identification - Market size and forecast 2025-2030 ($ million)
Data Table on Fingerprint identification - Market size and forecast 2025-2030 ($ million)
Chart on Fingerprint identification - Year-over-year growth 2025-2030 (%)
Data Table on Fingerprint identification - Year-over-year growth 2025-2030 (%)

9.4 Palm vein identification - Market size and forecast 2025-2030

Chart on Palm vein identification - Market size and forecast 2025-2030 ($ million)
Data Table on Palm vein identification - Market size and forecast 2025-2030 ($ million)
Chart on Palm vein identification - Year-over-year growth 2025-2030 (%)
Data Table on Palm vein identification - Year-over-year growth 2025-2030 (%)

9.5 Others - Market size and forecast 2025-2030

Chart on Others - Market size and forecast 2025-2030 ($ million)
Data Table on Others - Market size and forecast 2025-2030 ($ million)
Chart on Others - Year-over-year growth 2025-2030 (%)
Data Table on Others - Year-over-year growth 2025-2030 (%)

9.6 Market opportunity by Technology

Market opportunity by Technology ($ million)
Data Table on Market opportunity by Technology ($ million)

10. Market Segmentation by Type

10.1 Market segments

Chart on Type - Market share 2025-2030 (%)
Data Table on Type - Market share 2025-2030 (%)

10.2 Comparison by Type

Chart on Comparison by Type
Data Table on Comparison by Type

10.3 Standalone POS terminals - Market size and forecast 2025-2030

Chart on Standalone POS terminals - Market size and forecast 2025-2030 ($ million)
Data Table on Standalone POS terminals - Market size and forecast 2025-2030 ($ million)
Chart on Standalone POS terminals - Year-over-year growth 2025-2030 (%)
Data Table on Standalone POS terminals - Year-over-year growth 2025-2030 (%)

10.4 Integrated POS terminals - Market size and forecast 2025-2030

Chart on Integrated POS terminals - Market size and forecast 2025-2030 ($ million)
Data Table on Integrated POS terminals - Market size and forecast 2025-2030 ($ million)
Chart on Integrated POS terminals - Year-over-year growth 2025-2030 (%)
Data Table on Integrated POS terminals - Year-over-year growth 2025-2030 (%)

10.5 Market opportunity by Type

Market opportunity by Type ($ million)
Data Table on Market opportunity by Type ($ million)

11. Market Segmentation by Sector

11.1 Market segments

Chart on Sector - Market share 2025-2030 (%)
Data Table on Sector - Market share 2025-2030 (%)

11.2 Comparison by Sector

Chart on Comparison by Sector
Data Table on Comparison by Sector

11.3 Large enterprises - Market size and forecast 2025-2030

Chart on Large enterprises - Market size and forecast 2025-2030 ($ million)
Data Table on Large enterprises - Market size and forecast 2025-2030 ($ million)
Chart on Large enterprises - Year-over-year growth 2025-2030 (%)
Data Table on Large enterprises - Year-over-year growth 2025-2030 (%)

11.4 SMEs - Market size and forecast 2025-2030

Chart on SMEs - Market size and forecast 2025-2030 ($ million)
Data Table on SMEs - Market size and forecast 2025-2030 ($ million)
Chart on SMEs - Year-over-year growth 2025-2030 (%)
Data Table on SMEs - Year-over-year growth 2025-2030 (%)

11.5 Market opportunity by Sector

Market opportunity by Sector ($ million)
Data Table on Market opportunity by Sector ($ million)

12. Customer Landscape

12.1 Customer landscape overview

Analysis of price sensitivity, lifecycle, customer purchase basket, adoption rates, and purchase criteria

13. Geographic Landscape

13.1 Geographic segmentation

Chart on Market share by geography 2025-2030 (%)
Data Table on Market share by geography 2025-2030 (%)

13.2 Geographic comparison

Chart on Geographic comparison
Data Table on Geographic comparison

13.3 North America - Market size and forecast 2025-2030

Chart on North America - Market size and forecast 2025-2030 ($ million)
Data Table on North America - Market size and forecast 2025-2030 ($ million)
Chart on North America - Year-over-year growth 2025-2030 (%)
Data Table on North America - Year-over-year growth 2025-2030 (%)
Chart on Regional Comparison - North America
Data Table on Regional Comparison - North America

13.3.1 US - Market size and forecast 2025-2030

Chart on US - Market size and forecast 2025-2030 ($ million)
Data Table on US - Market size and forecast 2025-2030 ($ million)
Chart on US - Year-over-year growth 2025-2030 (%)
Data Table on US - Year-over-year growth 2025-2030 (%)

13.3.2 Canada - Market size and forecast 2025-2030

Chart on Canada - Market size and forecast 2025-2030 ($ million)
Data Table on Canada - Market size and forecast 2025-2030 ($ million)
Chart on Canada - Year-over-year growth 2025-2030 (%)
Data Table on Canada - Year-over-year growth 2025-2030 (%)

13.3.3 Mexico - Market size and forecast 2025-2030

Chart on Mexico - Market size and forecast 2025-2030 ($ million)
Data Table on Mexico - Market size and forecast 2025-2030 ($ million)
Chart on Mexico - Year-over-year growth 2025-2030 (%)
Data Table on Mexico - Year-over-year growth 2025-2030 (%)

13.4 Europe - Market size and forecast 2025-2030

Chart on Europe - Market size and forecast 2025-2030 ($ million)
Data Table on Europe - Market size and forecast 2025-2030 ($ million)
Chart on Europe - Year-over-year growth 2025-2030 (%)
Data Table on Europe - Year-over-year growth 2025-2030 (%)
Chart on Regional Comparison - Europe
Data Table on Regional Comparison - Europe

13.4.1 Germany - Market size and forecast 2025-2030

Chart on Germany - Market size and forecast 2025-2030 ($ million)
Data Table on Germany - Market size and forecast 2025-2030 ($ million)
Chart on Germany - Year-over-year growth 2025-2030 (%)
Data Table on Germany - Year-over-year growth 2025-2030 (%)

13.4.2 UK - Market size and forecast 2025-2030

Chart on UK - Market size and forecast 2025-2030 ($ million)
Data Table on UK - Market size and forecast 2025-2030 ($ million)
Chart on UK - Year-over-year growth 2025-2030 (%)
Data Table on UK - Year-over-year growth 2025-2030 (%)

13.4.3 France - Market size and forecast 2025-2030

Chart on France - Market size and forecast 2025-2030 ($ million)
Data Table on France - Market size and forecast 2025-2030 ($ million)
Chart on France - Year-over-year growth 2025-2030 (%)
Data Table on France - Year-over-year growth 2025-2030 (%)

13.4.4 Italy - Market size and forecast 2025-2030

Chart on Italy - Market size and forecast 2025-2030 ($ million)
Data Table on Italy - Market size and forecast 2025-2030 ($ million)
Chart on Italy - Year-over-year growth 2025-2030 (%)
Data Table on Italy - Year-over-year growth 2025-2030 (%)

13.4.5 Spain - Market size and forecast 2025-2030

Chart on Spain - Market size and forecast 2025-2030 ($ million)
Data Table on Spain - Market size and forecast 2025-2030 ($ million)
Chart on Spain - Year-over-year growth 2025-2030 (%)
Data Table on Spain - Year-over-year growth 2025-2030 (%)

13.4.6 The Netherlands - Market size and forecast 2025-2030

Chart on The Netherlands - Market size and forecast 2025-2030 ($ million)
Data Table on The Netherlands - Market size and forecast 2025-2030 ($ million)
Chart on The Netherlands - Year-over-year growth 2025-2030 (%)
Data Table on The Netherlands - Year-over-year growth 2025-2030 (%)

13.5 APAC - Market size and forecast 2025-2030

Chart on APAC - Market size and forecast 2025-2030 ($ million)
Data Table on APAC - Market size and forecast 2025-2030 ($ million)
Chart on APAC - Year-over-year growth 2025-2030 (%)
Data Table on APAC - Year-over-year growth 2025-2030 (%)
Chart on Regional Comparison - APAC
Data Table on Regional Comparison - APAC

13.5.1 China - Market size and forecast 2025-2030

Chart on China - Market size and forecast 2025-2030 ($ million)
Data Table on China - Market size and forecast 2025-2030 ($ million)
Chart on China - Year-over-year growth 2025-2030 (%)
Data Table on China - Year-over-year growth 2025-2030 (%)

13.5.2 India - Market size and forecast 2025-2030

Chart on India - Market size and forecast 2025-2030 ($ million)
Data Table on India - Market size and forecast 2025-2030 ($ million)
Chart on India - Year-over-year growth 2025-2030 (%)
Data Table on India - Year-over-year growth 2025-2030 (%)

13.5.3 Japan - Market size and forecast 2025-2030

Chart on Japan - Market size and forecast 2025-2030 ($ million)
Data Table on Japan - Market size and forecast 2025-2030 ($ million)
Chart on Japan - Year-over-year growth 2025-2030 (%)
Data Table on Japan - Year-over-year growth 2025-2030 (%)

13.5.4 South Korea - Market size and forecast 2025-2030

Chart on South Korea - Market size and forecast 2025-2030 ($ million)
Data Table on South Korea - Market size and forecast 2025-2030 ($ million)
Chart on South Korea - Year-over-year growth 2025-2030 (%)
Data Table on South Korea - Year-over-year growth 2025-2030 (%)

13.5.5 Australia - Market size and forecast 2025-2030

Chart on Australia - Market size and forecast 2025-2030 ($ million)
Data Table on Australia - Market size and forecast 2025-2030 ($ million)
Chart on Australia - Year-over-year growth 2025-2030 (%)
Data Table on Australia - Year-over-year growth 2025-2030 (%)

13.5.6 Indonesia - Market size and forecast 2025-2030

Chart on Indonesia - Market size and forecast 2025-2030 ($ million)
Data Table on Indonesia - Market size and forecast 2025-2030 ($ million)
Chart on Indonesia - Year-over-year growth 2025-2030 (%)
Data Table on Indonesia - Year-over-year growth 2025-2030 (%)

13.6 Middle East and Africa - Market size and forecast 2025-2030

Chart on Middle East and Africa - Market size and forecast 2025-2030 ($ million)
Data Table on Middle East and Africa - Market size and forecast 2025-2030 ($ million)
Chart on Middle East and Africa - Year-over-year growth 2025-2030 (%)
Data Table on Middle East and Africa - Year-over-year growth 2025-2030 (%)
Chart on Regional Comparison - Middle East and Africa
Data Table on Regional Comparison - Middle East and Africa

13.6.1 UAE - Market size and forecast 2025-2030

Chart on UAE - Market size and forecast 2025-2030 ($ million)
Data Table on UAE - Market size and forecast 2025-2030 ($ million)
Chart on UAE - Year-over-year growth 2025-2030 (%)
Data Table on UAE - Year-over-year growth 2025-2030 (%)

13.6.2 Saudi Arabia - Market size and forecast 2025-2030

Chart on Saudi Arabia - Market size and forecast 2025-2030 ($ million)
Data Table on Saudi Arabia - Market size and forecast 2025-2030 ($ million)
Chart on Saudi Arabia - Year-over-year growth 2025-2030 (%)
Data Table on Saudi Arabia - Year-over-year growth 2025-2030 (%)

13.6.3 South Africa - Market size and forecast 2025-2030

Chart on South Africa - Market size and forecast 2025-2030 ($ million)
Data Table on South Africa - Market size and forecast 2025-2030 ($ million)
Chart on South Africa - Year-over-year growth 2025-2030 (%)
Data Table on South Africa - Year-over-year growth 2025-2030 (%)

13.6.4 Egypt - Market size and forecast 2025-2030

Chart on Egypt - Market size and forecast 2025-2030 ($ million)
Data Table on Egypt - Market size and forecast 2025-2030 ($ million)
Chart on Egypt - Year-over-year growth 2025-2030 (%)
Data Table on Egypt - Year-over-year growth 2025-2030 (%)

13.6.5 Nigeria - Market size and forecast 2025-2030

Chart on Nigeria - Market size and forecast 2025-2030 ($ million)
Data Table on Nigeria - Market size and forecast 2025-2030 ($ million)
Chart on Nigeria - Year-over-year growth 2025-2030 (%)
Data Table on Nigeria - Year-over-year growth 2025-2030 (%)

13.7 South America - Market size and forecast 2025-2030

Chart on South America - Market size and forecast 2025-2030 ($ million)
Data Table on South America - Market size and forecast 2025-2030 ($ million)
Chart on South America - Year-over-year growth 2025-2030 (%)
Data Table on South America - Year-over-year growth 2025-2030 (%)
Chart on Regional Comparison - South America
Data Table on Regional Comparison - South America

13.7.1 Brazil - Market size and forecast 2025-2030

Chart on Brazil - Market size and forecast 2025-2030 ($ million)
Data Table on Brazil - Market size and forecast 2025-2030 ($ million)
Chart on Brazil - Year-over-year growth 2025-2030 (%)
Data Table on Brazil - Year-over-year growth 2025-2030 (%)

13.7.2 Argentina - Market size and forecast 2025-2030

Chart on Argentina - Market size and forecast 2025-2030 ($ million)
Data Table on Argentina - Market size and forecast 2025-2030 ($ million)
Chart on Argentina - Year-over-year growth 2025-2030 (%)
Data Table on Argentina - Year-over-year growth 2025-2030 (%)

13.7.3 Colombia - Market size and forecast 2025-2030

Chart on Colombia - Market size and forecast 2025-2030 ($ million)
Data Table on Colombia - Market size and forecast 2025-2030 ($ million)
Chart on Colombia - Year-over-year growth 2025-2030 (%)
Data Table on Colombia - Year-over-year growth 2025-2030 (%)

13.8 Market opportunity by geography

Market opportunity by geography ($ million)
Data Tables on Market opportunity by geography ($ million)

14. Drivers, Challenges, and Opportunity

14.1 Market drivers

Escalating demand for enhanced transaction security and fraud mitigation
Regulatory mandates and government digital identity initiatives
Consumer preference for frictionless and contactless experiences

14.2 Market challenges

Data privacy compliance and regulatory fragmentation
High implementation costs and infrastructure barriers
Technical vulnerabilities and cybersecurity risks

14.3 Impact of drivers and challenges

Impact of drivers and challenges in 2025 and 2030

14.4 Market opportunities

Convergence of multimodal biometrics and AI
Proliferation of palm vein recognition and sovereign digital identity
Integration of SoftPOS and hybrid biometric hardware platforms

15. Competitive Landscape

15.1 Overview

15.2

Overview on criticality of inputs and factors of differentiation

15.3 Landscape disruption

Overview on factors of disruption

15.4 Industry risks

Impact of key risks on business

16. Competitive Analysis

16.1 Companies profiled

Companies covered

16.2 Company ranking index

16.3 Market positioning of companies

Matrix on companies position and classification

16.4 BioWallet Services Ltd.

BioWallet Services Ltd. - Overview
BioWallet Services Ltd. - Product / Service
BioWallet Services Ltd. - Key offerings
SWOT

16.5 Diebold Nixdorf Incorp.

Diebold Nixdorf Incorp. - Overview
Diebold Nixdorf Incorp. - Business segments
Diebold Nixdorf Incorp. - Key offerings
Diebold Nixdorf Incorp. - Segment focus
SWOT

16.6 Fingo Ltd.

Fingo Ltd. - Overview
Fingo Ltd. - Product / Service
Fingo Ltd. - Key offerings
SWOT

16.7 Fujitsu Ltd.

Fujitsu Ltd. - Overview
Fujitsu Ltd. - Business segments
Fujitsu Ltd. - Key offerings
Fujitsu Ltd. - Segment focus
SWOT

16.8 Giesecke Devrient GmbH

Giesecke Devrient GmbH - Overview
Giesecke Devrient GmbH - Product / Service
Giesecke Devrient GmbH - Key offerings
SWOT

16.9 HID Global Corp.

HID Global Corp. - Overview
HID Global Corp. - Product / Service
HID Global Corp. - Key offerings
SWOT

16.10 IDEMIA France SAS

IDEMIA France SAS - Overview
IDEMIA France SAS - Product / Service
IDEMIA France SAS - Key offerings
SWOT

16.11 Ingenico Group SA

Ingenico Group SA - Overview
Ingenico Group SA - Product / Service
Ingenico Group SA - Key offerings
SWOT

16.12 NCR Voyix Corp.

NCR Voyix Corp. - Overview
NCR Voyix Corp. - Business segments
NCR Voyix Corp. - Key offerings
NCR Voyix Corp. - Segment focus
SWOT

16.13 NEC Corp.

NEC Corp. - Overview
NEC Corp. - Business segments
NEC Corp. - Key offerings
NEC Corp. - Segment focus
SWOT

16.14 Thales Group

Thales Group - Overview
Thales Group - Business segments
Thales Group - Key offerings
Thales Group - Segment focus
SWOT

16.15 Toshiba Corp.

Toshiba Corp. - Overview
Toshiba Corp. - Product / Service
Toshiba Corp. - Key offerings
SWOT

16.16 VeriFone Inc.

VeriFone Inc. - Overview
VeriFone Inc. - Product / Service
VeriFone Inc. - Key offerings
SWOT

16.17 Worldline SA

Worldline SA - Overview
Worldline SA - Business segments
Worldline SA - Key offerings
Worldline SA - Segment focus
SWOT

16.18 Zebra Technologies Corp.

Zebra Technologies Corp. - Overview
Zebra Technologies Corp. - Business segments
Zebra Technologies Corp. - Key news
Zebra Technologies Corp. - Key offerings
Zebra Technologies Corp. - Segment focus
SWOT

17. Appendix

17.1 Scope of the report

Market definition
Objectives
Notes and caveats

17.2 Inclusions and exclusions checklist

Inclusions checklist
Exclusions checklist

17.3 Currency conversion rates for US$

17.4 Research methodology

17.5 Data procurement

Information sources

17.6 Data validation

17.7 Validation techniques employed for market sizing

17.8 Data synthesis

17.9 360 degree market analysis

17.10 List of abbreviations

Research Methodology

Technavio presents a detailed picture of the market by way of study, synthesis, and summation of data from multiple sources. The analysts have presented the various facets of the market with a particular focus on identifying the key industry influencers. The data thus presented is comprehensive, reliable, and the result of extensive research, both primary and secondary.

INFORMATION SOURCES

Primary sources

  • Manufacturers and suppliers
  • Channel partners
  • Industry experts
  • Strategic decision makers

Secondary sources

  • Industry journals and periodicals
  • Government data
  • Financial reports of key industry players
  • Historical data
  • Press releases

DATA ANALYSIS

Data Synthesis

  • Collation of data
  • Estimation of key figures
  • Analysis of derived insights

Data Validation

  • Triangulation with data models
  • Reference against proprietary databases
  • Corroboration with industry experts

REPORT WRITING

Qualitative

  • Market drivers
  • Market challenges
  • Market trends
  • Five forces analysis

Quantitative

  • Market size and forecast
  • Market segmentation
  • Geographical insights
  • Competitive landscape

Interested in this report?

Get your sample now to see our research methodology and insights!

Download Now

Frequently Asked Questions

Biometric POS Terminals market growth will increase by USD 22599.0 million during 2026-2030.

The Biometric POS Terminals market is expected to grow at a CAGR of 23.9% during 2026-2030.

Biometric POS Terminals market is segmented by End-user (Retail, Medical and healthcare, Restaurant, Financial, Others) Technology (Fingerprint identification, Palm vein identification, Others) Type (Standalone POS terminals, Integrated POS terminals) Sector (Large enterprises, SMEs)

Aratek Biometric, BioWallet Services Ltd., Bitel, DERMALOG Systems GmbH, Diebold Nixdorf Incorp., Fingo Ltd., Fujitsu Ltd., Giesecke Devrient GmbH, HID Global Corp., IDEMIA France SAS, Ingenico Group SA, M2SYS Technology, NCR Voyix Corp., NEC Corp., SmartMetric Inc., Thales Group, Toshiba Corp., VeriFone Inc., Worldline SA, Zebra Technologies Corp. are a few of the key vendors in the Biometric POS Terminals market.

North America will register the highest growth rate of 36.5% among the other regions. Therefore, the Biometric POS Terminals market in North America is expected to garner significant business opportunities for the vendors during the forecast period.

US, Canada, Mexico, Germany, UK, France, Italy, Spain, The Netherlands, China, India, Japan, South Korea, Australia, Indonesia, UAE, Saudi Arabia, South Africa, Egypt, Nigeria, Brazil, Argentina, Colombia

  • Escalating demand for enhanced transaction security and fraud mitigation is the driving factor this market.

The Biometric POS Terminals market vendors should focus on grabbing business opportunities from the End-user segment as it accounted for the largest market share in the base year.
RIA - Research AI Assistant
Ask RIA