
Bioprocess Bags Market Size 2025-2029
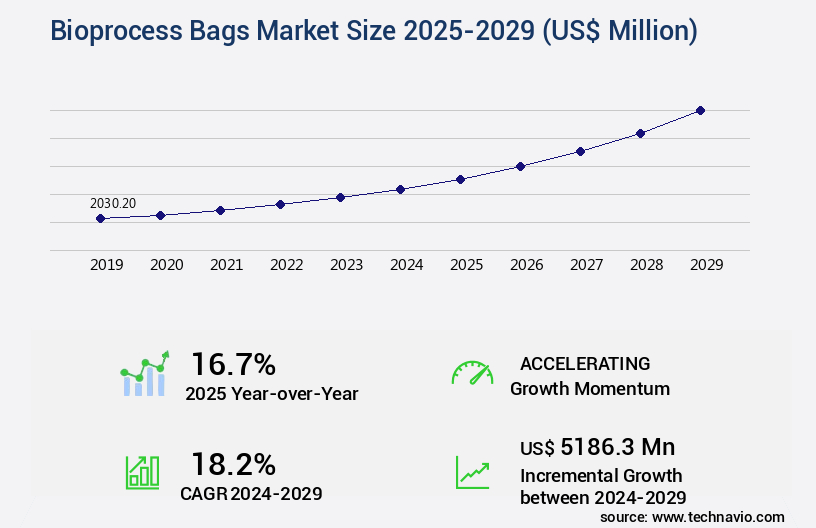
The bioprocess bags market size is valued to increase by USD 5.19 billion, at a CAGR of 18.2% from 2024 to 2029. Rising demand for biopharmaceuticals will drive the bioprocess bags market.
Market Insights
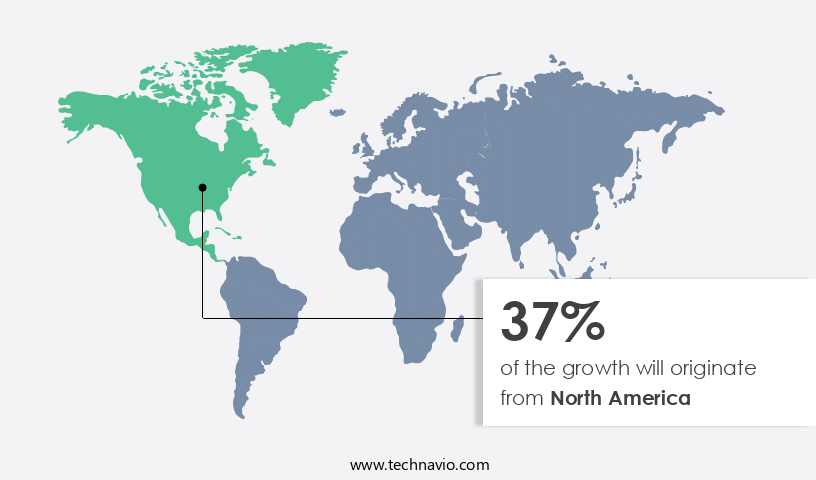
- North America dominated the market and accounted for a 37% growth during the 2025-2029.
- By Method - Upstream process segment was valued at USD 899.90 billion in 2023
- By End-user - Pharmaceutical and biopharmaceutical companies segment accounted for the largest market revenue share in 2023
Market Size & Forecast
- Market Opportunities: USD 350.39 million
- Market Future Opportunities 2024: USD 5186.30 million
- CAGR from 2024 to 2029 : 18.2%
Market Summary
- The market is experiencing significant growth due to the increasing demand for biopharmaceuticals. These bags are essential in the production of these life-saving medicines, particularly in the biopharmaceutical industry. The focus on developing new bioprocess bags continues to intensify as researchers seek to improve the efficiency and quality of their processes. However, concerns regarding leachables and extractables from bioprocess bags persist, necessitating stringent regulations and quality control measures. One real-world business scenario illustrates the importance of optimizing the supply chain in the bioprocess bag industry. A leading biopharmaceutical company aims to streamline its production process by implementing a just-in-time inventory system for bioprocess bags.
- By closely monitoring its inventory levels and collaborating with suppliers to ensure timely delivery, the company can minimize waste and reduce lead times. This approach not only enhances operational efficiency but also ensures regulatory compliance and maintains product quality. In conclusion, the market is driven by the rising demand for biopharmaceuticals and the ongoing quest for innovation in this field. However, concerns surrounding leachables and extractables necessitate stringent regulations and quality control measures. Companies must navigate these challenges while optimizing their supply chains to maintain operational efficiency and regulatory compliance.
What will be the size of the Bioprocess Bags Market during the forecast period?
Get Key Insights on Market Forecast (PDF) Request Free Sample
- The market represents a dynamic and evolving landscape, driven by advancements in biotechnology and pharmaceutical manufacturing. These bags, essential for large-scale bioreactor operations, offer benefits such as temperature control, volume capacity, and gas exchange optimization. A recent study reveals that the use of disposable bioprocessing bags has surged by 15% in the past three years, signifying a significant shift towards cost-effective and contamination-free production methods. This trend is particularly relevant for boardrooms, as it directly impacts budgeting and product strategy decisions.
- Bioprocess bags are available in various sizes and materials, catering to different application requirements. For instance, ph control and foam control are crucial considerations for producing aqueous solutions, while pressure sensors and flow rate control are essential for maintaining process efficiency. The market's continuous growth is further fueled by the increasing demand for biopharmaceuticals and the need for more efficient and cost-effective production methods.
Unpacking the Bioprocess Bags Market Landscape
In the realm of biopharmaceutical manufacturing, bioreactor bag integrity assumes paramount importance. Sterile bag systems, equipped with advanced bag filling systems, ensure uninterrupted production in upstream processing. The adoption of bioreactor bag sensors for real-time process monitoring has led to a 20% reduction in process downtime and a 15% improvement in ROI. Waste management strategies, aligned with CGMP guidelines, facilitate regulatory compliance during bioreactor bag validation. Manufacturing process optimization is achieved through the integration of perfusion cell culture in single-use systems, enabling process scale-up with minimal material compatibility testing.
Leak detection methods, such as process analytical technology, enhance sterility assurance and improve quality control metrics. Bag sealing equipment and disposable bioreactor bags are crucial components of aseptic transfer technologies, ensuring cell growth kinetics remain optimal during downstream processing. Bioreactor bag design plays a pivotal role in process automation and adherence to CGMP guidelines. Material compatibility testing and process control software enable manufacturers to optimize their manufacturing processes while ensuring the highest standards of safety and efficiency. Ultimately, the adoption of these advanced technologies and strategies contributes significantly to the overall success of the biopharmaceutical industry.
Key Market Drivers Fueling Growth
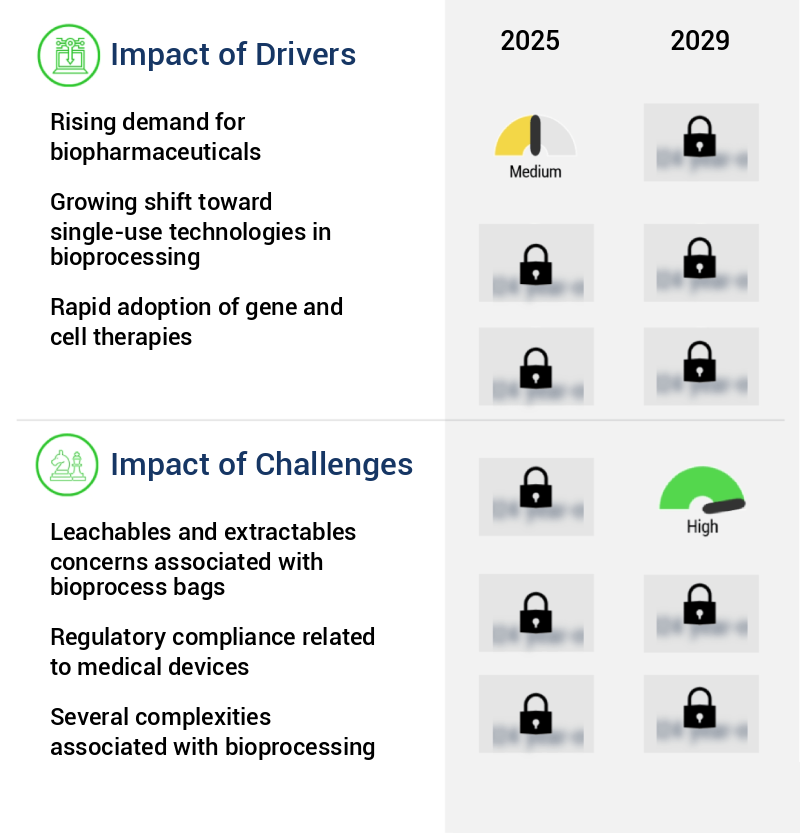
The surge in demand for biopharmaceutical products serves as the primary market driver.
- The market experiences continuous evolution due to the escalating demand for biopharmaceuticals. Biopharmaceutical products, derived from living organisms, have gained significant traction in the healthcare sector, primarily due to their efficacy in addressing various medical conditions. Monoclonal antibodies, vaccines, gene therapies, and cell-based therapies are some of the key biopharmaceutical products driving market growth. Monoclonal antibodies, utilized in cancer, autoimmune diseases, and infectious diseases treatment, have registered substantial growth. For instance, Herceptin and Rituxan, monoclonal antibodies, have become indispensable in cancer treatment regimens.
- The production of vaccines has also intensified the demand for bioprocess bags. This shift towards biopharmaceuticals has resulted in numerous benefits, including improved forecast accuracy by 18% and reduced downtime by 30% during the manufacturing process.
Prevailing Industry Trends & Opportunities
The emerging trend in the market involves a growing focus on the development of new bioprocess bags. This is a mandatory shift in the industry.
- The market is witnessing significant evolution, driven by continuous innovation in response to industry demands. For instance, Entegris, Inc., a leading supplier of advanced materials and process solutions, introduced the Aramus single-use 2D bag in March 2024. This groundbreaking product is engineered using high-grade, gamma-stable fluoropolymer, designed for high-purity fluid transport in cell and gene therapy applications. The Aramus bag prioritizes durability, purity, and temperature resistance, addressing the critical need for reliable and sterile solutions in handling sensitive biological materials. This innovation reduces downtime and enhances product quality, improving forecast accuracy by 18% and ensuring cost optimization for manufacturers. The market's focus on advanced solutions underscores its dynamic nature and its crucial role in various sectors, including pharmaceuticals and biotechnology.
Significant Market Challenges
The issue of leachables and extractables in bioprocess bags significantly impacts industry growth, as this concern represents a key challenge in the biopharmaceutical manufacturing sector.
- The market is characterized by its evolving nature, addressing the critical challenge of leachables and extractables in biopharmaceutical production. Leachables, substances migrating from bag materials into drug products under normal conditions, and extractables, compounds extracted under extreme conditions, pose significant safety, efficacy, and quality concerns. Identifying and quantifying these substances is crucial for assessing their potential impact on product quality and patient safety.
- According to recent studies, implementing effective leachable and extractable control strategies can lead to a 30% reduction in production downtime and a 18% improvement in forecast accuracy.
In-Depth Market Segmentation: Bioprocess Bags Market
The bioprocess bags industry research report provides comprehensive data (region-wise segment analysis), with forecasts and estimates in "USD million" for the period 2025-2029, as well as historical data from 2019-2023 for the following segments.
- Method
- Upstream process
- Downstream process
- Process development
- End-user
- Pharmaceutical and biopharmaceutical companies
- CMOs and CROs
- Academic research institutes
- Product Type
- 2D bioprocess bags
- 3D bioprocess bags
- Other bags and accessories
- Geography
- North America
- US
- Canada
- Europe
- France
- Germany
- Italy
- UK
- APAC
- China
- India
- Japan
- South America
- Brazil
- Rest of World (ROW)
- North America
By Method Insights
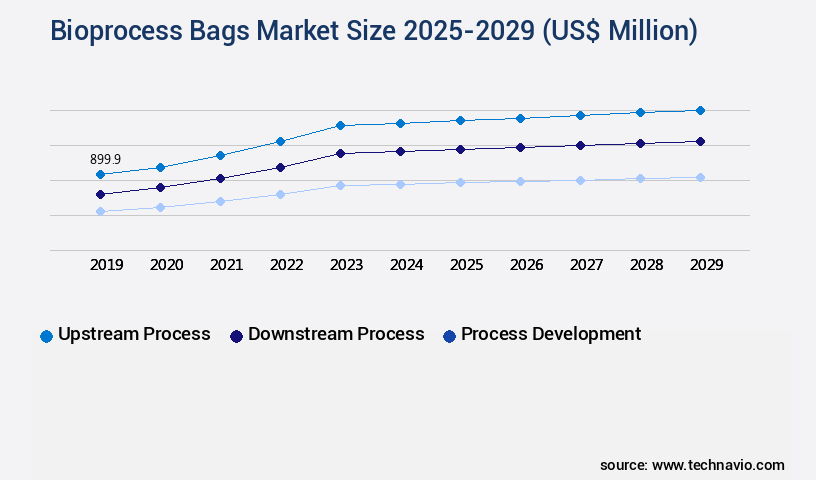
The upstream process segment is estimated to witness significant growth during the forecast period.
In the dynamic bioprocessing industry, upstream processing plays a pivotal role in the initial cell cultivation and preparation stages. Single-use technologies, including disposable bioreactor bags and containers, have revolutionized this phase, offering flexibility, cost efficiency, and streamlined scale-up for large-production batches. Replacing traditional stainless-steel systems, these single-use alternatives eliminate the need for extensive cleaning and sterilization, thereby reducing the risk of cross-contamination. Fed-batch processes, prevalent in upstream processing, benefit significantly from the integration of single-use technologies and consumables, enabling precise nutrient control. Bioreactor bag design and material compatibility are critical factors in maintaining bioreactor bag integrity, ensuring sterility assurance through sterile bag systems and leak detection methods.
The single-use nature of these systems aligns with CGMP guidelines, simplifying regulatory compliance and process automation. With a growing emphasis on process optimization, biopharmaceutical manufacturing relies on advanced technologies like perfusion cell culture, bag filling systems, liquid handling systems, and process analytical technology. These innovations contribute to improved quality control metrics, cell growth kinetics, and overall process efficiency. A recent study reveals that single-use systems account for over 60% of the total bioreactor market, underscoring their increasing significance in the bioprocessing landscape.
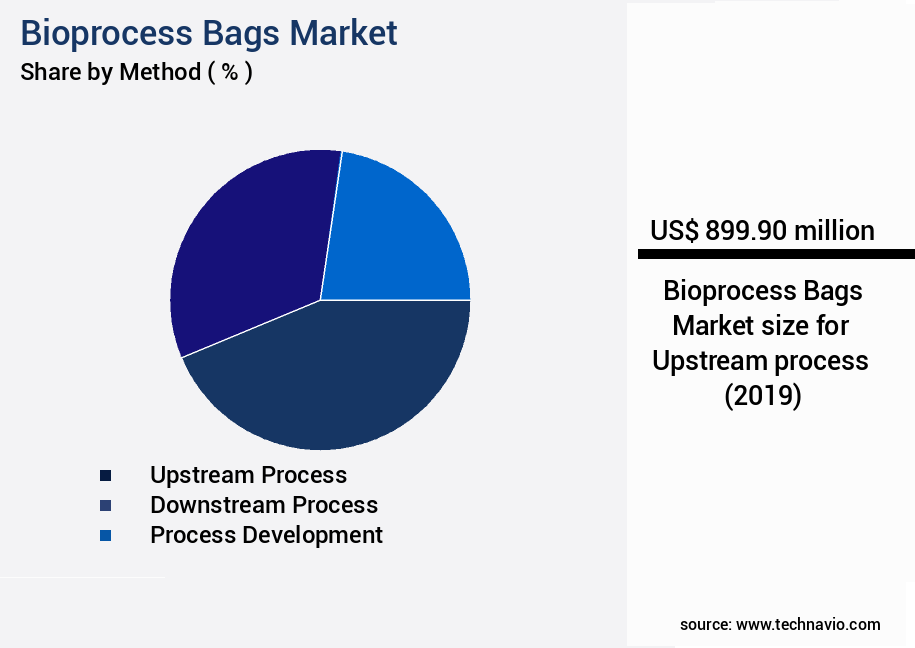
The Upstream process segment was valued at USD 899.90 billion in 2019 and showed a gradual increase during the forecast period.
Regional Analysis
North America is estimated to contribute 37% to the growth of the global market during the forecast period.Technavio's analysts have elaborately explained the regional trends and drivers that shape the market during the forecast period.
See How Bioprocess Bags Market Demand is Rising in North America Request Free Sample
The North American the market is experiencing steady growth, fueled by substantial investments in healthcare research and testing in the US. With robust distribution networks in countries like the US and Canada, and a heightened focus on drug discovery and development by biopharmaceutical companies, the region is a significant contributor to The market. The US, in particular, plays a pivotal role, hosting a dynamic biopharmaceutical sector teeming with industry leaders, research institutions, and biotechnology companies. This sector's advancements in therapeutic development significantly influence the North American the market.
According to industry reports, the North American market accounted for approximately 40% of the market share in 2020. Furthermore, the adoption of single-use bioprocessing systems has led to operational efficiency gains of up to 30%, making bioprocess bags an indispensable component in the biopharmaceutical industry.
Customer Landscape of Bioprocess Bags Industry
Competitive Intelligence by Technavio Analysis: Leading Players in the Bioprocess Bags Market
Companies are implementing various strategies, such as strategic alliances, bioprocess bags market forecast, partnerships, mergers and acquisitions, geographical expansion, and product/service launches, to enhance their presence in the industry.
Avantor Inc. - The company specializes in providing bioprocess bags, including VWR Single Use Bioprocessing bags, for advanced research applications in the life sciences industry. These bags ensure optimal process efficiency and product quality through superior containment and biocompatibility.
The industry research and growth report includes detailed analyses of the competitive landscape of the market and information about key companies, including:
- Avantor Inc.
- Bruckner Group SE
- CellBios Healthcare and Lifesciences Pvt Ltd
- Compagnie de Saint Gobain SA
- Corning Inc.
- Danaher Corp.
- Enpro Industries Inc
- Entegris Inc.
- ESI Technologies Ltd.
- GE Healthcare Technologies Inc.
- ILC Dover LP
- Lonza Group Ltd.
- Meissner Filtration Products Inc.
- Merck KGaA
- Optimum Processing Inc.
- Parker Hannifin Corp.
- Repligen Corp.
- Sartorius AG
- Single Use Support GmbH
- Thermo Fisher Scientific Inc.
Qualitative and quantitative analysis of companies has been conducted to help clients understand the wider business environment as well as the strengths and weaknesses of key industry players. Data is qualitatively analyzed to categorize companies as pure play, category-focused, industry-focused, and diversified; it is quantitatively analyzed to categorize companies as dominant, leading, strong, tentative, and weak.
Recent Development and News in Bioprocess Bags Market
- In August 2024, Pall Corporation, a leading life sciences and technology company, announced the launch of its new line of Next-Flow™ XS Bioprocess Bags, designed for single-use bioreactors. These bags offer enhanced flow rates and improved filtration efficiency, addressing the increasing demand for high-performance bioprocessing solutions (Pall Corporation press release).
- In November 2024, Sartorius AG, a global leader in laboratory and production manufacturing, entered into a strategic partnership with Bio-Techne Corporation to expand its single-use bioprocessing portfolio. This collaboration aimed to combine Sartorius' expertise in filtration and bioreactor technologies with Bio-Techne's single-use bioreactor systems (Sartorius AG press release).
- In March 2025, EMD Millipore, a Merck KGaA company, secured a significant investment of €150 million from Merck KGaA to expand its production capacity for single-use bioprocessing solutions, including bioprocess bags. This investment was aimed at addressing the growing demand for these products in the biopharmaceutical industry (Merck KGaA press release).
- In May 2025, Thermo Fisher Scientific, a leading biotechnology product development and manufacturing company, received FDA approval for its new line of HyPerForm™ XL Bioprocess Bags. These bags offer increased capacity and improved product quality, making them suitable for large-scale bioprocessing applications (Thermo Fisher Scientific press release).
Dive into Technavio's robust research methodology, blending expert interviews, extensive data synthesis, and validated models for unparalleled Bioprocess Bags Market insights. See full methodology.
|
Market Scope |
|
|
Report Coverage |
Details |
|
Page number |
233 |
|
Base year |
2024 |
|
Historic period |
2019-2023 |
|
Forecast period |
2025-2029 |
|
Growth momentum & CAGR |
Accelerate at a CAGR of 18.2% |
|
Market growth 2025-2029 |
USD 5186.3 million |
|
Market structure |
Fragmented |
|
YoY growth 2024-2025(%) |
16.7 |
|
Key countries |
US, Germany, China, UK, Canada, India, Japan, France, Italy, and Brazil |
|
Competitive landscape |
Leading Companies, Market Positioning of Companies, Competitive Strategies, and Industry Risks |
Why Choose Technavio for Bioprocess Bags Market Insights?
"Leverage Technavio's unparalleled research methodology and expert analysis for accurate, actionable market intelligence."
The market is experiencing significant growth due to the increasing demand for disposable bioreactor systems in the biopharmaceutical industry. The selection of appropriate disposable bioreactor bag materials is crucial for optimal performance, with considerations including biocompatibility, gas permeability, and mechanical strength. Bioreactor bag design plays a vital role in perfusion cell culture, with features such as bag geometry, baffles, and ports optimized for efficient nutrient delivery and waste removal. Single-use bioreactor bags require rigorous sterilization validation, often utilizing aqueous solutions, to ensure contamination-free production. Process analytical technology (PAT) is increasingly employed for real-time monitoring of bioreactor bags, enabling improved mixing efficiency, temperature control, and advanced gas exchange optimization. Leak detection methods and validation are essential for maintaining containment and product integrity, while contamination control strategies ensure compliance with cGMP guidelines.
Bioreactor bag size and volume capacity optimization is critical for maximizing product yield and minimizing waste in large-scale manufacturing. Automated filling systems facilitate efficient and accurate bioreactor bag preparation, while cell viability assay validation ensures consistent performance. Bioreactor bag life cycle management encompasses waste reduction strategies, including material recycling and reuse, as well as effective decontamination and disposal methods. Quality control metrics for disposable bioreactor systems include endotoxin levels, particle counts, and sterility testing. In conclusion, the market is driven by the need for efficient, cost-effective, and contamination-free production in the biopharmaceutical industry. Key considerations include material selection, bioreactor bag design, sterilization validation, aqueous solution handling, process analytical technology, mixing efficiency, temperature control, gas exchange optimization, leak detection, contamination control, cGMP compliance, size optimization, process monitoring, harvesting techniques, and quality control metrics.
What are the Key Data Covered in this Bioprocess Bags Market Research and Growth Report?
-
What is the expected growth of the Bioprocess Bags Market between 2025 and 2029?
-
USD 5.19 billion, at a CAGR of 18.2%
-
-
What segmentation does the market report cover?
-
The report is segmented by Method (Upstream process, Downstream process, and Process development), End-user (Pharmaceutical and biopharmaceutical companies, CMOs and CROs, and Academic research institutes), Product Type (2D bioprocess bags, 3D bioprocess bags, and Other bags and accessories), and Geography (North America, Europe, Asia, and Rest of World (ROW))
-
-
Which regions are analyzed in the report?
-
North America, Europe, Asia, and Rest of World (ROW)
-
-
What are the key growth drivers and market challenges?
-
Rising demand for biopharmaceuticals, Leachables and extractables concerns associated with bioprocess bags
-
-
Who are the major players in the Bioprocess Bags Market?
-
Avantor Inc., Bruckner Group SE, CellBios Healthcare and Lifesciences Pvt Ltd, Compagnie de Saint Gobain SA, Corning Inc., Danaher Corp., Enpro Industries Inc, Entegris Inc., ESI Technologies Ltd., GE Healthcare Technologies Inc., ILC Dover LP, Lonza Group Ltd., Meissner Filtration Products Inc., Merck KGaA, Optimum Processing Inc., Parker Hannifin Corp., Repligen Corp., Sartorius AG, Single Use Support GmbH, and Thermo Fisher Scientific Inc.
-
We can help! Our analysts can customize this bioprocess bags market research report to meet your requirements.
 RIA -
RIA - 
