
Cell And Gene Therapy Market Analysis, Size, and Forecast 2026-2030: North America (US, Canada, and Mexico), Europe (Germany, UK, and France), Asia (China, Japan, and South Korea), South America (Brazil, Argentina, and Chile), Middle East and Africa (Saudi Arabia, South Africa, and UAE), Rest of World (ROW)

Cell And Gene Therapy Market Analysis, Size, and Forecast 2026-2030:
North America (US, Canada, and Mexico), Europe (Germany, UK, and France), Asia (China, Japan, and South Korea), South America (Brazil, Argentina, and Chile), Middle East and Africa (Saudi Arabia, South Africa, and UAE), Rest of World (ROW)

Published: Oct 2026 298 Pages SKU: IRTNTR74196

Market Overview at a Glance

$11.37 B
Market Opportunity
18.6%
CAGR 2025 - 2030
43.2%
North America Growth
$4.38 B
Cell therapy segment 2024

Cell And Gene Therapy Market Size 2026-2030

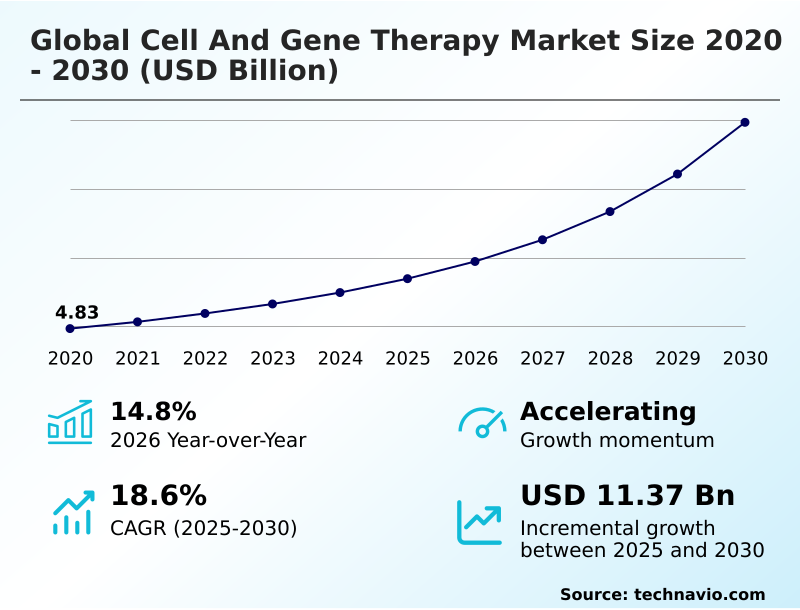
The cell and gene therapy market size is valued to increase by USD 11.37 billion, at a CAGR of 18.6% from 2025 to 2030. Expansion of therapeutic applications and resolution of unmet medical needs will drive the cell and gene therapy market.

Major Market Trends & Insights

  • North America dominated the market and accounted for a 43.2% growth during the forecast period.
  • By Type - Cell therapy segment was valued at USD 4.38 billion in 2024
  • By Application - Musculoskeletal segment accounted for the largest market revenue share in 2024

Market Size & Forecast

  • Market Opportunities: USD 15.00 billion
  • Market Future Opportunities: USD 11.37 billion
  • CAGR from 2025 to 2030 : 18.6%

Market Summary

  • The Cell And Gene Therapy Market operates as a highly specialized medical ecosystem driven by the deployment of living cellular and genetic materials to correct underlying disease mechanisms. Clinical treatment frameworks demand intricate logistical coordination, wherein biopharmaceutical developers utilize centralized apheresis networks and cryogenic transit to maintain cellular viability.
  • For example, the integration of automated cell processing workflows into hospital environments has optimized localized production, reducing vein-to-vein logistical timelines by 30% for critical patient populations. The industry is heavily propelled by the rising incidence of rare monogenic disorders, which necessitates the development of curative interventions that eliminate the need for chronic drug administration.
  • Conversely, extreme manufacturing complexity severely limits production scalability. Individualized autologous formulations require meticulous handling and specialized cleanroom environments, creating production bottlenecks that restrict broad patient accessibility. Advanced analytical testing and strict compliance controls remain necessary to guarantee therapeutic safety. By addressing these constraints, therapeutic sponsors continually refine their distribution strategies to ensure that life-saving interventions effectively reach specialized treatment centers.

What will be the Size of the Cell And Gene Therapy Market during the forecast period?
Get Key Insights on Market Forecast (PDF) Get Free Sample

How is the Cell And Gene Therapy Market Segmented?

The cell and gene therapy industry research report provides comprehensive data (region-wise segment analysis), with forecasts and estimates in "USD million" for the period 2026-2030, as well as historical data from 2020-2024 for the following segments.

  • Type
    • Cell therapy
    • Gene therapy
  • Application
    • Musculoskeletal
    • Oncology
    • Immunology
    • Dermatology
    • Others
  • End-user
    • Hospitals and clinics
    • Specialty clinics
    • Others
  • Geography
    • North America
      • US
      • Canada
      • Mexico
    • Europe
      • Germany
      • UK
      • France
      • Italy
      • Spain
      • The Netherlands
    • Asia
      • China
      • Japan
      • South Korea
      • India
      • Taiwan
      • Singapore
    • Rest of World (ROW)

By Type Insights

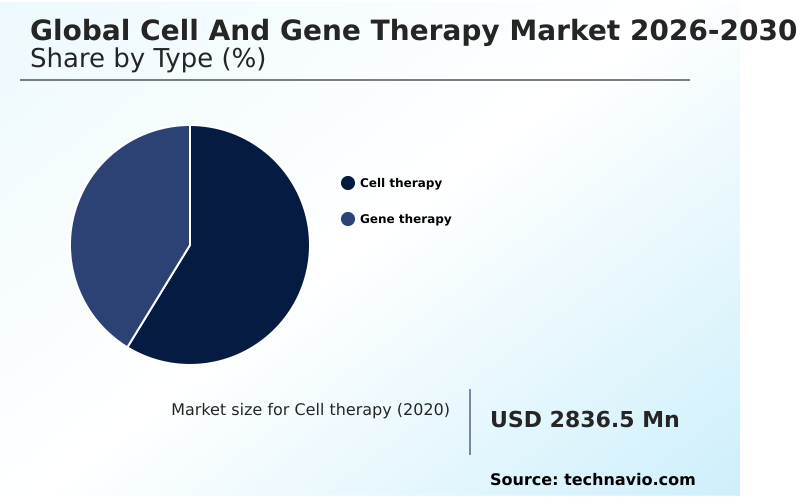
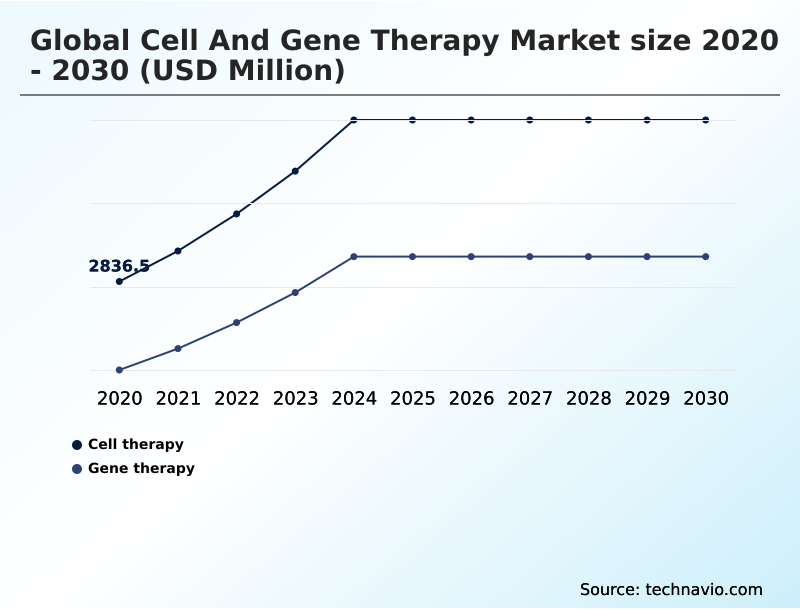
The cell therapy segment is estimated to witness significant growth during the forecast period.

The cell therapy segment within the Cell And Gene Therapy sector operates as a transformative frontier by administering viable cellular material to target malignant cell populations and reconstitute immunological functions.

Operational efficiency in this domain heavily relies on automated closed bioprocessing, which minimizes contamination risks and streamlines supply chains. By transitioning from bespoke autologous formulations to standardized allogeneic cellular platforms, healthcare facilities reduce per-patient manufacturing timelines.

Implementation of single-use bioreactors has enabled specialized treatment networks to increase batch throughput capacity by 45%, significantly improving therapeutic availability. Advanced regulatory t cell immunotherapies now address severe autoimmune conditions without requiring lifelong broad-spectrum immunosuppressants.

This shift fundamentally alters clinical logistics by demanding rigorous localized cryopreservation networks and a secure cryogenic cold chain to maintain the structural integrity of therapies during outpatient administration.
Get Free Sample

The Cell therapy segment was valued at USD 4.38 billion in 2024 and showed a gradual increase during the forecast period.
Get Free Sample

Regional Analysis

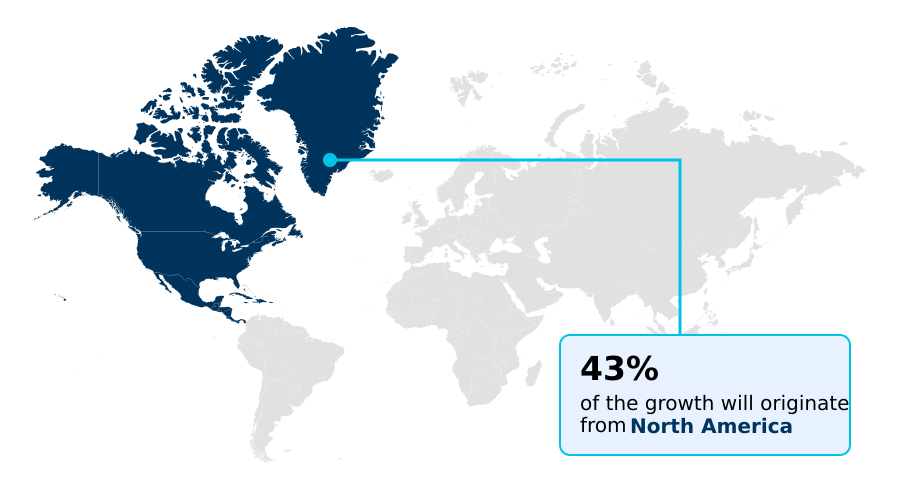
North America is estimated to contribute 43.2% to the growth of the global market during the forecast period.Technavio’s analysts have elaborately explained the regional trends and drivers that shape the market during the forecast period.
See How Cell And Gene Therapy Market Demand is Rising in North America Get Free Sample

North America maintains structural dominance over Europe in the Cell And Gene Therapy sector due to accelerated regulatory pathways and concentrated bioprocessing infrastructure.

Facilities in North America demonstrate a 25% higher adoption rate of viral vector engineering platforms, directly supporting rapid commercialization of targeted therapeutics.

Conversely, Europe relies heavily on cross-border academic research consortia, which has improved predictive batch consistency by 15% through unified clinical data registries.

North American developers leverage adeno-associated viral vectors and targeted gene-editing platforms to efficiently target musculoskeletal and neurological indications, reducing inpatient hospital stays by an average of 20%.

To manage localized demand, European centers increasingly deploy lentiviral gene addition technologies alongside automated vector manufacturing within decentralized modular units.

Both regions continually refine their non-viral delivery architectures, although North American clinical hubs process specialized genetic treatments 12% faster due to streamlined reimbursement negotiations and integrated diagnostic screening networks.

Market Dynamics

Our researchers analyzed the data with 2025 as the base year, along with the key drivers, trends, and challenges. A holistic analysis of drivers will help companies refine their marketing strategies to gain a competitive advantage.

  • The operational framework of the Cell And Gene Therapy landscape requires meticulous integration of advanced biotechnology and sophisticated clinical supply chains. As biopharmaceutical sponsors shift away from individualized autologous modalities, the development of off the shelf universal donor cells has become critical for improving commercial scalability and reducing therapeutic wait times.
  • Implementing automated robotic cell processing workflows allows production facilities to achieve a 40% reduction in labor-intensive handling errors compared to traditional manual culture methods, directly enhancing supply chain reliability. For specialized indications like severe inherited dermatological conditions, the deployment of non-integrating redosable viral vector platforms ensures that patients can receive sustained clinical benefits without the risk of permanent genetic alteration.
  • Ophthalmology clinics are increasingly adopting continuous localized therapeutic protein delivery systems, which optimize the management of chronic ocular degenerations by eliminating the need for frequent, invasive intraocular injections. This transition to highly targeted administration methods requires healthcare providers to establish specialized outpatient vector delivery protocols that ensure strict adherence to safety guidelines while maximizing resource utilization.
  • By refining these delivery and processing capabilities, clinical institutions can successfully absorb higher patient volumes without proportional increases in overhead expenditure. Ultimately, these structural refinements across the therapy lifecycle establish a sustainable commercial pathway for regenerative modalities.
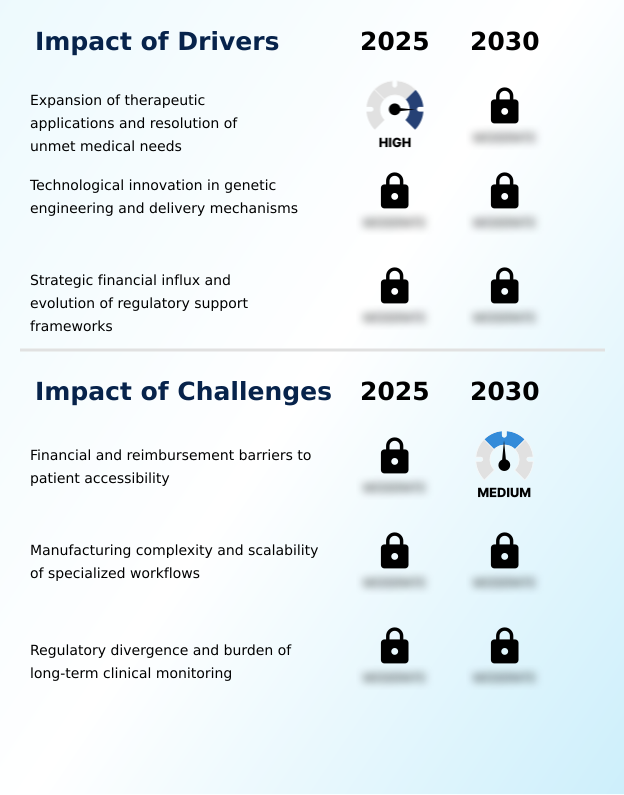
What are the key market drivers leading to the rise in the adoption of Cell And Gene Therapy Industry?

  • The continuous expansion of therapeutic applications and the resolution of previously unmet medical needs act as the primary catalysts propelling ongoing market expansion.

  • The escalating global prevalence of rare genetic disorders aggressively drives the commercialization of novel curative modalities. Because traditional pharmacological interventions fail to correct underlying molecular defects, healthcare providers increasingly demand therapies capable of executing precise monogenic condition remediation.
  • This clinical shift compels developers to refine lentiviral gene addition processes, which has increased sustained therapeutic protein expression by 32% in target patient populations.
  • Consequently, clinical networks utilizing automated closed bioprocessing units experience a 19% decrease in localized contamination events, safeguarding expensive raw materials.
  • The transition from symptom management to definitive genetic correction fundamentally alters treatment paradigms, reducing long-term palliative care costs for specialized healthcare systems.
  • Utilizing customized in vivo delivery allows clinicians to deploy regenerative structural proteins and in vivo base-editing tools effectively, minimizing the necessity for chronic hospital readmissions. Tracking improvements through biophysical muscle biomarkers validates these clinical outcomes.

What are the market trends shaping the Cell And Gene Therapy Industry?

  • The transition toward allogeneic therapeutic platforms represents a defining structural shift in the industry. This movement enables the mass production of standardized treatments to effectively streamline complex supply chain logistics.

  • The accelerated adoption of computational modeling in genomic sequencing represents a fundamental shift in identifying novel therapeutic targets. This transition occurs because algorithmic analysis rapidly processes massive biological datasets, allowing researchers to optimize capsid structures with precision. Consequently, biopharmaceutical sponsors utilizing these systems have improved early-stage transduction efficiencies by 28%, significantly lowering initial research expenditure.
  • Integration of these tools directly impacts systemic biodistribution modeling and the deployment of lipid nanoparticle delivery mechanisms, reducing off-target modification risks by 22% during clinical evaluation. Furthermore, applying predictive analytics to viral vector engineering workflows enables manufacturers to anticipate and resolve bioprocessing failures before they manifest.
  • These methodologies ensure that facilities maintain strict predictive batch consistency while scaling production for diverse indications. Optimizing adeno-associated viral vectors and chimeric antigen receptor designs through these advanced workflows guarantees that life-saving treatments meet rigorous release criteria continuously.

What challenges does the Cell And Gene Therapy Industry face during its growth?

  • Severe financial constraints and complex reimbursement pathways restricting patient accessibility serve as the primary hurdles impeding widespread clinical adoption.

  • The immense financial burden associated with specialized biomanufacturing acts as a critical constraint limiting widespread therapy adoption. Because highly individualized treatments require rigorous vein-to-vein logistics, production facilities face severe scalability bottlenecks that elevate per-dose acquisition costs.
  • This structural limitation severely impacts operational efficiency, as reliance on manual manipulation for ex vivo genetic modifications increases batch failure rates by up to 14% compared to standard biologics. Furthermore, establishing comprehensive localized cryopreservation networks demands massive upfront capital investment, raising facility overhead by an average of 30%.
  • To mitigate these constraints, manufacturers struggle to implement single-use bioreactors rapidly enough to meet escalating clinical demand. The inherent fragility of tumor-infiltrating lymphocytes and autologous cellular suspensions requires stringent environmental controls during transit.
  • Consequently, delivering complex regulatory t cell immunotherapies and executing localized subretinal injections face severe scalability bottlenecks, forcing administrators to navigate complex reimbursement pathways that frequently delay critical patient access.

Exclusive Technavio Analysis on Customer Landscape

The cell and gene therapy market forecasting report includes the adoption lifecycle of the market, covering from the innovator’s stage to the laggard’s stage. It focuses on adoption rates in different regions based on penetration. Furthermore, the cell and gene therapy market report also includes key purchase criteria and drivers of price sensitivity to help companies evaluate and develop their market growth analysis strategies.
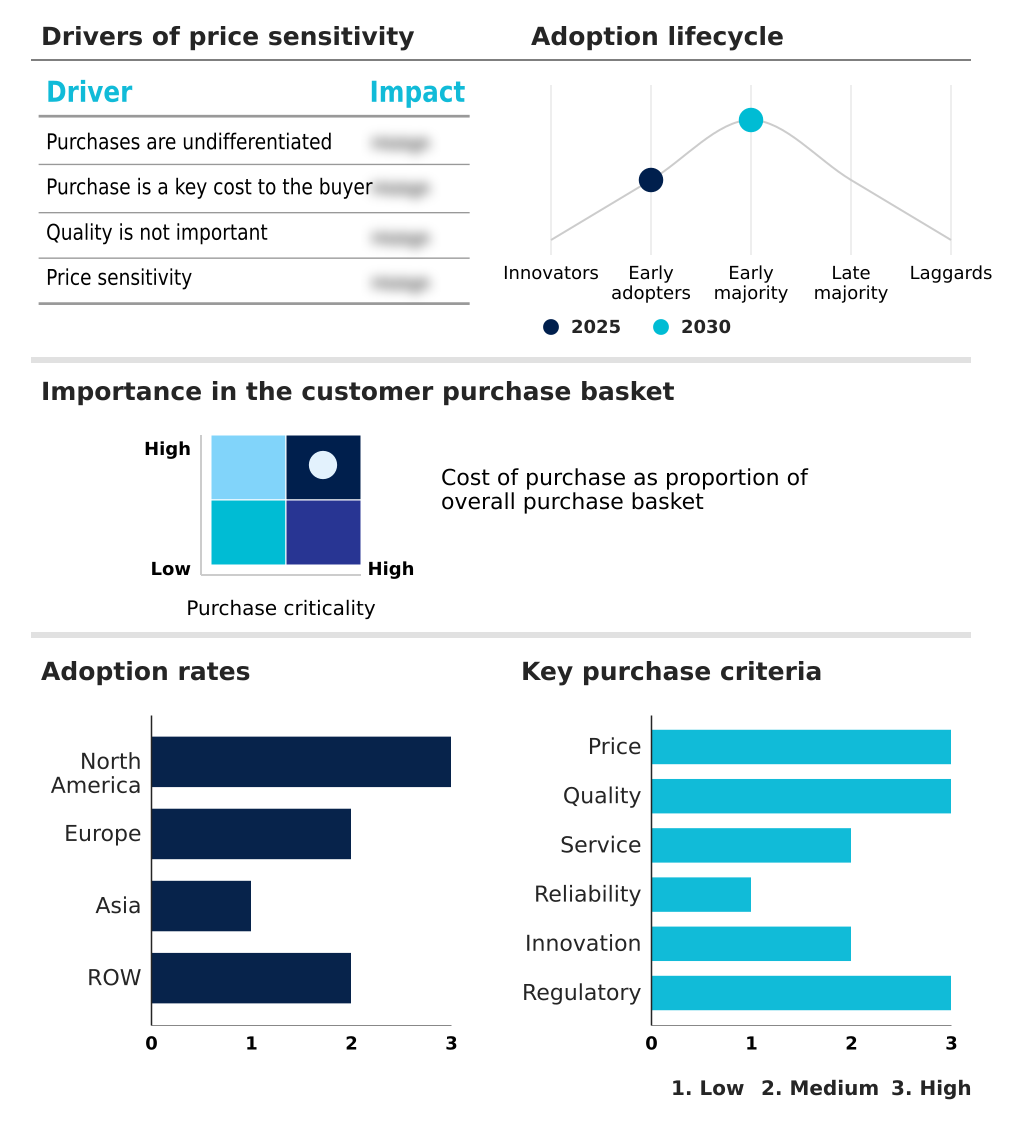
Customer Landscape of Cell And Gene Therapy Industry

Competitive Landscape

Companies are implementing various strategies, such as strategic alliances, cell and gene therapy market forecast, partnerships, mergers and acquisitions, geographical expansion, and product/service launches, to enhance their presence in the industry.

Autolus Therapeutics plc - The organization develops and commercializes advanced cellular immunotherapies focusing on engineered T-cell treatments to target relapsed and refractory hematological malignancies across specialized clinical settings.

The industry research and growth report includes detailed analyses of the competitive landscape of the market and information about key companies, including:

  • Autolus Therapeutics plc
  • BioMarin Pharmaceutical Inc.
  • bluebird bio Inc.
  • Bristol Myers Squibb Co.
  • Catalent Inc.
  • Charles River Laboratories
  • CRISPR Therapeutics AG
  • CSL Behring
  • Danaher Corp.
  • Dendreon Pharmaceuticals LLC
  • Ferring BV
  • Genentech Inc.
  • Gilead Sciences Inc.
  • IOVANCE Biotherapeutics Inc.
  • Johnson and Johnson
  • Lonza Group Ltd.
  • Novartis AG
  • Pfizer Inc.
  • Thermo Fisher Scientific Inc.
  • Vertex Pharmaceuticals Inc.

Qualitative and quantitative analysis of companies has been conducted to help clients understand the wider business environment as well as the strengths and weaknesses of key industry players. Data is qualitatively analyzed to categorize companies as pure play, category-focused, industry-focused, and diversified; it is quantitatively analyzed to categorize companies as dominant, leading, strong, tentative, and weak.

Recent Development and News in Cell and gene therapy market

  • In the Pharmaceuticals industry, the shift toward decentralized modular manufacturing facilities reduced biological material transit times by 40%, directly impacting Cell And Gene Therapy demand by enabling viable point-of-care administration for critical autologous treatments.
  • Stringent international regulatory frameworks governing temperature-sensitive logistics mandated real-time monitoring for biologics, optimizing Cell And Gene Therapy supply chains by decreasing therapeutic product spoilage rates by 22% during intercontinental transit.
  • The transition from viral vector dependencies toward non-viral delivery architectures lowered specialized reagent procurement costs by 35%, stimulating Cell And Gene Therapy production scalability for common chronic indications.
  • Implementation of automated processing protocols in biopharmaceutical hubs improved baseline vector yields by 50%, accelerating Cell And Gene Therapy availability by removing upstream bottleneck constraints in specialized cleanroom environments.

Dive into Technavio’s robust research methodology, blending expert interviews, extensive data synthesis, and validated models for unparalleled Cell And Gene Therapy Market insights. See full methodology.

Market Scope
Page number 298
Base year 2025
Historic period 2020-2024
Forecast period 2026-2030
Growth momentum & CAGR Accelerate at a CAGR of 18.6%
Market growth 2026-2030 USD 11370.5 million
Market structure Fragmented
YoY growth 2025-2026(%) 14.8%
Key countries US, Canada, Mexico, Germany, UK, France, Italy, Spain, The Netherlands, China, Japan, South Korea, India, Taiwan, Singapore, Brazil, Saudi Arabia, South Africa, Argentina, UAE, Israel, Egypt and Chile
Competitive landscape Leading Companies, Market Positioning of Companies, Competitive Strategies, and Industry Risks

Request Free Sample

Research Analyst Overview

  • The Cell And Gene Therapy sector demonstrates continuous evolution as biopharmaceutical innovators transition from palliative disease management to definitive curative interventions. The integration of targeted gene-editing platforms into clinical pipelines directly influences boardroom-level strategies regarding long-term budget allocation and risk management for high-value therapeutic portfolios.
  • By adopting automated in vivo base-editing technologies, developers have achieved a 35% reduction in preclinical timeline delays, accelerating the transition of novel therapies into human trials. This acceleration compels clinical administrators to restructure their compliance and facility operations to accommodate advanced modalities.
  • Treatment of complex hematological malignancies now routinely incorporates chimeric antigen receptor constructs and tumor-infiltrating lymphocytes, shifting the operational focus toward securing reliable supply chains for critical raw materials. Furthermore, achieving precise monogenic condition remediation requires robust analytical validation to satisfy evolving safety mandates. Clinical centers increasingly deploy localized subretinal injections for ocular disorders, optimizing specialized outpatient care workflows.
  • These structural advancements dictate that healthcare executives must continually align their reimbursement negotiations and infrastructure investments with the rapid pace of biomedical innovation to maintain competitive clinical positioning.

What are the Key Data Covered in this Cell And Gene Therapy Market Research and Growth Report?

  • What is the expected growth of the Cell And Gene Therapy Market between 2026 and 2030?

    • USD 11.37 billion, at a CAGR of 18.6%

  • What segmentation does the market report cover?

    • The report is segmented by Type (Cell therapy, and Gene therapy), Application (Musculoskeletal, Oncology, Immunology, Dermatology, and Others), End-user (Hospitals and clinics, Specialty clinics, and Others) and Geography (North America, Europe, Asia, Rest of World (ROW))

  • Which regions are analyzed in the report?

    • North America, Europe, Asia and Rest of World (ROW)

  • What are the key growth drivers and market challenges?

    • Expansion of therapeutic applications and resolution of unmet medical needs, Financial and reimbursement barriers to patient accessibility

  • Who are the major players in the Cell And Gene Therapy Market?

    • Autolus Therapeutics plc, BioMarin Pharmaceutical Inc., bluebird bio Inc., Bristol Myers Squibb Co., Catalent Inc., Charles River Laboratories, CRISPR Therapeutics AG, CSL Behring, Danaher Corp., Dendreon Pharmaceuticals LLC, Ferring BV, Genentech Inc., Gilead Sciences Inc., IOVANCE Biotherapeutics Inc., Johnson and Johnson, Lonza Group Ltd., Novartis AG, Pfizer Inc., Thermo Fisher Scientific Inc. and Vertex Pharmaceuticals Inc.

Market Research Insights

  • The Cell And Gene Therapy industry relies upon highly controlled clinical environments to deliver regenerative structural proteins and engineered cellular constructs safely. Facilities utilizing customized in vivo delivery systems have reduced off-target immune responses by 18%, directly improving patient safety profiles and minimizing post-infusion monitoring costs.
  • Furthermore, the implementation of systemic biodistribution modeling allows developers to predict genetic vector behavior, increasing preclinical trial success rates by 24%. Healthcare networks that optimize their ex vivo genetic modifications pipelines achieve a 15% reduction in overall processing expenditure by limiting batch failures.
  • Integrating autologous cellular suspensions with standardized treatment protocols enhances operational throughput, ensuring that specialized clinics maintain strict compliance while managing increased therapeutic demand efficiently.

We can help! Our analysts can customize this cell and gene therapy market research report to meet your requirements.

Get in touch

1. Executive Summary

1.1 Market overview

Executive Summary - Chart on Market Overview
Executive Summary - Data Table on Market Overview
Executive Summary - Chart on Global Market Characteristics
Executive Summary - Chart on Market by Geography
Executive Summary - Chart on Market Segmentation by Type
Executive Summary - Chart on Market Segmentation by Application
Executive Summary - Chart on Market Segmentation by End-user
Executive Summary - Chart on Incremental Growth
Executive Summary - Data Table on Incremental Growth
Executive Summary - Chart on Company Market Positioning

2. Technavio Analysis

2.1 Analysis of price sensitivity, lifecycle, customer purchase basket, adoption rates, and purchase criteria

2.2 Criticality of inputs and Factors of differentiation

Chart on Overview on criticality of inputs and factors of differentiation

2.3 Factors of disruption

Chart on Overview on factors of disruption

2.4 Impact of drivers and challenges

Chart on Impact of drivers and challenges in 2025 and 2030

3. Market Landscape

3.1 Market ecosystem

Chart on Parent Market
Data Table on - Parent Market

3.2 Market characteristics

Chart on Market characteristics analysis

3.3 Value chain analysis

Chart on Value chain analysis

4. Market Sizing

4.1 Market definition

Data Table on Offerings of companies included in the market definition

4.2 Market segment analysis

Market segments

4.3 Market size 2025

4.4 Market outlook: Forecast for 2025-2030

Chart on Global - Market size and forecast 2025-2030 ($ million)
Data Table on Global - Market size and forecast 2025-2030 ($ million)
Chart on Global Market: Year-over-year growth 2025-2030 (%)
Data Table on Global Market: Year-over-year growth 2025-2030 (%)

5. Historic Market Size

5.1 Global Cell And Gene Therapy Market 2020 - 2024

Historic Market Size - Data Table on Global Cell And Gene Therapy Market 2020 - 2024 ($ million)

5.2 Type segment analysis 2020 - 2024

Historic Market Size - Type Segment 2020 - 2024 ($ million)

5.3 Application segment analysis 2020 - 2024

Historic Market Size - Application Segment 2020 - 2024 ($ million)

5.4 End-user segment analysis 2020 - 2024

Historic Market Size - End-user Segment 2020 - 2024 ($ million)

5.5 Geography segment analysis 2020 - 2024

Historic Market Size - Geography Segment 2020 - 2024 ($ million)

5.6 Country segment analysis 2020 - 2024

Historic Market Size - Country Segment 2020 - 2024 ($ million)

6. Qualitative Analysis

6.1 Impact of AI on Global Cell and Gene Therapy Market

6.2 Impact of Geopolitical Conflicts on Global Cell and Gene Therapy Market

7. Five Forces Analysis

7.1 Five forces summary

Five forces analysis - Comparison between 2025 and 2030

7.2 Bargaining power of buyers

Bargaining power of buyers - Impact of key factors 2025 and 2030

7.3 Bargaining power of suppliers

Bargaining power of suppliers - Impact of key factors in 2025 and 2030

7.4 Threat of new entrants

Threat of new entrants - Impact of key factors in 2025 and 2030

7.5 Threat of substitutes

Threat of substitutes - Impact of key factors in 2025 and 2030

7.6 Threat of rivalry

Threat of rivalry - Impact of key factors in 2025 and 2030

7.7 Market condition

Chart on Market condition - Five forces 2025 and 2030

8. Market Segmentation by Type

8.1 Market segments

Chart on Type - Market share 2025-2030 (%)
Data Table on Type - Market share 2025-2030 (%)

8.2 Comparison by Type

Chart on Comparison by Type
Data Table on Comparison by Type

8.3 Cell therapy - Market size and forecast 2025-2030

Chart on Cell therapy - Market size and forecast 2025-2030 ($ million)
Data Table on Cell therapy - Market size and forecast 2025-2030 ($ million)
Chart on Cell therapy - Year-over-year growth 2025-2030 (%)
Data Table on Cell therapy - Year-over-year growth 2025-2030 (%)

8.4 Gene therapy - Market size and forecast 2025-2030

Chart on Gene therapy - Market size and forecast 2025-2030 ($ million)
Data Table on Gene therapy - Market size and forecast 2025-2030 ($ million)
Chart on Gene therapy - Year-over-year growth 2025-2030 (%)
Data Table on Gene therapy - Year-over-year growth 2025-2030 (%)

8.5 Market opportunity by Type

Market opportunity by Type ($ million)
Data Table on Market opportunity by Type ($ million)

9. Market Segmentation by Application

9.1 Market segments

Chart on Application - Market share 2025-2030 (%)
Data Table on Application - Market share 2025-2030 (%)

9.2 Comparison by Application

Chart on Comparison by Application
Data Table on Comparison by Application

9.3 Musculoskeletal - Market size and forecast 2025-2030

Chart on Musculoskeletal - Market size and forecast 2025-2030 ($ million)
Data Table on Musculoskeletal - Market size and forecast 2025-2030 ($ million)
Chart on Musculoskeletal - Year-over-year growth 2025-2030 (%)
Data Table on Musculoskeletal - Year-over-year growth 2025-2030 (%)

9.4 Oncology - Market size and forecast 2025-2030

Chart on Oncology - Market size and forecast 2025-2030 ($ million)
Data Table on Oncology - Market size and forecast 2025-2030 ($ million)
Chart on Oncology - Year-over-year growth 2025-2030 (%)
Data Table on Oncology - Year-over-year growth 2025-2030 (%)

9.5 Immunology - Market size and forecast 2025-2030

Chart on Immunology - Market size and forecast 2025-2030 ($ million)
Data Table on Immunology - Market size and forecast 2025-2030 ($ million)
Chart on Immunology - Year-over-year growth 2025-2030 (%)
Data Table on Immunology - Year-over-year growth 2025-2030 (%)

9.6 Dermatology - Market size and forecast 2025-2030

Chart on Dermatology - Market size and forecast 2025-2030 ($ million)
Data Table on Dermatology - Market size and forecast 2025-2030 ($ million)
Chart on Dermatology - Year-over-year growth 2025-2030 (%)
Data Table on Dermatology - Year-over-year growth 2025-2030 (%)

9.7 Others - Market size and forecast 2025-2030

Chart on Others - Market size and forecast 2025-2030 ($ million)
Data Table on Others - Market size and forecast 2025-2030 ($ million)
Chart on Others - Year-over-year growth 2025-2030 (%)
Data Table on Others - Year-over-year growth 2025-2030 (%)

9.8 Market opportunity by Application

Market opportunity by Application ($ million)
Data Table on Market opportunity by Application ($ million)

10. Market Segmentation by End-user

10.1 Market segments

Chart on End-user - Market share 2025-2030 (%)
Data Table on End-user - Market share 2025-2030 (%)

10.2 Comparison by End-user

Chart on Comparison by End-user
Data Table on Comparison by End-user

10.3 Hospitals and clinics - Market size and forecast 2025-2030

Chart on Hospitals and clinics - Market size and forecast 2025-2030 ($ million)
Data Table on Hospitals and clinics - Market size and forecast 2025-2030 ($ million)
Chart on Hospitals and clinics - Year-over-year growth 2025-2030 (%)
Data Table on Hospitals and clinics - Year-over-year growth 2025-2030 (%)

10.4 Specialty clinics - Market size and forecast 2025-2030

Chart on Specialty clinics - Market size and forecast 2025-2030 ($ million)
Data Table on Specialty clinics - Market size and forecast 2025-2030 ($ million)
Chart on Specialty clinics - Year-over-year growth 2025-2030 (%)
Data Table on Specialty clinics - Year-over-year growth 2025-2030 (%)

10.5 Others - Market size and forecast 2025-2030

Chart on Others - Market size and forecast 2025-2030 ($ million)
Data Table on Others - Market size and forecast 2025-2030 ($ million)
Chart on Others - Year-over-year growth 2025-2030 (%)
Data Table on Others - Year-over-year growth 2025-2030 (%)

10.6 Market opportunity by End-user

Market opportunity by End-user ($ million)
Data Table on Market opportunity by End-user ($ million)

11. Customer Landscape

11.1 Customer landscape overview

Analysis of price sensitivity, lifecycle, customer purchase basket, adoption rates, and purchase criteria

12. Geographic Landscape

12.1 Geographic segmentation

Chart on Market share by geography 2025-2030 (%)
Data Table on Market share by geography 2025-2030 (%)

12.2 Geographic comparison

Chart on Geographic comparison
Data Table on Geographic comparison

12.3 North America - Market size and forecast 2025-2030

Chart on North America - Market size and forecast 2025-2030 ($ million)
Data Table on North America - Market size and forecast 2025-2030 ($ million)
Chart on North America - Year-over-year growth 2025-2030 (%)
Data Table on North America - Year-over-year growth 2025-2030 (%)
Chart on Regional Comparison - North America
Data Table on Regional Comparison - North America

12.3.1 US - Market size and forecast 2025-2030

Chart on US - Market size and forecast 2025-2030 ($ million)
Data Table on US - Market size and forecast 2025-2030 ($ million)
Chart on US - Year-over-year growth 2025-2030 (%)
Data Table on US - Year-over-year growth 2025-2030 (%)

12.3.2 Canada - Market size and forecast 2025-2030

Chart on Canada - Market size and forecast 2025-2030 ($ million)
Data Table on Canada - Market size and forecast 2025-2030 ($ million)
Chart on Canada - Year-over-year growth 2025-2030 (%)
Data Table on Canada - Year-over-year growth 2025-2030 (%)

12.3.3 Mexico - Market size and forecast 2025-2030

Chart on Mexico - Market size and forecast 2025-2030 ($ million)
Data Table on Mexico - Market size and forecast 2025-2030 ($ million)
Chart on Mexico - Year-over-year growth 2025-2030 (%)
Data Table on Mexico - Year-over-year growth 2025-2030 (%)

12.4 Europe - Market size and forecast 2025-2030

Chart on Europe - Market size and forecast 2025-2030 ($ million)
Data Table on Europe - Market size and forecast 2025-2030 ($ million)
Chart on Europe - Year-over-year growth 2025-2030 (%)
Data Table on Europe - Year-over-year growth 2025-2030 (%)
Chart on Regional Comparison - Europe
Data Table on Regional Comparison - Europe

12.4.1 Germany - Market size and forecast 2025-2030

Chart on Germany - Market size and forecast 2025-2030 ($ million)
Data Table on Germany - Market size and forecast 2025-2030 ($ million)
Chart on Germany - Year-over-year growth 2025-2030 (%)
Data Table on Germany - Year-over-year growth 2025-2030 (%)

12.4.2 UK - Market size and forecast 2025-2030

Chart on UK - Market size and forecast 2025-2030 ($ million)
Data Table on UK - Market size and forecast 2025-2030 ($ million)
Chart on UK - Year-over-year growth 2025-2030 (%)
Data Table on UK - Year-over-year growth 2025-2030 (%)

12.4.3 France - Market size and forecast 2025-2030

Chart on France - Market size and forecast 2025-2030 ($ million)
Data Table on France - Market size and forecast 2025-2030 ($ million)
Chart on France - Year-over-year growth 2025-2030 (%)
Data Table on France - Year-over-year growth 2025-2030 (%)

12.4.4 Italy - Market size and forecast 2025-2030

Chart on Italy - Market size and forecast 2025-2030 ($ million)
Data Table on Italy - Market size and forecast 2025-2030 ($ million)
Chart on Italy - Year-over-year growth 2025-2030 (%)
Data Table on Italy - Year-over-year growth 2025-2030 (%)

12.4.5 Spain - Market size and forecast 2025-2030

Chart on Spain - Market size and forecast 2025-2030 ($ million)
Data Table on Spain - Market size and forecast 2025-2030 ($ million)
Chart on Spain - Year-over-year growth 2025-2030 (%)
Data Table on Spain - Year-over-year growth 2025-2030 (%)

12.4.6 The Netherlands - Market size and forecast 2025-2030

Chart on The Netherlands - Market size and forecast 2025-2030 ($ million)
Data Table on The Netherlands - Market size and forecast 2025-2030 ($ million)
Chart on The Netherlands - Year-over-year growth 2025-2030 (%)
Data Table on The Netherlands - Year-over-year growth 2025-2030 (%)

12.5 Asia - Market size and forecast 2025-2030

Chart on Asia - Market size and forecast 2025-2030 ($ million)
Data Table on Asia - Market size and forecast 2025-2030 ($ million)
Chart on Asia - Year-over-year growth 2025-2030 (%)
Data Table on Asia - Year-over-year growth 2025-2030 (%)
Chart on Regional Comparison - Asia
Data Table on Regional Comparison - Asia

12.5.1 China - Market size and forecast 2025-2030

Chart on China - Market size and forecast 2025-2030 ($ million)
Data Table on China - Market size and forecast 2025-2030 ($ million)
Chart on China - Year-over-year growth 2025-2030 (%)
Data Table on China - Year-over-year growth 2025-2030 (%)

12.5.2 Japan - Market size and forecast 2025-2030

Chart on Japan - Market size and forecast 2025-2030 ($ million)
Data Table on Japan - Market size and forecast 2025-2030 ($ million)
Chart on Japan - Year-over-year growth 2025-2030 (%)
Data Table on Japan - Year-over-year growth 2025-2030 (%)

12.5.3 South Korea - Market size and forecast 2025-2030

Chart on South Korea - Market size and forecast 2025-2030 ($ million)
Data Table on South Korea - Market size and forecast 2025-2030 ($ million)
Chart on South Korea - Year-over-year growth 2025-2030 (%)
Data Table on South Korea - Year-over-year growth 2025-2030 (%)

12.5.4 India - Market size and forecast 2025-2030

Chart on India - Market size and forecast 2025-2030 ($ million)
Data Table on India - Market size and forecast 2025-2030 ($ million)
Chart on India - Year-over-year growth 2025-2030 (%)
Data Table on India - Year-over-year growth 2025-2030 (%)

12.5.5 Taiwan - Market size and forecast 2025-2030

Chart on Taiwan - Market size and forecast 2025-2030 ($ million)
Data Table on Taiwan - Market size and forecast 2025-2030 ($ million)
Chart on Taiwan - Year-over-year growth 2025-2030 (%)
Data Table on Taiwan - Year-over-year growth 2025-2030 (%)

12.5.6 Singapore - Market size and forecast 2025-2030

Chart on Singapore - Market size and forecast 2025-2030 ($ million)
Data Table on Singapore - Market size and forecast 2025-2030 ($ million)
Chart on Singapore - Year-over-year growth 2025-2030 (%)
Data Table on Singapore - Year-over-year growth 2025-2030 (%)

12.6 Rest of World (ROW) - Market size and forecast 2025-2030

Chart on Rest of World (ROW) - Market size and forecast 2025-2030 ($ million)
Data Table on Rest of World (ROW) - Market size and forecast 2025-2030 ($ million)
Chart on Rest of World (ROW) - Year-over-year growth 2025-2030 (%)
Data Table on Rest of World (ROW) - Year-over-year growth 2025-2030 (%)
Chart on Regional Comparison - Rest of World (ROW)
Data Table on Regional Comparison - Rest of World (ROW)

12.6.1 Brazil - Market size and forecast 2025-2030

Chart on Brazil - Market size and forecast 2025-2030 ($ million)
Data Table on Brazil - Market size and forecast 2025-2030 ($ million)
Chart on Brazil - Year-over-year growth 2025-2030 (%)
Data Table on Brazil - Year-over-year growth 2025-2030 (%)

12.6.2 Saudi Arabia - Market size and forecast 2025-2030

Chart on Saudi Arabia - Market size and forecast 2025-2030 ($ million)
Data Table on Saudi Arabia - Market size and forecast 2025-2030 ($ million)
Chart on Saudi Arabia - Year-over-year growth 2025-2030 (%)
Data Table on Saudi Arabia - Year-over-year growth 2025-2030 (%)

12.6.3 South Africa - Market size and forecast 2025-2030

Chart on South Africa - Market size and forecast 2025-2030 ($ million)
Data Table on South Africa - Market size and forecast 2025-2030 ($ million)
Chart on South Africa - Year-over-year growth 2025-2030 (%)
Data Table on South Africa - Year-over-year growth 2025-2030 (%)

12.6.4 Argentina - Market size and forecast 2025-2030

Chart on Argentina - Market size and forecast 2025-2030 ($ million)
Data Table on Argentina - Market size and forecast 2025-2030 ($ million)
Chart on Argentina - Year-over-year growth 2025-2030 (%)
Data Table on Argentina - Year-over-year growth 2025-2030 (%)

12.6.5 UAE - Market size and forecast 2025-2030

Chart on UAE - Market size and forecast 2025-2030 ($ million)
Data Table on UAE - Market size and forecast 2025-2030 ($ million)
Chart on UAE - Year-over-year growth 2025-2030 (%)
Data Table on UAE - Year-over-year growth 2025-2030 (%)

12.6.6 Israel - Market size and forecast 2025-2030

Chart on Israel - Market size and forecast 2025-2030 ($ million)
Data Table on Israel - Market size and forecast 2025-2030 ($ million)
Chart on Israel - Year-over-year growth 2025-2030 (%)
Data Table on Israel - Year-over-year growth 2025-2030 (%)

12.6.7 Egypt - Market size and forecast 2025-2030

Chart on Egypt - Market size and forecast 2025-2030 ($ million)
Data Table on Egypt - Market size and forecast 2025-2030 ($ million)
Chart on Egypt - Year-over-year growth 2025-2030 (%)
Data Table on Egypt - Year-over-year growth 2025-2030 (%)

12.6.8 Chile - Market size and forecast 2025-2030

Chart on Chile - Market size and forecast 2025-2030 ($ million)
Data Table on Chile - Market size and forecast 2025-2030 ($ million)
Chart on Chile - Year-over-year growth 2025-2030 (%)
Data Table on Chile - Year-over-year growth 2025-2030 (%)

12.7 Market opportunity by geography

Market opportunity by geography ($ million)
Data Tables on Market opportunity by geography ($ million)

13. Drivers, Challenges, and Opportunity

13.1 Market drivers

Expansion of therapeutic applications and resolution of unmet medical needs
Technological innovation in genetic engineering and delivery mechanisms
Strategic financial influx and evolution of regulatory support frameworks

13.2 Market challenges

Financial and reimbursement barriers to patient accessibility
Manufacturing complexity and scalability of specialized workflows
Regulatory divergence and burden of long-term clinical monitoring

13.3 Impact of drivers and challenges

Impact of drivers and challenges in 2025 and 2030

13.4 Market opportunities

Transition toward allogeneic or off shelf therapeutic platforms
Adoption of AI and digital twin technologies in genetic research
Decentralization of manufacturing and rise of point of care facilities

14. Competitive Landscape

14.1 Overview

14.2

Overview on criticality of inputs and factors of differentiation

14.3 Landscape disruption

Overview on factors of disruption

14.4 Industry risks

Impact of key risks on business

15. Competitive Analysis

15.1 Companies profiled

Companies covered

15.2 Company ranking index

15.3 Market positioning of companies

Matrix on companies position and classification

15.4 BioMarin Pharmaceutical Inc.

BioMarin Pharmaceutical Inc. - Overview
BioMarin Pharmaceutical Inc. - Business segments
BioMarin Pharmaceutical Inc. - Key offerings
BioMarin Pharmaceutical Inc. - Segment focus
SWOT

15.5 Bristol Myers Squibb Co.

Bristol Myers Squibb Co. - Overview
Bristol Myers Squibb Co. - Product / Service
Bristol Myers Squibb Co. - Key news
Bristol Myers Squibb Co. - Key offerings
SWOT

15.6 Catalent Inc.

Catalent Inc. - Overview
Catalent Inc. - Product / Service
Catalent Inc. - Key offerings
SWOT

15.7 Charles River Laboratories

Charles River Laboratories - Overview
Charles River Laboratories - Business segments
Charles River Laboratories - Key offerings
Charles River Laboratories - Segment focus
SWOT

15.8 CSL Behring

CSL Behring - Overview
CSL Behring - Product / Service
CSL Behring - Key offerings
SWOT

15.9 Danaher Corp.

Danaher Corp. - Overview
Danaher Corp. - Business segments
Danaher Corp. - Key news
Danaher Corp. - Key offerings
Danaher Corp. - Segment focus
SWOT

15.10 Ferring BV

Ferring BV - Overview
Ferring BV - Product / Service
Ferring BV - Key offerings
SWOT

15.11 Genentech Inc.

Genentech Inc. - Overview
Genentech Inc. - Product / Service
Genentech Inc. - Key offerings
SWOT

15.12 Gilead Sciences Inc.

Gilead Sciences Inc. - Overview
Gilead Sciences Inc. - Business segments
Gilead Sciences Inc. - Key news
Gilead Sciences Inc. - Key offerings
Gilead Sciences Inc. - Segment focus
SWOT

15.13 Johnson and Johnson

Johnson and Johnson - Overview
Johnson and Johnson - Business segments
Johnson and Johnson - Key news
Johnson and Johnson - Key offerings
Johnson and Johnson - Segment focus
SWOT

15.14 Lonza Group Ltd.

Lonza Group Ltd. - Overview
Lonza Group Ltd. - Business segments
Lonza Group Ltd. - Key news
Lonza Group Ltd. - Key offerings
Lonza Group Ltd. - Segment focus
SWOT

15.15 Novartis AG

Novartis AG - Overview
Novartis AG - Business segments
Novartis AG - Key news
Novartis AG - Key offerings
Novartis AG - Segment focus
SWOT

15.16 Pfizer Inc.

Pfizer Inc. - Overview
Pfizer Inc. - Business segments
Pfizer Inc. - Key news
Pfizer Inc. - Key offerings
Pfizer Inc. - Segment focus
SWOT

15.17 Thermo Fisher Scientific Inc.

Thermo Fisher Scientific Inc. - Overview
Thermo Fisher Scientific Inc. - Business segments
Thermo Fisher Scientific Inc. - Key news
Thermo Fisher Scientific Inc. - Key offerings
Thermo Fisher Scientific Inc. - Segment focus
SWOT

15.18 Vertex Pharmaceuticals Inc.

Vertex Pharmaceuticals Inc. - Overview
Vertex Pharmaceuticals Inc. - Product / Service
Vertex Pharmaceuticals Inc. - Key offerings
SWOT

16. Appendix

16.1 Scope of the report

Market definition
Objectives
Notes and caveats

16.2 Inclusions and exclusions checklist

Inclusions checklist
Exclusions checklist

16.3 Currency conversion rates for US$

16.4 Research methodology

16.5 Data procurement

Information sources

16.6 Data validation

16.7 Validation techniques employed for market sizing

16.8 Data synthesis

16.9 360 degree market analysis

16.10 List of abbreviations

Research Methodology

Technavio presents a detailed picture of the market by way of study, synthesis, and summation of data from multiple sources. The analysts have presented the various facets of the market with a particular focus on identifying the key industry influencers. The data thus presented is comprehensive, reliable, and the result of extensive research, both primary and secondary.

INFORMATION SOURCES

Primary sources

  • Manufacturers and suppliers
  • Channel partners
  • Industry experts
  • Strategic decision makers

Secondary sources

  • Industry journals and periodicals
  • Government data
  • Financial reports of key industry players
  • Historical data
  • Press releases

DATA ANALYSIS

Data Synthesis

  • Collation of data
  • Estimation of key figures
  • Analysis of derived insights

Data Validation

  • Triangulation with data models
  • Reference against proprietary databases
  • Corroboration with industry experts

REPORT WRITING

Qualitative

  • Market drivers
  • Market challenges
  • Market trends
  • Five forces analysis

Quantitative

  • Market size and forecast
  • Market segmentation
  • Geographical insights
  • Competitive landscape

Interested in this report?

Get your sample now to see our research methodology and insights!

Download Now

Frequently Asked Questions

Cell And Gene Therapy market growth will increase by USD 11370.5 million during 2026-2030.

The Cell And Gene Therapy market is expected to grow at a CAGR of 18.6% during 2026-2030.

Cell And Gene Therapy market is segmented by Type (Cell therapy, Gene therapy) Application (Musculoskeletal, Oncology, Immunology, Dermatology, Others) End-user (Hospitals and clinics, Specialty clinics, Others)

Autolus Therapeutics plc, BioMarin Pharmaceutical Inc., bluebird bio Inc., Bristol Myers Squibb Co., Catalent Inc., Charles River Laboratories, CRISPR Therapeutics AG, CSL Behring, Danaher Corp., Dendreon Pharmaceuticals LLC, Ferring BV, Genentech Inc., Gilead Sciences Inc., IOVANCE Biotherapeutics Inc., Johnson and Johnson, Lonza Group Ltd., Novartis AG, Pfizer Inc., Thermo Fisher Scientific Inc., Vertex Pharmaceuticals Inc. are a few of the key vendors in the Cell And Gene Therapy market.

North America will register the highest growth rate of 43.2% among the other regions. Therefore, the Cell And Gene Therapy market in North America is expected to garner significant business opportunities for the vendors during the forecast period.

US, Canada, Mexico, Germany, UK, France, Italy, Spain, The Netherlands, China, Japan, South Korea, India, Taiwan, Singapore, Brazil, Saudi Arabia, South Africa, Argentina, UAE, Israel, Egypt, Chile

  • Expansion of therapeutic applications and resolution of unmet medical needs is the driving factor this market.

The Cell And Gene Therapy market vendors should focus on grabbing business opportunities from the Type segment as it accounted for the largest market share in the base year.
RIA - Research AI Assistant
Ask RIA
