
Canned Lychee Market Size and Growth Forecast 2026-2030
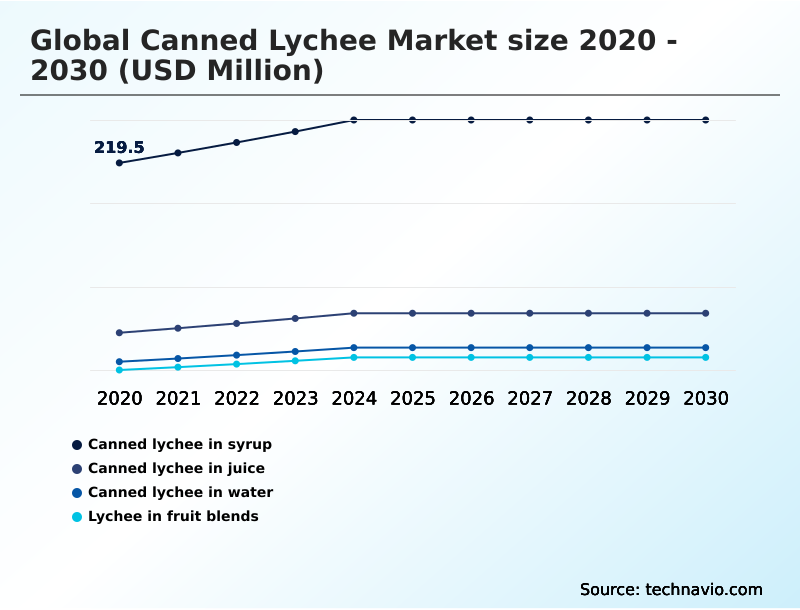
The Canned Lychee Market size was valued at USD 471.6 million in 2025 growing at a CAGR of 5.3% during the forecast period 2026-2030.
APAC accounts for 61.2% of incremental growth during the forecast period. The Canned lychee in syrup segment by Product Type was valued at USD 257.3 million in 2024, while the Drinks and beverages segment holds the largest revenue share by Application.
The market is projected to grow by USD 240.6 million from 2020 to 2030, with USD 139.9 million of the growth expected during the forecast period of 2025 to 2030.

Get Key Insights on Market Forecast (PDF) Request Free Sample
Canned Lychee Market Overview
The canned lychee market is defined by a consistent demand for shelf-stable fruit products, driven by the HORECA sector fruit supply and global culinary diversification. With the APAC region contributing 61.2 to the market's incremental growth, production is concentrated and subject to pressures for modernization to meet international food safety standards. The industry is navigating a shift toward clean label canned goods, which challenges traditional preservation methods. For instance, a mid-sized canning facility in Southeast Asia, aiming for export to European markets, recently upgraded its production line by replacing older retort systems with advanced thermal processing technology coupled with automated quality control in canning. This investment, guided by EU Regulation (EC) No 852/2004 on the hygiene of foodstuffs, enabled the facility to reduce processing times while ensuring superior flavor retention and compliance, thereby securing contracts with premium distributors seeking reliable, high-quality ingredients. This scenario highlights the operational pivot from volume to value, where technological adoption in areas like enzymatic browning prevention and peel and pit removal is crucial for maintaining competitive advantage and meeting the stringent requirements of a globalized food system.
Drivers, Trends, and Challenges in the Canned Lychee Market
Procurement decisions in the canned lychee market are increasingly complex, shaped by inquiries into canned lychee vs fresh lychee nutrition and the impact of thermal processing on lychee texture. Food service buyers are now scrutinizing the canned lychee heavy syrup sugar content to align with public health directives, driving manufacturers to explore lychee preservation methods without sugar.
This shift is governed by strict import regulations for canned tropical fruits, such as the FDA's Food Safety Modernization Act (FSMA), which mandates verifiable preventive controls throughout the supply chain. For example, a processing facility aiming to produce bpa-free canned lychee brands for the US market must implement a detailed Hazard Analysis and Critical Control Points (HACCP) plan.
This plan would address everything from raw material sourcing and the role of citric acid in fruit preservation to optimizing retort processing for lychees.
Such facilities often see a 10-15% higher initial capital outlay for advanced vacuum sealing and traceability systems compared to conventional operations, but benefit from significantly lower risk of costly product recalls and greater access to premium retail channels that prioritize traceability in the canned fruit supply chain.
These operational demands highlight the challenges in sourcing lychee for canning and the critical need for technological advances in fruit pitting to maintain profitability.
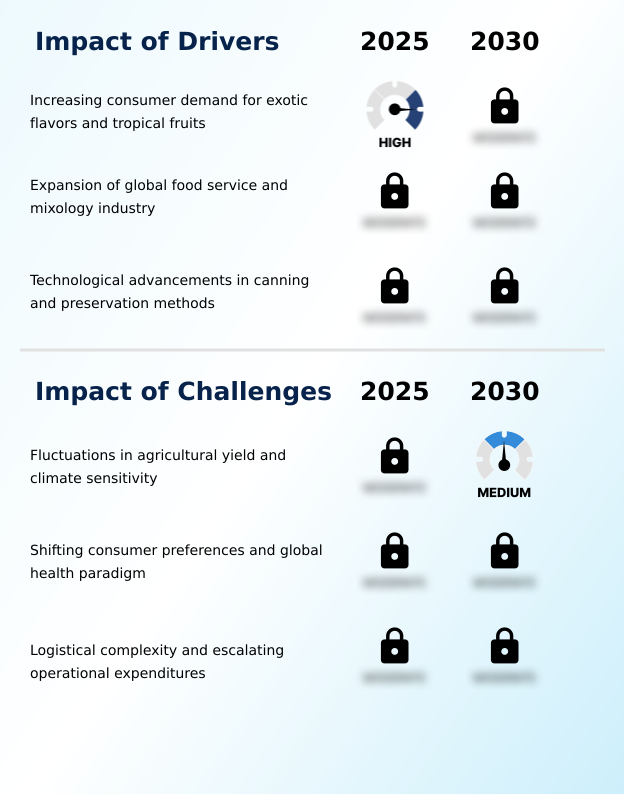
Primary Growth Driver: The primary market driver is the increasing consumer demand for exotic flavors and tropical fruits, fueled by the globalization of culinary trends and the expansion of international cuisines.
Demand is strongly propelled by the HORECA sector fruit supply, where canned lychee's consistency in size and flavor is critical for large-scale operations.
The drinks and beverages application, which constitutes the largest market segment, heavily relies on the product as a core component for exotic fruit ingredients in signature cocktails and premium non-alcoholic drinks.
The burgeoning mixology scene values the fruit and its syrup as essential mixology ingredients for creating complex flavor profiles that fresh, seasonal fruit cannot reliably provide.
This driver is amplified by the global consumer's growing appetite for unique culinary experiences, positioning canned lychee as a staple for innovative dessert preparation and beverage menu development in food service supply chains.
Emerging Market Trend: A significant market trend is the growing emphasis on sustainable packaging solutions. This shift is driven by circular economy principles and increasing consumer and regulatory demand for environmental responsibility.
Market evolution is characterized by a pronounced shift toward clean label canned goods and sustainable food packaging, driven by consumer health consciousness and regulatory pressures like the EU's single-use plastics directive. Manufacturers are increasingly adopting natural juice packing and water-based preservation to reduce sugar content, moving away from traditional heavy syrups.
This pivot necessitates investment in advanced preservation methods such as aseptic packaging to maintain shelf stability and sensory attributes. Concurrently, the adoption of BPA-free linings has become a non-negotiable food safety standard, compelling a full-scale review of material sourcing and supply chain compliance to meet the expectations for safer and more environmentally responsible products.
Key Industry Challenge: A key challenge constraining industry growth is the inherent fluctuation in agricultural yields, a direct consequence of the climate sensitivity of lychee cultivation in geographically concentrated regions.
Significant headwinds arise from the agricultural vulnerability of lychee cultivation, which is highly concentrated in specific APAC regions contributing over 61% of incremental growth. This geographic dependency exposes the entire global food supply chain to risks from climate sensitivity, as slight variations in weather can decimate harvests.
These upstream issues are compounded by logistical complexities in post-harvest handling and the high cost of cold chain logistics for export. Furthermore, the industry grapples with the challenge of lychee cultivar selection, as not all varieties are suitable for the rigors of thermal processing, creating a bottleneck in sourcing adequate raw material volumes.
Explore Full Market Dynamics Analysis Request Free Sample
Canned Lychee Market Segmentation
The canned lychee industry research report provides comprehensive data including region-wise segment analysis, with forecasts and analysis for the period 2026-2030, as well as historical data from 2020-2024 for the following segments.
Product Type Segment Analysis
The canned lychee in syrup segment is estimated to witness significant growth during the forecast period.
The canned lychee in syrup segment represents the most established market category, commanding the largest share of sales with 267.7 million in 2025.
This format utilizes heavy syrup preservation, a traditional method where the canning syrup formulation serves to maintain the fruit's structural integrity and enhance its floral notes.
Its prevalence is anchored in the food service supply chain, where consistency in sweetness and texture is paramount for professional dessert preparation.
Furthermore, the syrup itself is a valued component in the beverage industry, acting as a ready-made base for mixology ingredients in cocktails and non-alcoholic drinks, ensuring flavor uniformity and operational efficiency in high-volume settings.
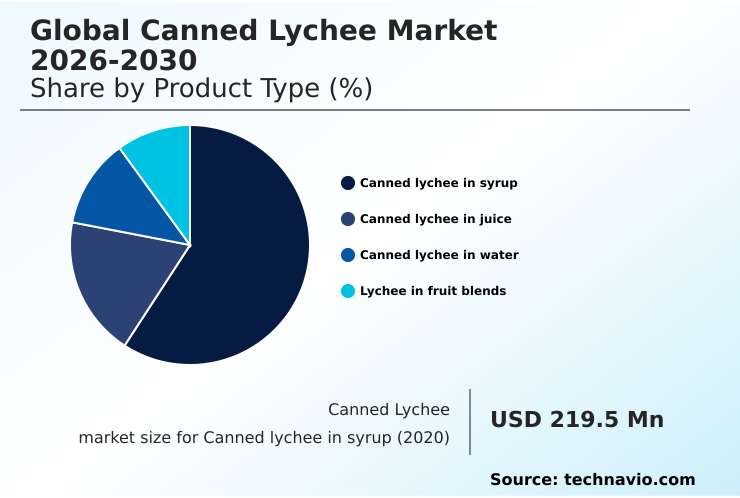
The Canned lychee in syrup segment was valued at USD 257.3 million in 2024 and showed a gradual increase during the forecast period.
Canned Lychee Market by Region: APAC Leads with 61.2% Growth Share
APAC is estimated to contribute 61.2% to the growth of the global market during the forecast period.

The market's geographic landscape is dominated by the APAC region, which accounts for over 61% of the global opportunity, serving as both the primary production base and a major consumption center.
Countries in this region are modernizing processing hubs to meet stringent international food safety standards.
In contrast, North America, representing approximately 15% of the market, and Europe demonstrate mature demand driven by the integration of canned tropical fruits into mainstream retail and the HORECA sector fruit supply.
In these Western markets, canned lychee is increasingly positioned as one of the gourmet food ingredients, valued for its consistency in high-end beverage and dessert applications, reflecting a shift from a niche ethnic product to a staple in global gastronomy.
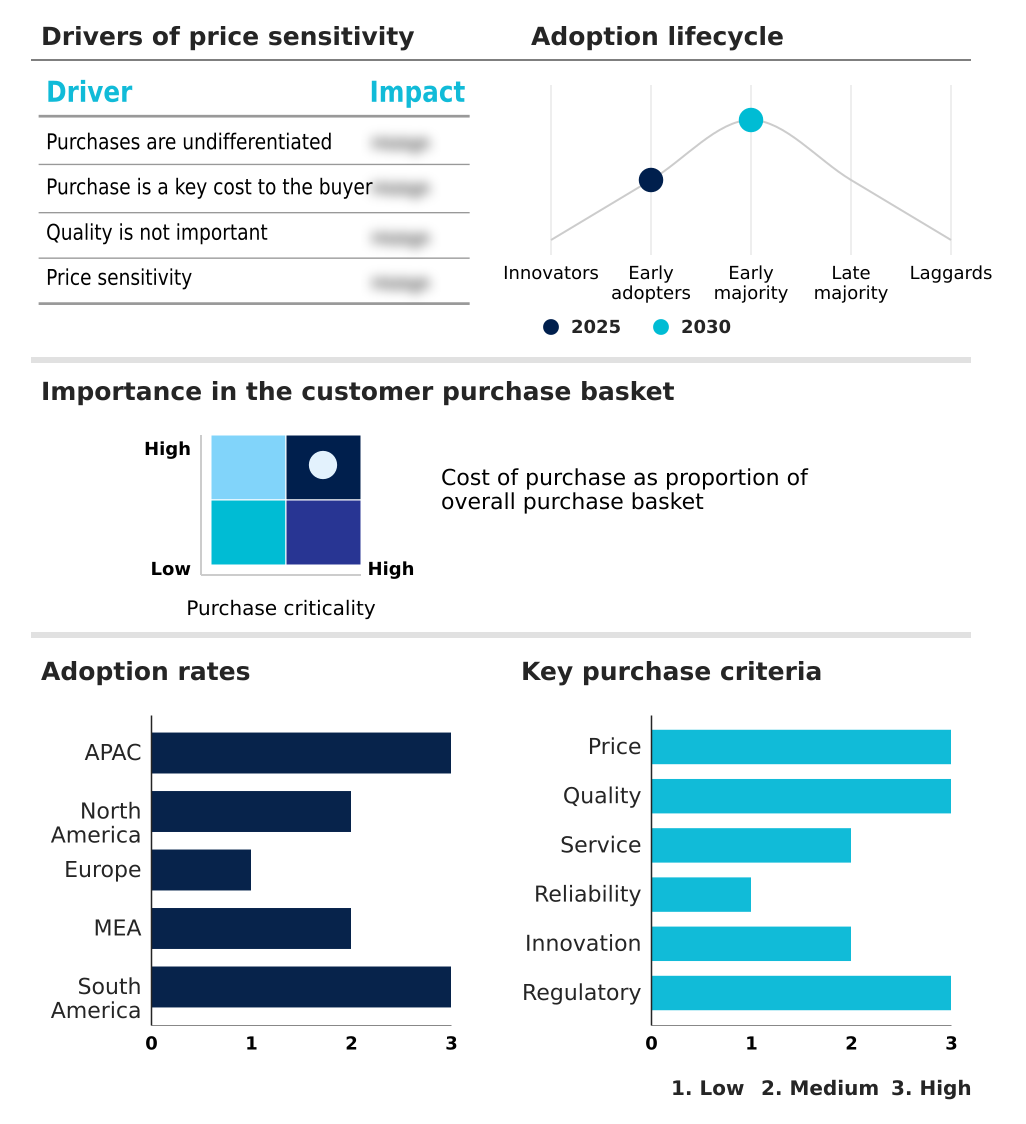
Customer Landscape Analysis for the Canned Lychee Market
The canned lychee market forecasting report includes the adoption lifecycle of the market, covering from the innovator’s stage to the laggard’s stage. It focuses on adoption rates in different regions based on penetration. Furthermore, the canned lychee market report also includes key purchase criteria and drivers of price sensitivity to help companies evaluate and develop their market growth analysis strategies.
Competitive Landscape of the Canned Lychee Market
Companies are implementing various strategies, such as strategic alliances, partnerships, mergers and acquisitions, geographical expansion, and product/service launches, to enhance their presence in the canned lychee market industry.
China Kunyu Co.Ltd - This entity provides a diverse portfolio of processed fruit and vegetable ingredients, including purees and concentrates, for the global food and beverage industry.
The industry research and growth report includes detailed analyses of the competitive landscape of the market and information about key companies, including:
- China Kunyu Co.Ltd
- Del Monte Foods Inc.
- Dole plc
- Fujian Zishan Group Co.Ltd.
- HAGIMEX JSC
- Halong Canfoco.
- Hock Seng Food Pte. Ltd.
- Kangfa food
- Malee Group Public Co.Ltd.
- NAWON Food and Beverage Co.
- Qingdao Countree Food Co.Ltd.
- Sun Impex International LLC
- Thai Agri Foods Public Co. Ltd.
- Viet D.E.L.T.A Co.Ltd.
- Zhongshan Jolion Co.Ltd.
Qualitative and quantitative analysis of companies has been conducted to help clients understand the wider business environment as well as the strengths and weaknesses of key industry players. Data is qualitatively analyzed to categorize companies as pure play, category-focused, industry-focused, and diversified; it is quantitatively analyzed to categorize companies as dominant, leading, strong, tentative, and weak.
Recent Developments in the Canned Lychee Market
- In February 2025, a leading North American retail consortium launched a nationwide Global Tropical Harvest initiative designed to promote preserved exotic fruits through educational cooking demonstrations and targeted digital marketing campaigns.
- In June 2025, the World Health Organization published updated dietary guidelines that categorized fruits in high-sugar syrups as high-risk commodities, prompting major retail chains in the European Union to reconsider shelf placement.
- In August 2025, a prominent food technology institute in Vietnam finalized a patent for a novel flash-pasteurization technique that utilizes natural citrus extracts as a preservative for canned lychees, allowing the fruit to maintain color and texture for up to twenty-four months.
- In October 2025, a major international logistics conglomerate based in Singapore implemented a structural green-fuel surcharge for all containerized shipments originating from Southeast Asian ports to comply with new carbon neutrality mandates, impacting the landed cost of preserved tropical fruits.
Research Analyst Overview: Canned Lychee Market
The canned lychee market is navigating a complex interplay of agricultural volatility and evolving regulatory demands, posting a year-over-year growth of 5.1%. Boardroom-level strategy is now centered on de-risking the supply chain, as inconsistent raw material quality directly impacts the efficacy of thermal processing and final product consistency.
A key focus is compliance with material safety regulations like the EU's REACH, which governs the use of substances in packaging, making the transition to certified BPA-free linings a critical R&D and procurement priority. This mandates significant investment in quality control in canning and re-validating tinplate corrosion resistance to prevent product spoilage.
Decisions on capital expenditure for technologies like high-pressure processing or automated sorting systems are no longer just about efficiency; they are strategic imperatives to secure access to high-margin markets that demand superior food safety standards and verifiable clean-label attributes, moving beyond simple light syrup preservation to more sophisticated fruit preservation techniques.
Dive into Technavio’s robust research methodology, blending expert interviews, extensive data synthesis, and validated models for unparalleled Canned Lychee Market insights. See full methodology.
| Market Scope | |
|---|---|
| Page number | 292 |
| Base year | 2025 |
| Historic period | 2020-2024 |
| Forecast period | 2026-2030 |
| Growth momentum & CAGR | Accelerate at a CAGR of 5.3% |
| Market growth 2026-2030 | USD 139.9 million |
| Market structure | Fragmented |
| YoY growth 2025-2026(%) | 5.1% |
| Key countries | China, India, Japan, South Korea, Australia, Taiwan, US, Canada, Mexico, Germany, UK, France, Italy, Spain, The Netherlands, Saudi Arabia, UAE, South Africa, Israel, Turkey, Brazil, Argentina and Chile |
| Competitive landscape | Leading Companies, Market Positioning of Companies, Competitive Strategies, and Industry Risks |
Canned Lychee Market: Key Questions Answered in This Report
-
What is the expected growth of the Canned Lychee Market between 2026 and 2030?
-
The Canned Lychee Market is expected to grow by USD 139.9 million during 2026-2030, registering a CAGR of 5.3%. Year-over-year growth in 2026 is estimated at 5.1%%. This acceleration is shaped by increasing consumer demand for exotic flavors and tropical fruits, which is intensifying demand across multiple end-use verticals covered in the report.
-
-
What segmentation does the market report cover?
-
The report is segmented by Product Type (Canned lychee in syrup, Canned lychee in juice, Canned lychee in water, and Lychee in fruit blends), Application (Drinks and beverages, Desserts, and Snacks ), Distribution Channel (Offline, and Online) and Geography (APAC, North America, Europe, Middle East and Africa, South America). Among these, the Canned lychee in syrup segment is estimated to witness significant growth during the forecast period, driven by rising adoption across key application areas. Each segment includes detailed qualitative and quantitative analysis, along with historical data from 2020-2024 and forecasts through 2030 with year-over-year growth rates.
-
-
Which regions are analyzed in the report?
-
The report covers APAC, North America, Europe, Middle East and Africa and South America. APAC is estimated to contribute 61.2% to market growth during the forecast period. Country-level analysis includes China, India, Japan, South Korea, Australia, Taiwan, US, Canada, Mexico, Germany, UK, France, Italy, Spain, The Netherlands, Saudi Arabia, UAE, South Africa, Israel, Turkey, Brazil, Argentina and Chile, with dedicated market size tables and year-over-year growth for each.
-
-
What are the key growth drivers and market challenges?
-
The primary driver is increasing consumer demand for exotic flavors and tropical fruits, which is accelerating investment and industry demand. The main challenge is fluctuations in agricultural yield and climate sensitivity, creating operational barriers for key market participants. The report quantifies the impact of each driver and challenge across 2026 and 2030 with comparative analysis.
-
-
Who are the major players in the Canned Lychee Market?
-
Key vendors include China Kunyu Co.Ltd, Del Monte Foods Inc., Dole plc, Fujian Zishan Group Co.Ltd., HAGIMEX JSC, Halong Canfoco., Hock Seng Food Pte. Ltd., Kangfa food, Malee Group Public Co.Ltd., NAWON Food and Beverage Co., Qingdao Countree Food Co.Ltd., Sun Impex International LLC, Thai Agri Foods Public Co. Ltd., Viet D.E.L.T.A Co.Ltd. and Zhongshan Jolion Co.Ltd.. The report provides qualitative and quantitative analysis categorizing companies as dominant, leading, strong, tentative, and weak based on their market positioning. Company profiles include business segment analysis, SWOT assessment, key offerings, and recent strategic developments.
-
Canned Lychee Market Research Insights
Market dynamics are shaped by evolving consumer preferences and stringent regulatory oversight. While demand for canned tropical fruits is expanding globally, growth varies by region, with APAC registering a 5.7% CAGR compared to Europe's 4.7%, reflecting different stages of market maturity.
The expansion of culinary applications of lychee in the West, particularly within the HORECA sector fruit supply, creates significant opportunities. However, processors must navigate complex compliance frameworks, such as the FDA's Foreign Supplier Verification Programs (FSVP) under the Food Safety Modernization Act (FSMA).
This requires robust traceability and quality control systems to ensure that all imported products, including those positioned as gourmet food ingredients, meet US safety benchmarks, adding a layer of operational complexity for exporters targeting this high-value market.
We can help! Our analysts can customize this canned lychee market research report to meet your requirements.
 RIA -
RIA - 
