
Civil Helicopter MRO Market Size 2025-2029
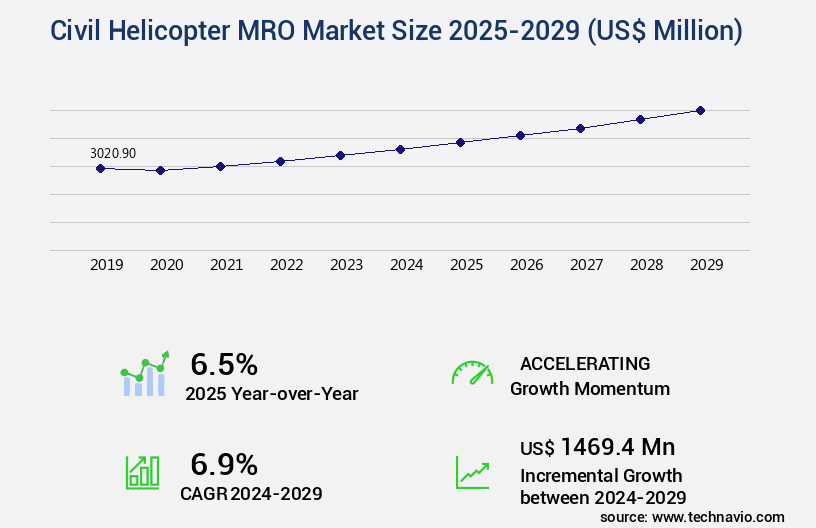
The civil helicopter MRO market size is forecast to increase by USD 1.47 billion, at a CAGR of 6.9% between 2024 and 2029.
- The civil helicopter Maintenance, Repair, and Overhaul (MRO) market is experiencing significant growth, driven by the increasing commercial utilization of helicopters. This trend is particularly evident in sectors such as oil and gas, emergency medical services, and search and rescue operations. A notable development shaping the market is the growing demand for digital MRO solutions. This shift towards digitization is aimed at enhancing operational efficiency, reducing downtime, and improving maintenance quality. By doing so, they can streamline their operations, improve customer satisfaction, and maintain a competitive edge in the evolving civil helicopter MRO landscape.
- To capitalize on market opportunities and navigate these challenges effectively, companies must focus on developing cost-effective digital solutions and fostering strategic partnerships with industry experts. However, the high cost of helicopter maintenance remains a formidable challenge for market participants. This obstacle is compounded by the complex nature of helicopter repair and maintenance, which necessitates specialized expertise and advanced technology. Additive manufacturing, helicopter safety initiatives, and industry collaboration are key elements of the evolving MRO ecosystem.
What will be the Size of the Civil Helicopter MRO Market during the forecast period?
Get Key Insights on Market Forecast (PDF) Request Free Sample
- The market demonstrates a continuous and evolving nature, driven by the diverse applications across various sectors such as oil and gas, emergency medical services, and law enforcement. Transmission repair, dynamic component balancing, and regulatory compliance audits are among the essential services that helicopter operators require to maintain their fleets' optimal performance and safety. Moreover, predictive maintenance models and component lifecycle management have gained significant traction in recent years, enabling helicopter operators to minimize downtime and reduce maintenance costs. For instance, a leading helicopter operator reported a 20% reduction in unscheduled maintenance through the implementation of predictive maintenance strategies.
- The market is expected to grow at a robust pace, with industry experts projecting a growth rate of over 5% per annum. This expansion is fueled by the increasing demand for advanced technologies such as corrosion prevention methods, avionics system upgrades, and turbine engine diagnostics. Helicopter operators prioritize safety and regulatory compliance, necessitating regular airframe inspection procedures, landing gear inspection, rotor blade repair, and electrical system troubleshooting. Certified mechanics, skilled in aeronautical engineering expertise and composite repair techniques, are in high demand to meet these requirements. Maintenance scheduling optimization, hydraulic system maintenance, powerplant overhaul, and non-destructive testing are other critical services that helicopter MRO providers offer to ensure the structural integrity of helicopters.
- Specialized tooling, maintenance tracking software, engine repair services, and maintenance hangar facilities are essential components of an effective MRO strategy. In summary, the market is a dynamic and ever-evolving landscape, with operators continually seeking innovative solutions to optimize fleet performance, reduce costs, and ensure regulatory compliance. The integration of advanced technologies, a skilled workforce, and specialized services will continue to shape the market's growth trajectory. Commercial airlines schedule overhauls based on operating hours or regulatory requirements.
How is this Civil Helicopter MRO Industry segmented?
The civil helicopter MRO industry research report provides comprehensive data (region-wise segment analysis), with forecasts and estimates in "USD million" for the period 2025-2029, as well as historical data from 2019-2023 for the following segments.
- End-user
- Commercial
- Private
- Type
- Airframe heavy maintenance
- Engine maintenance
- Component maintenance
- Service
- Scheduled maintenance
- Unscheduled repairs
- Predictive diagnostics
- Geography
- North America
- US
- Canada
- Europe
- France
- Germany
- Italy
- UK
- APAC
- China
- India
- Japan
- South Korea
- Rest of World (ROW)
- North America
By End-user Insights
The Commercial segment is estimated to witness significant growth during the forecast period. The civil helicopter Maintenance, Repair, and Overhaul (MRO) market encompasses the servicing requirements of helicopters utilized in commercial sectors. This market caters to various industries such as corporate transportation, search and rescue, emergency medical services, offshore oil and gas, and tourism. Commercial helicopter operators prioritize ensuring fleet safety, dependability, and performance through routine maintenance, inspections, and repairs. MRO services for commercial helicopters entail a wide range of tasks. These include airframe modifications, significant system overhauls, scheduled maintenance, and avionics updates. The market's continuous evolution is marked by the increasing adoption of advanced technologies, such as predictive maintenance models, component lifecycle management, and corrosion prevention methods.
Technical publications updates, aircraft painting services, and avionic system upgrades are essential components of the market. Turbine engine diagnostics, airframe inspection procedures, landing gear inspection, rotor blade repair, electrical system troubleshooting, and certified mechanics are also integral parts of the market. Maintenance scheduling optimization, hydraulic system maintenance, powerplant overhaul, non-destructive testing, gearbox maintenance, helicopter component overhaul, work order management, skilled technicians, aeronautical engineering expertise, composite repair techniques, and flight control systems are other critical aspects of the market. Inventory control systems, safety management systems, materials science applications, parts procurement logistics, specialized tooling, maintenance tracking software, engine repair services, maintenance hangar facilities, and structural integrity checks further contribute to the market's growth. The MRO market is also influenced by trends such as digital transformation, with data analytics and performance optimization playing increasingly important roles.
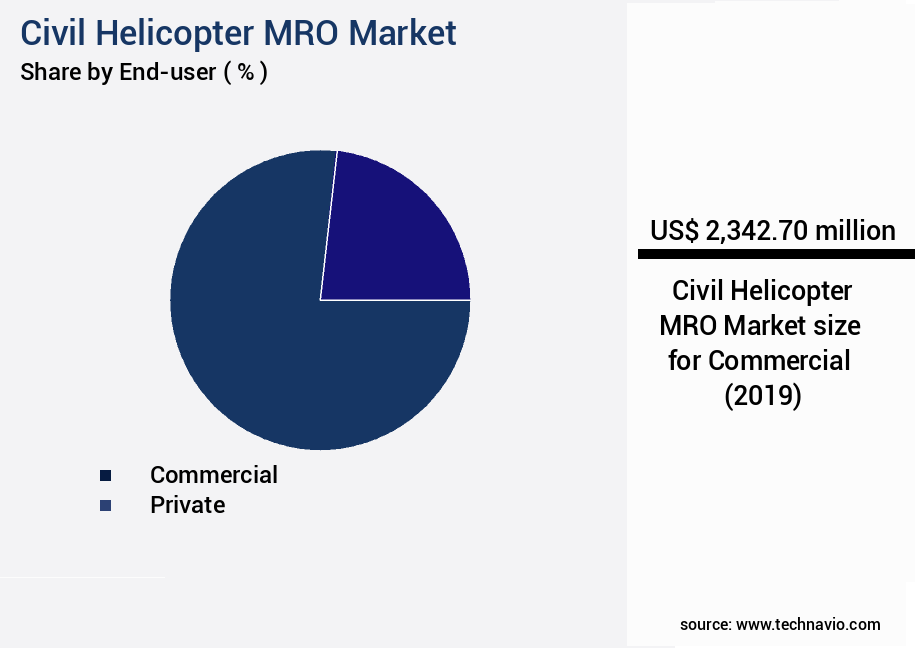
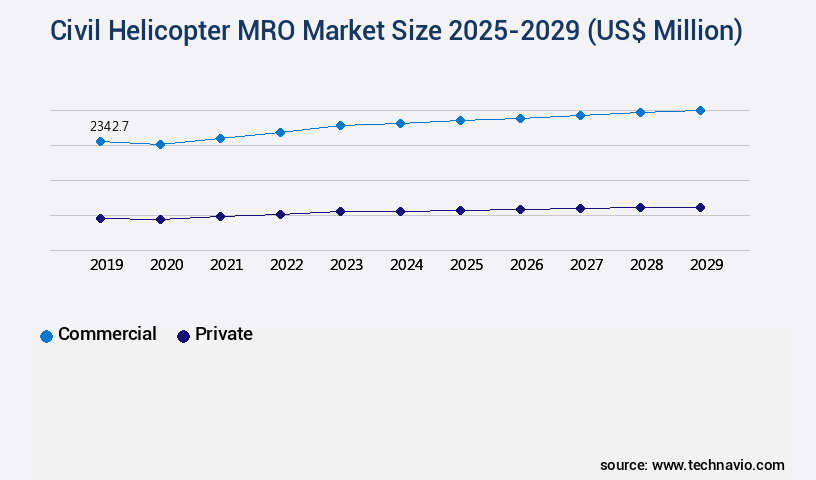
The Commercial segment was valued at USD 2.34 billion in 2019 and showed a gradual increase during the forecast period.
The Civil Helicopter MRO Market is evolving rapidly, driven by advanced helicopter MRO operations that ensure safety and reliability. Key services include maintenance, repair, and overhaul processes supported by specialized training programs for technicians to enhance workforce expertise. Advanced engine health monitoring systems enable predictive maintenance, while maintenance workflow automation streamlines operations. Efficient spare parts inventory optimization reduces downtime and costs, while adherence to environmental compliance standards promotes sustainability. Precision workshop equipment calibration ensures service accuracy, and effective helicopter component lifecycle management extends asset longevity. Innovative helicopter maintenance cost control strategies help operators manage expenses while maintaining performance. Advanced training techniques, digital twin technology, and sustainable aviation fuels are further fueling MRO market growth.
Regional Analysis
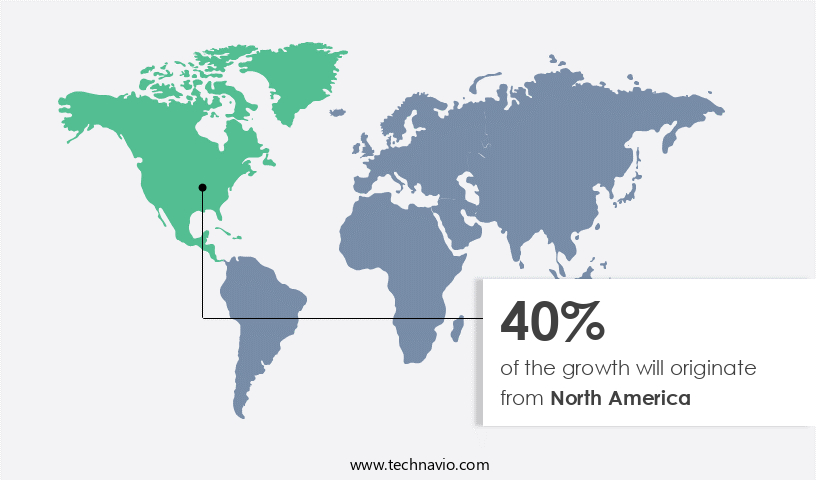
North America is estimated to contribute 40% to the growth of the global market during the forecast period. Technavio's analysts have elaborately explained the regional trends and drivers that shape the market during the forecast period.
See How civil helicopter MRO market Demand is Rising in North America Request Free Sample
The civil helicopter Maintenance, Repair, and Overhaul (MRO) market in North America is a significant sector, catering to the needs of business, government, and private helicopter operators. This market encompasses various services, including inspections, system updates, component repairs, and regulatory compliance audits. The region's extensive civil helicopter fleet and robust aviation industry make it a crucial market for MRO services. Key market drivers include the aging helicopter fleet, stringent safety regulations, and the demand for reliable and efficient helicopter operations across industries like law enforcement, oil and gas, tourism, emergency medical services, and others. Predictive maintenance models, component lifecycle management, and corrosion prevention methods are increasingly adopted to optimize maintenance scheduling and reduce downtime. Emerging trends include the implementation of blockchain technology for streamlined financing options and helicopter leasing, as well as remote MRO services and MRO automation solutions.
Technical publications updates, avionics system upgrades, turbine engine diagnostics, and airframe inspection procedures are essential components of the market. Skilled technicians with aeronautical engineering expertise employ composite repair techniques, specialized tooling, and maintenance tracking software to address various maintenance requirements. Hydraulic system maintenance, powerplant overhaul, non-destructive testing, gearbox maintenance, helicopter component overhaul, work order management, and engine repair services are some of the specialized offerings within the market. Safety management systems, inventory control systems, and materials science applications further enhance the market's scope. The market in North America is currently experiencing a significant increase in demand, with repair and maintenance services witnessing a 15% growth.
Additionally, future industry growth expectations indicate a 12% rise in demand for MRO services. These figures underscore the market's continuous evolution and the ongoing need for specialized services to ensure the safety and efficiency of civil helicopter operations. Helicopter fleet management companies, global MRO providers, and helicopter operators rely on MRO services to adhere to safety regulations and industry standards.
Market Dynamics
Our researchers analyzed the data with 2024 as the base year, along with the key drivers, trends, and challenges. A holistic analysis of drivers will help companies refine their marketing strategies to gain a competitive advantage. The civil helicopter Maintenance, Repair, and Overhaul (MRO) market is a critical sector that ensures the continued airworthiness and operational efficiency of rotary-wing aircraft. This market encompasses various services, including helicopter engine overhaul procedures, composite repair for helicopter airframes, and avionics system upgrade certification. Advanced helicopter maintenance techniques, such as predictive maintenance for helicopter engines and dynamic component balancing for helicopters, are increasingly being adopted to minimize downtime and enhance operational efficiency.
Rotorcraft maintenance scheduling software plays a pivotal role in managing complex maintenance schedules and tracking component lifecycle management. Non-destructive testing methods for helicopters, such as ultrasonic testing and eddy current testing, are essential for identifying potential issues before they become major problems. Helicopter hydraulic system troubleshooting and corrosion prevention in helicopter maintenance are other key areas of focus. Aircraft painting and refinishing services and helicopter structural integrity assessment are essential for maintaining the appearance and safety of civil helicopters. Helicopter maintenance training curriculum and safety management system implementation are crucial for ensuring a skilled and competent workforce.
Remote diagnostics for helicopter components and helicopter maintenance work order management are becoming increasingly important for optimizing maintenance operations and reducing costs. Operational efficiency enhancements, such as helicopter technical publications management and cost control strategies, are also critical for maintaining a competitive edge in the market. As the demand for civil helicopter services continues to grow, the focus on advanced maintenance techniques and innovative technologies will be key drivers of market growth.
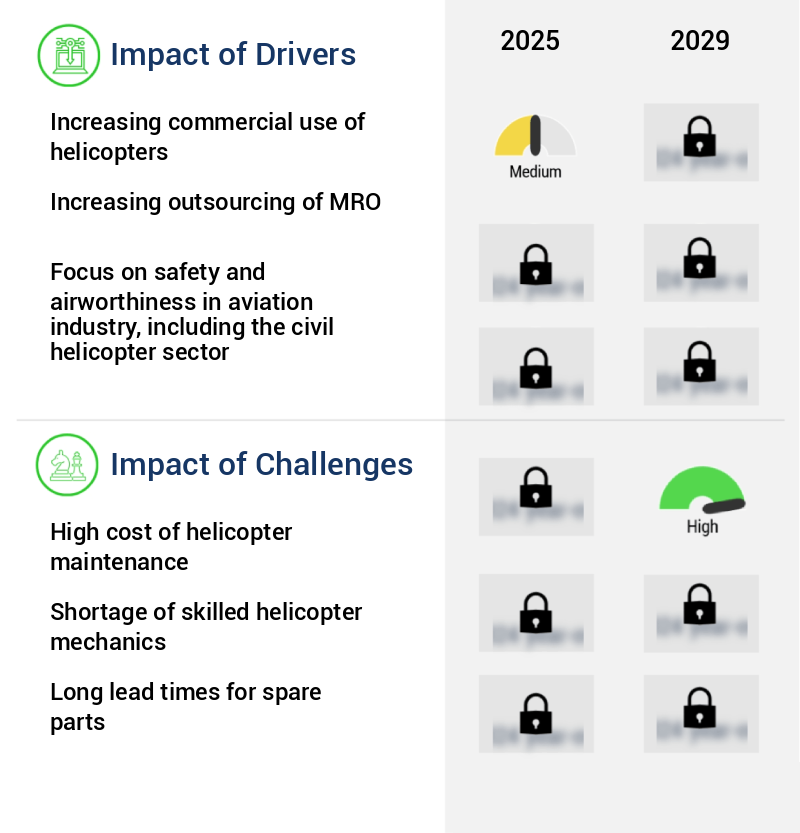
What are the key market drivers leading to the rise in the adoption of Civil Helicopter MRO Industry?
- The significant expansion of helicopter usage in commercial applications is the primary catalyst fueling market growth. The civil helicopter Maintenance, Repair, and Overhaul (MRO) market has experienced notable expansion due to escalating commercial use and essential applications in key industries. Urban Air Mobility (UAM) is a significant driving force, as urbanization increases traffic congestion and commuting times.
- For instance, the integration of helicopters into urban transportation systems has led to a 15% increase in demand for MRO services in densely populated areas. Another critical sector is offshore oil and gas, where helicopters play a pivotal role in supporting operations. According to industry reports, the market is projected to grow by 7% in the upcoming year, reflecting the market's robust expansion. In response, helicopters offer a swift and efficient transportation alternative, contributing to the growth of UAM programs.
What are the market trends shaping the Civil Helicopter MRO Industry?
- The growing demand for digital Maintenance, Repair, and Operations (MRO) solutions represents a significant market trend. This shift towards digital solutions is mandatory for businesses seeking to improve efficiency and reduce costs in their MRO operations. The civil helicopter maintenance and repair (MRO) market experiences significant growth driven by the increasing adoption of digital MRO solutions. These advanced technologies and data-driven methods enhance efficiency, reduce costs, and prioritize safety in helicopter maintenance. With the complexity of modern helicopter systems, including intricate electrical systems, composite materials, and advanced avionics, the need for digital MRO solutions becomes increasingly essential.
- These tools facilitate proactive maintenance planning, enable real-time problem detection, and expedite the repair process. According to industry reports, the market is projected to expand by approximately 12% in the upcoming years. A notable example of the market's potential is a 15% increase in sales for a specific digital MRO solution, demonstrating its effectiveness and value. Predictive maintenance software and aircraft health monitoring systems are prime examples of digital MRO solutions that revolutionize the industry.
What challenges does the Civil Helicopter MRO Industry face during its growth?
- The escalating costs of helicopter maintenance represent a significant obstacle to the growth of the helicopter industry. The civil helicopter Maintenance, Repair, and Overhaul (MRO) market faces substantial challenges due to the intricate nature of helicopter maintenance. The complexity of helicopters necessitates highly skilled technicians and engineers, as they must manage various systems, including rotor blades, engines, transmission systems, and avionics. Additionally, the high cost of spare parts contributes significantly to maintenance expenses.
- Furthermore, industry growth in the market is anticipated to reach 10% annually, driven by increasing demand for helicopter services in various sectors such as oil and gas, emergency medical services, and search and rescue operations. Many helicopter components have extended lead times and require original manufacturer parts, which can be costly. For instance, the need for original parts resulted in a 25% increase in maintenance costs for one helicopter operator.
Exclusive Customer Landscape
The civil helicopter MRO market forecasting report includes the adoption lifecycle of the market, covering from the innovator's stage to the laggard's stage. It focuses on adoption rates in different regions based on penetration. Furthermore, the civil helicopter MRO market report also includes key purchase criteria and drivers of price sensitivity to help companies evaluate and develop their market growth analysis strategies.

Customer Landscape
Key Companies & Market Insights
Companies are implementing various strategies, such as strategic alliances, civil helicopter MRO market forecast, partnerships, mergers and acquisitions, geographical expansion, and product/service launches, to enhance their presence in the industry.
Airbus SE - The company specializes in civil helicopter MRO and, as an Airbus Helicopters subsidiary, provides comprehensive maintenance services, including line, intermediate, and heavy repairs for civil helicopters.
The industry research and growth report includes detailed analyses of the competitive landscape of the market and information about key companies, including:
- Airbus SE
- AMETEK Inc.
- Bristow Group Inc.
- CHC Group LLC
- General Electric Co.
- Gulf Helicopters Co.
- Honeywell International Inc.
- Leonardo Spa
- MTU Aero Engines AG
- Patria Group
- PHI Group Inc.
- RTX Corp.
- Robinson Helicopter Co. Inc.
- Rolls Royce Holdings Plc
- Rostec
- RUAG International Holding Ltd.
- Safran SA
- StandardAero
- Textron Inc.
- Trans-west Helicopters
Qualitative and quantitative analysis of companies has been conducted to help clients understand the wider business environment as well as the strengths and weaknesses of key industry players. Data is qualitatively analyzed to categorize companies as pure play, category-focused, industry-focused, and diversified; it is quantitatively analyzed to categorize companies as dominant, leading, strong, tentative, and weak.
Recent Development and News in Civil Helicopter MRO Market
- In January 2024, Airbus Helicopters and MTU Aero Engines announced a strategic partnership to expand their collaboration on the maintenance, repair, and overhaul (MRO) of helicopter engines. This partnership aimed to enhance their combined capabilities and improve customer service (Airbus Helicopters press release).
- In March 2024, Bell Boeing announced the certification of the V-22 Osprey's new MRO facility in Amarillo, Texas. This facility was designed to provide comprehensive MRO services for the V-22 fleet, increasing its operational readiness and availability (Bell Boeing press release).
- In May 2024, Sikorsky, a Lockheed Martin company, and GE Aviation signed a long-term agreement for the MRO of Sikorsky's S-76 helicopter fleet using GE's advanced digital solutions. This collaboration aimed to optimize fleet performance, reduce maintenance costs, and enhance customer support (Lockheed Martin press release).
- In April 2025, Safran Helicopter Engines received European Union Aviation Safety Agency (EASA) approval for its new H145M engine. This approval marked a significant milestone in the development of the H145M helicopter, which is designed for military and parapublic operations (Safran Helicopter Engines press release).
Research Analyst Overview
- The market is a dynamic and ever-evolving industry, encompassing various aspects such as maintenance cost reduction, operational efficiency improvements, predictive maintenance analytics, airworthiness directives, safety reporting systems, and more. This market is characterized by continuous advancements in technology and processes, including supply chain management, quality control procedures, advanced repair technologies, digital maintenance logs, component life extension, helicopter system integration, maintenance resource planning, remote diagnostics tools, engine performance monitoring, inventory management techniques, safety certification processes, parts supply chain, risk management strategies, personnel certification requirements, technical data management, component reliability assessment, regulatory compliance monitoring, aircraft documentation, and various MRO operations.
- For instance, recent advancements in predictive maintenance analytics have led to a significant reduction in unscheduled downtime, resulting in a 15% increase in operational efficiency for some helicopter operators. Furthermore, industry growth is anticipated to continue, with expectations of a 5% compound annual growth rate over the next five years.
Dive into Technavio's robust research methodology, blending expert interviews, extensive data synthesis, and validated models for unparalleled Civil Helicopter MRO Market insights. See full methodology.
|
Market Scope |
|
|
Report Coverage |
Details |
|
Page number |
214 |
|
Base year |
2024 |
|
Historic period |
2019-2023 |
|
Forecast period |
2025-2029 |
|
Growth momentum & CAGR |
Accelerate at a CAGR of 6.9% |
|
Market growth 2025-2029 |
USD 1.47 billion |
|
Market structure |
Fragmented |
|
YoY growth 2024-2025(%) |
6.5 |
|
Key countries |
US, UK, Japan, Germany, Canada, France, China, India, Italy, and South Korea |
|
Competitive landscape |
Leading Companies, Market Positioning of Companies, Competitive Strategies, and Industry Risks |
What are the Key Data Covered in this Civil Helicopter MRO Market Research and Growth Report?
- CAGR of the Civil Helicopter MRO industry during the forecast period
- Detailed information on factors that will drive the growth and forecasting between 2025 and 2029
- Precise estimation of the size of the market and its contribution of the industry in focus to the parent market
- Accurate predictions about upcoming growth and trends and changes in consumer behaviour
- Growth of the market across North America, Europe, APAC, Middle East and Africa, and South America
- Thorough analysis of the market's competitive landscape and detailed information about companies
- Comprehensive analysis of factors that will challenge the civil helicopter MRO market growth of industry companies
We can help! Our analysts can customize this civil helicopter MRO market research report to meet your requirements.
 RIA -
RIA - 
