Cleanroom Air Filter Market Analysis, Size, and Forecast 2024-2028: North America (Mexico), Europe (France, Germany, Italy, Spain, and UK), Middle East and Africa (UAE), APAC (Australia, China, India, Japan, and South Korea), South America (Brazil), and Rest of World (ROW)

Cleanroom Air Filter Market Analysis, Size, and Forecast 2024-2028:
North America (Mexico), Europe (France, Germany, Italy, Spain, and UK), Middle East and Africa (UAE), APAC (Australia, China, India, Japan, and South Korea), South America (Brazil), and Rest of World (ROW)

Published: Jan 2024 159 Pages SKU: IRTNTR77306

Market Overview at a Glance

$154.08 Mn
Market Opportunity
4.36%
CAGR
4.22
YoY growth 2023-2024(%)

Cleanroom Air Filter Market Size 2024-2028

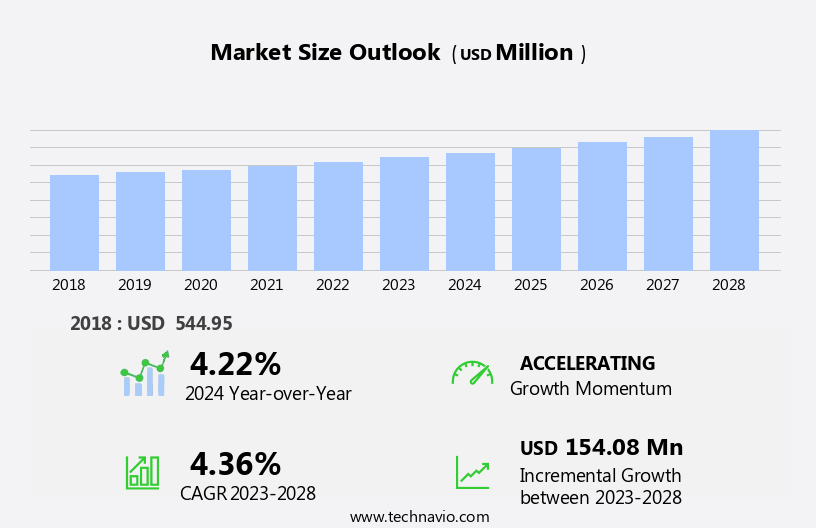
The cleanroom air filter market size is forecast to increase by USD 154.08 million at a CAGR of 4.36% between 2023 and 2028.

  • The cleanroom air filtration market is experiencing strong growth, driven by a heightened focus on worker safety and the increasing adoption of modular cleanrooms across various industries. Growing awareness of indoor air quality and its direct impact on employee health is fueling demand for high-performance cleanroom air filters. Modular cleanroom consumable solutions, in particular, are gaining traction due to their flexibility, scalability, and cost-efficiency. Despite this momentum, the market faces challenges related to high operational costs, including energy-intensive maintenance, frequent filter replacements, and specialized cleaning services requirements.
  • To remain competitive, companies must prioritize energy optimization and develop cost-effective filtration solutions without compromising performance. Continued investment in research and development aimed at creating energy-efficient and longer-lasting filter technologies will be essential for sustained growth. As the demand for clean, controlled environments continues to rise, success in this market will depend on a balanced approach to innovation, cost management, and regulatory compliance.

What will be the Size of the Cleanroom Air Filter Market during the forecast period?

Cleanroom Air Filter Market Size

 Request Free Sample

  • The market continues to evolve, driven by the dynamic nature of cleanroom applications across various sectors. Air handling units play a crucial role in maintaining cleanroom compliance, while cleanroom validation reports and software facilitate efficient cleanroom management. Filter maintenance and protocols ensure cleanroom performance, which is essential in food processing and pharmaceutical manufacturing. Particle counting instruments and air quality monitoring systems enable real-time monitoring of airborne particle concentration. Cleanroom gowns and garments, along with stringent cleanroom protocols, further minimize contamination risks. Hepa filtration and ulpa filtration technologies provide high filtration efficiency, addressing particle deposition and microbial control.
  • Cleanroom design criteria, including air velocity, pressure drop, and turbulent airflow, influence the selection of filter media and housing. Filter testing and validation are integral parts of the cleanroom qualification process. Cleanroom certification and ongoing training ensure adherence to federal standard 209E and other cleanroom standards. Cleanroom construction, including HVAC systems and automation, continues to advance, enabling improved cleanroom integrity and air exchange rates. Air sampling and particle size analyzers facilitate continuous monitoring and optimization of cleanroom conditions. Differential pressure gauges and air velocity meters aid in maintaining optimal cleanroom performance. Cleanroom design, construction, and maintenance procedures are subject to ongoing refinement, ensuring the continuous improvement of cleanroom applications. The integration of advanced technologies and evolving cleanroom standards ensures the market remains a vibrant and dynamic sector.

How is this Cleanroom Air Filter Industry segmented?

The cleanroom air filter industry research report provides comprehensive data (region-wise segment analysis), with forecasts and estimates in "USD million" for the period 2024-2028, as well as historical data from 2018-2022 for the following segments.

  • Type
    • HEPA filter
    • ULPA filter
  • Application
    • Life science
    • Semi-conductor and optical industry
  • Distribution Channel
    • Direct Sales
    • Distributors
    • Online Retail
  • End-User
    • Industrial
    • Commercial
    • Healthcare
  • Geography
    • North America
      • US
      • Mexico
    • Europe
      • France
      • Germany
      • Italy
      • Spain
      • UK
    • Middle East and Africa
      • UAE
    • APAC
      • Australia
      • China
      • India
      • Japan
      • South Korea
    • South America
      • Brazil
    • Rest of World (ROW)

By Type Insights

The hepa filter segment is estimated to witness significant growth during the forecast period.

In the realm of cleanroom technology, high-efficiency particulate air (HEPA) filters have emerged as a pivotal solution for effective air filtration. These filters, also known as spun glass filtration technology, are gaining significant traction in various industries, such as food and beverage processing, semiconductor manufacturing, medical chemical plants, and printing and publishing. The primary function of HEPA filters is to capture harmful airborne particles that pose risks to human health or the environment. The escalating adoption of HEPA filters in sectors like pharmaceuticals, biotechnology, healthcare, and semiconductor manufacturing is propelling the growth of this segment. Advancements in cleanroom management systems and research and development have led to the evolution of HEPA filters with enhanced filtration efficiency.

Cleanroom classification, a critical aspect of maintaining optimal air quality, relies heavily on the performance of HEPA filters. Particle deposition and particle size analysis are crucial factors driving the demand for advanced HEPA filters. Cleanroom monitoring systems and qualification processes ensure the integrity of cleanroom environments. Differential pressure gauges and air velocity meters are essential tools for maintaining optimal cleanroom conditions. Filter cartridges, an integral component of HEPA filters, undergo rigorous testing and validation to meet cleanroom compliance standards. Cleanroom design criteria, including ultra-low penetration air and laminar airflow, necessitate the use of high-performance HEPA filters. Ultra-low penetration air filtration ensures that the cleanroom maintains stringent particle size distribution standards.

Filter maintenance and replacement protocols are crucial for ensuring consistent cleanroom performance. The cleanroom market is witnessing a surge in automation and hvac systems, further increasing the demand for advanced HEPA filters. Medical device manufacturing and pharmaceutical industries, which require stringent cleanroom standards, are major contributors to the market's growth. In conclusion, the market is witnessing significant growth, with HEPA filters holding a dominant share due to their high filtration efficiency and versatile applications. The ongoing research and development in cleanroom technology are expected to drive the market further, with a focus on improving filtration efficiency, reducing pressure drop, and enhancing cleanroom integrity.

Cleanroom Air Filter Market Size

Request Free Sample

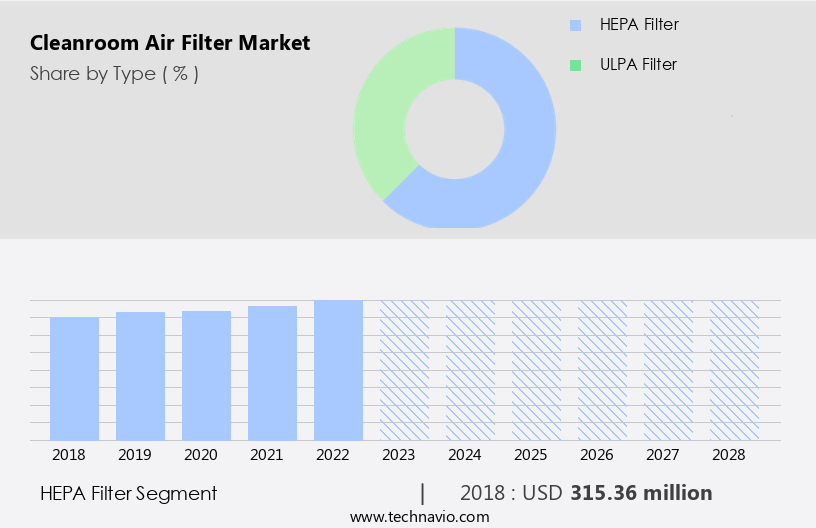
The HEPA filter segment was valued at USD 315.36 million in 2018 and showed a gradual increase during the forecast period.

Regional Analysis

APAC is estimated to contribute 54% to the growth of the global market during the forecast period.Technavio's analysts have elaborately explained the regional trends and drivers that shape the market during the forecast period.

Cleanroom Air Filter Market Share by Geography

 Request Free Sample

In The market, APAC holds a substantial share due to increasing foreign investments, favorable regulations, and heightened end-user awareness. The pharmaceutical and biotechnology sectors' expansion in APAC significantly contributes to market growth. Strict cleanliness standards in drug manufacturing, research laboratories, and production facilities necessitate the use of cleanroom air filters. With a growing population and increasing healthcare expenditure, there is a surging demand for drugs and medical devices in the region. Cleanroom air filters are essential components of these facilities, ensuring particle deposition control and maintaining air quality. Research and development in filter technologies, such as high-efficiency particulate air (HEPA) filtration and ultra-low penetration air (ULPA) filtration, are driving innovation.

Cleanroom management systems, monitoring systems, and qualification reports are crucial for maintaining cleanroom integrity and compliance. Cleanroom design criteria, including air velocity, turbulent airflow, and laminar airflow, are critical factors in cleanroom construction. Air handling units, filter cartridges, and filter banks are essential components of cleanroom HVAC systems. Filter maintenance, testing, and validation are essential for optimizing filter performance and extending their life cycle. Food processing industries and pharmaceutical manufacturing also rely on cleanroom facilities for maintaining stringent cleanliness standards. Contamination control measures, including particle counting, airborne particle concentration monitoring, and microbial control, are essential for ensuring cleanroom performance.

Cleanroom garments, gowns, and gloves are essential for maintaining cleanroom integrity during maintenance and operation. Cleanroom training and certification are essential for ensuring proper cleanroom protocols and procedures. Cleanroom automation and filter panel technologies are emerging trends in the market, offering improved efficiency and performance. Cleanroom design, documentation, and certification are crucial for ensuring regulatory compliance and maintaining cleanroom integrity.

Market Dynamics

Our researchers analyzed the data with 2023 as the base year, along with the key drivers, trends, and challenges. A holistic analysis of drivers will help companies refine their marketing strategies to gain a competitive advantage.

The Global Cleanroom Air Filter Market advances with HEPA filters for cleanrooms and ULPA filters for semiconductors. Cleanroom air filter market trends highlight high-efficiency cleanroom filtration and laminar airflow systems for biotech. Air filters for pharmaceutical cleanrooms and cleanroom filters for medical devices ensure sterility, per cleanroom filtration market forecast. IoT-enabled cleanroom air filters enhance smart cleanroom filtration systems, while cleanroom air filters for electronics maintain precision. Sustainable cleanroom filtration and advanced filtration for cleanroom HVAC drive efficiency. Cleanroom filters for nanotechnology, HEPA filters for hospital cleanrooms, and cleanroom air purification systems ensure compliance. High-capacity cleanroom filters, cleanroom filtration for aerospace, eco-friendly cleanroom air filters, cleanroom filters for biopharma, automated cleanroom filtration monitoring, and cleanroom air filters for contamination control fuel growth through 2028.

What are the key market drivers leading to the rise in the adoption of Cleanroom Air Filter Industry?

  • The prioritization of worker safety is a significant market trend, driving increased demand for solutions and innovations aimed at enhancing occupational health and reducing risks. 
  • Cleanroom air filters are essential components in maintaining a safe and healthy working environment in industries with stringent air quality requirements. These filters effectively remove airborne particles, dust, microbes, and contaminants, ensuring compliance with safety protocols and reducing the risk of respiratory issues or allergies for workers. In industries dealing with hazardous materials or chemicals, cleanroom air filtration systems play a critical role in minimizing the exposure risk for employees by removing or reducing the presence of harmful substances in the air. Cleanroom facilities adhere to rigorous safety standards and regulations. High-efficiency cleanroom air filtration systems, such as high-efficiency particulate air (HEPA) filters, ultralow penetration air (ULPA) filtration, and laminar airflow systems, are commonly employed to maintain optimal air quality.
  • Air velocity meters and air quality monitors are used to ensure proper filter performance and validate filter life cycles. Particle size distribution and filter validation are crucial aspects of cleanroom air filtration, ensuring the effectiveness of the filtration system. Cleanroom design criteria include considerations for cleanroom automation, cleanroom training, cleanroom cleaning procedures, and cleanroom documentation. Ultra-low penetration air and cleanroom certification are essential aspects of maintaining a consistently clean and controlled environment. By investing in advanced cleanroom air filtration technologies, industries can provide a safer and more productive working environment for their employees while ensuring regulatory compliance.

What are the market trends shaping the Cleanroom Air Filter Industry?

  • The increasing demand for modular cleanrooms represents a significant market trend. This preference for flexible, customizable cleanroom solutions is a notable development within the industry.
  • The market experiences significant growth due to the increasing adoption of modular cleanrooms across various industries. Modular cleanrooms offer advantages such as ease of installation and customization, leading to their popularity over traditional cleanrooms. With the rise in modular cleanroom installations in sectors like pharmaceuticals, biotechnology, and electronics, the demand for cleanroom air filters has correspondingly increased. These filters play a crucial role in maintaining cleanroom environments by removing particles from the air, ensuring particle deposition remains at acceptable levels. Modern cleanroom management systems employ advanced technologies like particle counting, filter cartridge monitoring, and cleanroom monitoring systems for efficient cleanroom maintenance procedures.
  • These systems facilitate cleanroom qualification and enable continuous monitoring of air velocity, differential pressure, and particle size. By implementing these systems, cleanroom operating procedures become more streamlined, ensuring consistent adherence to cleanroom classification standards. Cleanroom construction projects require precise attention to detail, including the selection of appropriate filter banks and filter cartridges based on particle size and turbulent airflow requirements. Proper filter maintenance procedures are essential to maintain optimal filtration efficiency and prolong filter lifespan. With the growing emphasis on cleanroom air quality, the market for cleanroom air filters is expected to continue its upward trajectory.

What challenges does the Cleanroom Air Filter Industry face during its growth?

  • The escalating operational costs linked to maintaining cleanroom environments represent a significant challenge to the industry's growth trajectory. 
  • Cleanrooms, controlled environments essential for industries with stringent cleanliness requirements such as pharmaceuticals, biotechnology, and food processing, account for a significant market for air filters. The high cost of constructing and maintaining cleanrooms is a primary challenge for market growth. This expense is due to the intricate engineering involved, including specialized air handling units and HVAC systems. These systems ensure cleanroom compliance by filtering out particles and controlling airflow, adhering to cleanroom protocols. Air filter media, such as HEPA filtration, plays a vital role in maintaining cleanroom performance. Regular filter maintenance, including replacement and cleaning, is crucial for optimal functionality.
  • Air quality monitoring through particle counting instruments and air samplers is necessary for contamination control. Cleanroom software and cleanroom garments further aid in maintaining a purified environment. Cleanroom validation reports are essential for ensuring regulatory compliance. Pharmaceutical manufacturing and food processing industries heavily rely on cleanrooms to meet specific industry standards. Air filter media and HVAC systems undergo rigorous testing and validation to meet these standards. In conclusion, the market is driven by the need for stringent cleanliness standards in various industries. The high cost of constructing and maintaining cleanrooms, coupled with the importance of filter maintenance and air quality monitoring, makes for a dynamic market.

Exclusive Customer Landscape

The cleanroom air filter market forecasting report includes the adoption lifecycle of the market, covering from the innovator's stage to the laggard's stage. It focuses on adoption rates in different regions based on penetration. Furthermore, the cleanroom air filter market report also includes key purchase criteria and drivers of price sensitivity to help companies evaluate and develop their market growth analysis strategies.

Cleanroom Air Filter Market Share by Geography

 Customer Landscape

Key Companies & Market Insights

Companies are implementing various strategies, such as strategic alliances, cleanroom air filter market forecast, partnerships, mergers and acquisitions, geographical expansion, and product/service launches, to enhance their presence in the industry.

The industry research and growth report includes detailed analyses of the competitive landscape of the market and information about key companies, including:

  • Camfil
  • MANN+HUMMEL
  • AAF International
  • Freudenberg Filtration
  • Donaldson Company
  • Parker Hannifin
  • Porvair Filtration
  • W. L. Gore & Associates
  • Daikin Industries
  • 3M
  • Clarcor
  • Filtration Group
  • Purafil
  • Trojan Technologies
  • Nortek Air Solutions
  • Lennox International
  • Blueair
  • Honeywell
  • Johnson Controls
  • Munters

Qualitative and quantitative analysis of companies has been conducted to help clients understand the wider business environment as well as the strengths and weaknesses of key industry players. Data is qualitatively analyzed to categorize companies as pure play, category-focused, industry-focused, and diversified; it is quantitatively analyzed to categorize companies as dominant, leading, strong, tentative, and weak.

Recent Development and News in Cleanroom Air Filter Market

  • In February 2023, 3M, a leading innovator in industrial filtration, announced the launch of its new Filtrete N99 HEPA Filter, specifically designed for cleanroom applications. This advanced filter offers enhanced efficiency and improved particle capture, ensuring better air quality in various industries, including electronics, pharmaceuticals, and biotechnology (3M Press Release, 2023).
  • In May 2024, Camfil, a global air filtration leader, entered into a strategic partnership with Tesla, the electric vehicle manufacturer, to provide cleanroom filtration solutions for Tesla's new Gigafactory in Berlin, Germany. This collaboration underscores Camfil's commitment to supporting the growing demand for advanced cleanroom technologies in the renewable energy sector (Camfil Press Release, 2024).
  • In October 2024, Donaldson Company, a leading manufacturer of filtration systems, completed the acquisition of Micronics Filtration, a specialist in cleanroom filtration solutions. This acquisition strengthens Donaldson's position in the high-growth cleanroom air filtration market and expands its product offerings, enabling the company to cater to a broader customer base (Donaldson Company Press Release, 2024).
  • In January 2025, the European Union (EU) introduced new regulations for cleanroom air filtration, requiring stricter standards for particle filtration efficiency and airflow rates. This regulatory change is expected to drive demand for advanced cleanroom filtration technologies and solutions, benefiting market leaders and innovators in the sector (European Commission, 2025).

Research Analyst Overview

The cleanroom market is characterized by continuous advancements in air filtration technology and stringent regulations. Cost analysis plays a crucial role in cleanroom design, with air pressure control being a key consideration. Cleanroom certification bodies enforce standards updates, ensuring compliance with MERV rating requirements and membrane filtration. Sustainability is a growing trend, with energy efficiency and carbon filtration gaining prominence. Air filtration technology innovations include advanced membrane filtration and automation software for monitoring and control. HVAC design optimizes airflow and pressure, while ergonomics and safety are prioritized in cleanroom workforce training. Compliance audits and risk assessments ensure adherence to regulations and industry standards.

Cleanroom industry associations promote best practices and collaborate on research and development. HVAC system leak testing and integrity testing are essential for maintaining cleanroom environmental monitoring and overall performance. Airflow control and qualification plans are integral parts of the certification process, ensuring consistent cleanroom conditions. Cleanroom regulations continue to evolve, with a focus on improving safety, efficiency, and overall industry standards. The cleanroom industry trends reflect these advancements, with a shift towards more sophisticated filtration systems, energy-efficient designs, and automation software.

Dive into Technavio's robust research methodology, blending expert interviews, extensive data synthesis, and validated models for unparalleled Cleanroom Air Filter Market insights. See full methodology.

Market Scope

Report Coverage

Details

Page number

159

Base year

2023

Historic period

2018-2022

Forecast period

2024-2028

Growth momentum & CAGR

Accelerate at a CAGR of 4.36%

Market growth 2024-2028

USD 154.08 million

Market structure

Fragmented

YoY growth 2023-2024(%)

4.22

Key countries

US, China, Germany, Japan, UK, Australia, India, France, Brazil, UAE, Rest of World (ROW), Saudi Arabia, France, South Korea, Mexico, Italy, and Spain

Competitive landscape

Leading Companies, Market Positioning of Companies, Competitive Strategies, and Industry Risks

Request Free Sample

What are the Key Data Covered in this Cleanroom Air Filter Market Research and Growth Report?

  • CAGR of the Cleanroom Air Filter industry during the forecast period
  • Detailed information on factors that will drive the growth and forecasting between 2024 and 2028
  • Precise estimation of the size of the market and its contribution of the industry in focus to the parent market
  • Accurate predictions about upcoming growth and trends and changes in consumer behaviour
  • Growth of the market across APAC, North America, Europe, Middle East and Africa, and South America
  • Thorough analysis of the market's competitive landscape and detailed information about companies
  • Comprehensive analysis of factors that will challenge the cleanroom air filter market growth of industry companies

We can help! Our analysts can customize this cleanroom air filter market research report to meet your requirements.

Get in touch

1 Executive Summary

  • 1.1 Market overview
    • Exhibit 01: Executive Summary – Chart on Market Overview
    • Exhibit 02: Executive Summary – Data Table on Market Overview
    • Exhibit 03: Executive Summary – Chart on Global Market Characteristics
    • Exhibit 04: Executive Summary – Chart on Market by Geography
    • Exhibit 05: Executive Summary – Chart on Market Segmentation by Type
    • Exhibit 06: Executive Summary – Chart on Market Segmentation by Application
    • Exhibit 07: Executive Summary – Chart on Incremental Growth
    • Exhibit 08: Executive Summary – Data Table on Incremental Growth
    • Exhibit 09: Executive Summary – Chart on Vendor Market Positioning

2 Market Landscape

  • 2.1 Market ecosystem
    • Exhibit 10: Parent market
    • Exhibit 11: Market Characteristics

3 Market Sizing

  • 3.1 Market definition
    • Exhibit 12: Offerings of vendors included in the market definition
  • 3.2 Market segment analysis
    • Exhibit 13: Market segments
  • 3.3 Market size 2023
    • 3.4 Market outlook: Forecast for 2023-2028
      • Exhibit 14: Chart on Global - Market size and forecast 2023-2028 ($ million)
      • Exhibit 15: Data Table on Global - Market size and forecast 2023-2028 ($ million)
      • Exhibit 16: Chart on Global Market: Year-over-year growth 2023-2028 (%)
      • Exhibit 17: Data Table on Global Market: Year-over-year growth 2023-2028 (%)

    4 Historic Market Size

    • 4.1 Global cleanroom air filter market 2018 - 2022
      • Exhibit 18: Historic Market Size – Data Table on global cleanroom air filter market 2018 - 2022 ($ million)
    • 4.2 Type Segment Analysis 2018 - 2022
      • Exhibit 19: Historic Market Size – Type Segment 2018 - 2022 ($ million)
    • 4.3 Application Segment Analysis 2018 - 2022
      • Exhibit 20: Historic Market Size – Application Segment 2018 - 2022 ($ million)
    • 4.4 Geography Segment Analysis 2018 - 2022
      • Exhibit 21: Historic Market Size – Geography Segment 2018 - 2022 ($ million)
    • 4.5 Country Segment Analysis 2018 - 2022
      • Exhibit 22: Historic Market Size – Country Segment 2018 - 2022 ($ million)

    5 Five Forces Analysis

    • 5.1 Five forces summary
      • Exhibit 23: Five forces analysis - Comparison between 2023 and 2028
    • 5.2 Bargaining power of buyers
      • Exhibit 24: Chart on Bargaining power of buyers – Impact of key factors 2023 and 2028
    • 5.3 Bargaining power of suppliers
      • Exhibit 25: Bargaining power of suppliers – Impact of key factors in 2023 and 2028
    • 5.4 Threat of new entrants
      • Exhibit 26: Threat of new entrants – Impact of key factors in 2023 and 2028
    • 5.5 Threat of substitutes
      • Exhibit 27: Threat of substitutes – Impact of key factors in 2023 and 2028
    • 5.6 Threat of rivalry
      • Exhibit 28: Threat of rivalry – Impact of key factors in 2023 and 2028
    • 5.7 Market condition
      • Exhibit 29: Chart on Market condition - Five forces 2023 and 2028

    6 Market Segmentation by Type

    • 6.1 Market segments
      • Chart on Type - Market share (2023-2028) (%)
      • Data Table on Type - Market share (2023-2028) (%)
    • 6.2 Comparison by Type
      • Chart on Comparison by Type
      • Data Table on Comparison by Type
    • 6.3 HEPA filter - Market size and forecast (2023-2028)
      • Chart on HEPA filter - Market size and forecast (2023-2028) ($ million)
      • Data Table on HEPA filter - Market size and forecast (2023-2028) ($ million)
      • Chart on HEPA filter - Year-over-year growth (2023-2028) (%)
      • Data Table on HEPA filter - Year-over-year growth (2023-2028) (%)
    • 6.4 ULPA filter - Market size and forecast (2023-2028)
      • Chart on ULPA filter - Market size and forecast (2023-2028) ($ million)
      • Data Table on ULPA filter - Market size and forecast (2023-2028) ($ million)
      • Chart on ULPA filter - Year-over-year growth (2023-2028) (%)
      • Data Table on ULPA filter - Year-over-year growth (2023-2028) (%)
    • 6.5 Market opportunity by Type
      • Market opportunity by Type ($ million)
      • Data Table on Market opportunity by Type ($ million)

    7 Market Segmentation by Application

    • 7.1 Market segments
      • Chart on Application - Market share (2023-2028) (%)
      • Data Table on Application - Market share (2023-2028) (%)
    • 7.2 Comparison by Application
      • Chart on Comparison by Application
      • Data Table on Comparison by Application
    • 7.3 Life science - Market size and forecast (2023-2028)
      • Chart on Life science - Market size and forecast (2023-2028) ($ million)
      • Data Table on Life science - Market size and forecast (2023-2028) ($ million)
      • Chart on Life science - Year-over-year growth (2023-2028) (%)
      • Data Table on Life science - Year-over-year growth (2023-2028) (%)
    • 7.4 Semi-conductor and optical industry - Market size and forecast (2023-2028)
      • Chart on Semi-conductor and optical industry - Market size and forecast (2023-2028) ($ million)
      • Data Table on Semi-conductor and optical industry - Market size and forecast (2023-2028) ($ million)
      • Chart on Semi-conductor and optical industry - Year-over-year growth (2023-2028) (%)
      • Data Table on Semi-conductor and optical industry - Year-over-year growth (2023-2028) (%)
    • 7.5 Market opportunity by Application
      • Market opportunity by Application ($ million)
      • Data Table on Market opportunity by Application ($ million)

    8 Market Segmentation by Distribution Channel

    • 8.1 Market segments
      • Chart on Distribution Channel - Market share (2023-2028) (%)
      • Data Table on Distribution Channel - Market share (2023-2028) (%)
    • 8.2 Comparison by Distribution Channel
      • Chart on Comparison by Distribution Channel
      • Data Table on Comparison by Distribution Channel
    • 8.3 Direct Sales - Market size and forecast (2023-2028)
      • Chart on Direct Sales - Market size and forecast (2023-2028) ($ million)
      • Data Table on Direct Sales - Market size and forecast (2023-2028) ($ million)
      • Chart on Direct Sales - Year-over-year growth (2023-2028) (%)
      • Data Table on Direct Sales - Year-over-year growth (2023-2028) (%)
    • 8.4 Distributors - Market size and forecast (2023-2028)
      • Chart on Distributors - Market size and forecast (2023-2028) ($ million)
      • Data Table on Distributors - Market size and forecast (2023-2028) ($ million)
      • Chart on Distributors - Year-over-year growth (2023-2028) (%)
      • Data Table on Distributors - Year-over-year growth (2023-2028) (%)
    • 8.5 Online Retail - Market size and forecast (2023-2028)
      • Chart on Online Retail - Market size and forecast (2023-2028) ($ million)
      • Data Table on Online Retail - Market size and forecast (2023-2028) ($ million)
      • Chart on Online Retail - Year-over-year growth (2023-2028) (%)
      • Data Table on Online Retail - Year-over-year growth (2023-2028) (%)
    • 8.6 Market opportunity by Distribution Channel
      • Market opportunity by Distribution Channel ($ million)
      • Data Table on Market opportunity by Distribution Channel ($ million)

    9 Market Segmentation by End-User

    • 9.1 Market segments
      • Chart on End-User - Market share (2023-2028) (%)
      • Data Table on End-User - Market share (2023-2028) (%)
    • 9.2 Comparison by End-User
      • Chart on Comparison by End-User
      • Data Table on Comparison by End-User
    • 9.3 Industrial - Market size and forecast (2023-2028)
      • Chart on Industrial - Market size and forecast (2023-2028) ($ million)
      • Data Table on Industrial - Market size and forecast (2023-2028) ($ million)
      • Chart on Industrial - Year-over-year growth (2023-2028) (%)
      • Data Table on Industrial - Year-over-year growth (2023-2028) (%)
    • 9.4 Commercial - Market size and forecast (2023-2028)
      • Chart on Commercial - Market size and forecast (2023-2028) ($ million)
      • Data Table on Commercial - Market size and forecast (2023-2028) ($ million)
      • Chart on Commercial - Year-over-year growth (2023-2028) (%)
      • Data Table on Commercial - Year-over-year growth (2023-2028) (%)
    • 9.5 Healthcare - Market size and forecast (2023-2028)
      • Chart on Healthcare - Market size and forecast (2023-2028) ($ million)
      • Data Table on Healthcare - Market size and forecast (2023-2028) ($ million)
      • Chart on Healthcare - Year-over-year growth (2023-2028) (%)
      • Data Table on Healthcare - Year-over-year growth (2023-2028) (%)
    • 9.6 Market opportunity by End-User
      • Market opportunity by End-User ($ million)
      • Data Table on Market opportunity by End-User ($ million)

    8 Customer Landscape

    • 8.1 Customer landscape overview
      • Exhibit 58: Analysis of price sensitivity, lifecycle, customer purchase basket, adoption rates, and purchase criteria

    9 Geographic Landscape

    • 9.1 Geographic segmentation
      • Exhibit 59: Chart on Market share by geography 2023-2028 (%)
      • Exhibit 60: Data Table on Market share by geography 2023-2028 (%)
    • 9.2 Geographic comparison
      • Exhibit 61: Chart on Geographic comparison
      • Exhibit 62: Data Table on Geographic comparison
    • 9.3 APAC - Market size and forecast 2023-2028
      • Exhibit 63: Chart on APAC - Market size and forecast 2023-2028 ($ million)
      • Exhibit 64: Data Table on APAC - Market size and forecast 2023-2028 ($ million)
      • Exhibit 65: Chart on APAC - Year-over-year growth 2023-2028 (%)
      • Exhibit 66: Data Table on APAC - Year-over-year growth 2023-2028 (%)
    • 9.4 North America - Market size and forecast 2023-2028
      • Exhibit 67: Chart on North America - Market size and forecast 2023-2028 ($ million)
      • Exhibit 68: Data Table on North America - Market size and forecast 2023-2028 ($ million)
      • Exhibit 69: Chart on North America - Year-over-year growth 2023-2028 (%)
      • Exhibit 70: Data Table on North America - Year-over-year growth 2023-2028 (%)
    • 9.5 Europe - Market size and forecast 2023-2028
      • Exhibit 71: Chart on Europe - Market size and forecast 2023-2028 ($ million)
      • Exhibit 72: Data Table on Europe - Market size and forecast 2023-2028 ($ million)
      • Exhibit 73: Chart on Europe - Year-over-year growth 2023-2028 (%)
      • Exhibit 74: Data Table on Europe - Year-over-year growth 2023-2028 (%)
    • 9.6 Middle East and Africa - Market size and forecast 2023-2028
      • Exhibit 75: Chart on Middle East and Africa - Market size and forecast 2023-2028 ($ million)
      • Exhibit 76: Data Table on Middle East and Africa - Market size and forecast 2023-2028 ($ million)
      • Exhibit 77: Chart on Middle East and Africa - Year-over-year growth 2023-2028 (%)
      • Exhibit 78: Data Table on Middle East and Africa - Year-over-year growth 2023-2028 (%)
    • 9.7 South America - Market size and forecast 2023-2028
      • Exhibit 79: Chart on South America - Market size and forecast 2023-2028 ($ million)
      • Exhibit 80: Data Table on South America - Market size and forecast 2023-2028 ($ million)
      • Exhibit 81: Chart on South America - Year-over-year growth 2023-2028 (%)
      • Exhibit 82: Data Table on South America - Year-over-year growth 2023-2028 (%)
    • 9.8 China - Market size and forecast 2023-2028
      • Exhibit 83: Chart on China - Market size and forecast 2023-2028 ($ million)
      • Exhibit 84: Data Table on China - Market size and forecast 2023-2028 ($ million)
      • Exhibit 85: Chart on China - Year-over-year growth 2023-2028 (%)
      • Exhibit 86: Data Table on China - Year-over-year growth 2023-2028 (%)
    • 9.9 US - Market size and forecast 2023-2028
      • Exhibit 87: Chart on US - Market size and forecast 2023-2028 ($ million)
      • Exhibit 88: Data Table on US - Market size and forecast 2023-2028 ($ million)
      • Exhibit 89: Chart on US - Year-over-year growth 2023-2028 (%)
      • Exhibit 90: Data Table on US - Year-over-year growth 2023-2028 (%)
    • 9.10 Japan - Market size and forecast 2023-2028
      • Exhibit 91: Chart on Japan - Market size and forecast 2023-2028 ($ million)
      • Exhibit 92: Data Table on Japan - Market size and forecast 2023-2028 ($ million)
      • Exhibit 93: Chart on Japan - Year-over-year growth 2023-2028 (%)
      • Exhibit 94: Data Table on Japan - Year-over-year growth 2023-2028 (%)
    • 9.11 Germany - Market size and forecast 2023-2028
      • Exhibit 95: Chart on Germany - Market size and forecast 2023-2028 ($ million)
      • Exhibit 96: Data Table on Germany - Market size and forecast 2023-2028 ($ million)
      • Exhibit 97: Chart on Germany - Year-over-year growth 2023-2028 (%)
      • Exhibit 98: Data Table on Germany - Year-over-year growth 2023-2028 (%)
    • 9.12 France - Market size and forecast 2023-2028
      • Exhibit 99: Chart on France - Market size and forecast 2023-2028 ($ million)
      • Exhibit 100: Data Table on France - Market size and forecast 2023-2028 ($ million)
      • Exhibit 101: Chart on France - Year-over-year growth 2023-2028 (%)
      • Exhibit 102: Data Table on France - Year-over-year growth 2023-2028 (%)
    • 9.13 Market opportunity by geography
      • Exhibit 103: Market opportunity by geography ($ million)
      • Exhibit 104: Data Tables on Market opportunity by geography ($ million)
    • 11.14 US - Market size and forecast (2023-2028)
      • Chart on US - Market size and forecast (2023-2028) ($ million)
      • Data Table on US - Market size and forecast (2023-2028) ($ million)
      • Chart on US - Year-over-year growth (2023-2028) (%)
      • Data Table on US - Year-over-year growth (2023-2028) (%)
    • 11.15 UK - Market size and forecast (2023-2028)
      • Chart on UK - Market size and forecast (2023-2028) ($ million)
      • Data Table on UK - Market size and forecast (2023-2028) ($ million)
      • Chart on UK - Year-over-year growth (2023-2028) (%)
      • Data Table on UK - Year-over-year growth (2023-2028) (%)
    • 11.16 Australia - Market size and forecast (2023-2028)
      • Chart on Australia - Market size and forecast (2023-2028) ($ million)
      • Data Table on Australia - Market size and forecast (2023-2028) ($ million)
      • Chart on Australia - Year-over-year growth (2023-2028) (%)
      • Data Table on Australia - Year-over-year growth (2023-2028) (%)
    • 11.17 India - Market size and forecast (2023-2028)
      • Chart on India - Market size and forecast (2023-2028) ($ million)
      • Data Table on India - Market size and forecast (2023-2028) ($ million)
      • Chart on India - Year-over-year growth (2023-2028) (%)
      • Data Table on India - Year-over-year growth (2023-2028) (%)
    • 11.18 Brazil - Market size and forecast (2023-2028)
      • Chart on Brazil - Market size and forecast (2023-2028) ($ million)
      • Data Table on Brazil - Market size and forecast (2023-2028) ($ million)
      • Chart on Brazil - Year-over-year growth (2023-2028) (%)
      • Data Table on Brazil - Year-over-year growth (2023-2028) (%)
    • 11.19 UAE - Market size and forecast (2023-2028)
      • Chart on UAE - Market size and forecast (2023-2028) ($ million)
      • Data Table on UAE - Market size and forecast (2023-2028) ($ million)
      • Chart on UAE - Year-over-year growth (2023-2028) (%)
      • Data Table on UAE - Year-over-year growth (2023-2028) (%)
    • 11.20 Rest of World (ROW) - Market size and forecast (2023-2028)
      • Chart on Rest of World (ROW) - Market size and forecast (2023-2028) ($ million)
      • Data Table on Rest of World (ROW) - Market size and forecast (2023-2028) ($ million)
      • Chart on Rest of World (ROW) - Year-over-year growth (2023-2028) (%)
      • Data Table on Rest of World (ROW) - Year-over-year growth (2023-2028) (%)
    • 11.21 Saudi Arabia - Market size and forecast (2023-2028)
      • Chart on Saudi Arabia - Market size and forecast (2023-2028) ($ million)
      • Data Table on Saudi Arabia - Market size and forecast (2023-2028) ($ million)
      • Chart on Saudi Arabia - Year-over-year growth (2023-2028) (%)
      • Data Table on Saudi Arabia - Year-over-year growth (2023-2028) (%)
    • 11.22 South Korea - Market size and forecast (2023-2028)
      • Chart on South Korea - Market size and forecast (2023-2028) ($ million)
      • Data Table on South Korea - Market size and forecast (2023-2028) ($ million)
      • Chart on South Korea - Year-over-year growth (2023-2028) (%)
      • Data Table on South Korea - Year-over-year growth (2023-2028) (%)
    • 11.23 Mexico - Market size and forecast (2023-2028)
      • Chart on Mexico - Market size and forecast (2023-2028) ($ million)
      • Data Table on Mexico - Market size and forecast (2023-2028) ($ million)
      • Chart on Mexico - Year-over-year growth (2023-2028) (%)
      • Data Table on Mexico - Year-over-year growth (2023-2028) (%)
    • 11.24 Italy - Market size and forecast (2023-2028)
      • Chart on Italy - Market size and forecast (2023-2028) ($ million)
      • Data Table on Italy - Market size and forecast (2023-2028) ($ million)
      • Chart on Italy - Year-over-year growth (2023-2028) (%)
      • Data Table on Italy - Year-over-year growth (2023-2028) (%)
    • 11.25 Spain - Market size and forecast (2023-2028)
      • Chart on Spain - Market size and forecast (2023-2028) ($ million)
      • Data Table on Spain - Market size and forecast (2023-2028) ($ million)
      • Chart on Spain - Year-over-year growth (2023-2028) (%)
      • Data Table on Spain - Year-over-year growth (2023-2028) (%)

    10 Drivers, Challenges, and Trends

    • 10.1 Market drivers
      • 10.2 Market challenges
        • 10.3 Impact of drivers and challenges
          • Exhibit 105: Impact of drivers and challenges in 2023 and 2028
        • 10.4 Market trends

          11 Vendor Landscape

          • 11.1 Overview
            • 11.2 Vendor landscape
              • Exhibit 106: Overview on Criticality of inputs and Factors of differentiation
            • 11.3 Landscape disruption
              • Exhibit 107: Overview on factors of disruption
            • 11.4 Industry risks
              • Exhibit 108: Impact of key risks on business

            14 Competitive Analysis

            • 14.1 Companies profiled
              • Companies covered
            • 14.2 Market positioning of companies
              • Matrix on companies position and classification
            • 14.3 Camfil
              • Camfil - Overview
              • Camfil - Product / Service
              • Camfil - Key offerings
            • 14.4 MANN+HUMMEL
              • MANN+HUMMEL - Overview
              • MANN+HUMMEL - Product / Service
              • MANN+HUMMEL - Key offerings
            • 14.5 AAF International
              • AAF International - Overview
              • AAF International - Product / Service
              • AAF International - Key offerings
            • 14.6 Freudenberg Filtration
              • Freudenberg Filtration - Overview
              • Freudenberg Filtration - Product / Service
              • Freudenberg Filtration - Key offerings
            • 14.7 Donaldson Company
              • Donaldson Company - Overview
              • Donaldson Company - Product / Service
              • Donaldson Company - Key offerings
            • 14.8 Parker Hannifin
              • Parker Hannifin - Overview
              • Parker Hannifin - Product / Service
              • Parker Hannifin - Key offerings
            • 14.9 Porvair Filtration
              • Porvair Filtration - Overview
              • Porvair Filtration - Product / Service
              • Porvair Filtration - Key offerings
            • 14.10 W. L. Gore & Associates
              • W. L. Gore & Associates - Overview
              • W. L. Gore & Associates - Product / Service
              • W. L. Gore & Associates - Key offerings
            • 14.11 Daikin Industries
              • Daikin Industries - Overview
              • Daikin Industries - Product / Service
              • Daikin Industries - Key offerings
            • 3M
              • 3M - Overview
              • 3M - Product / Service
              • 3M - Key offerings
            • 14.13 Clarcor
              • Clarcor - Overview
              • Clarcor - Product / Service
              • Clarcor - Key offerings
            • 14.14 Filtration Group
              • Filtration Group - Overview
              • Filtration Group - Product / Service
              • Filtration Group - Key offerings
            • 14.15 Purafil
              • Purafil - Overview
              • Purafil - Product / Service
              • Purafil - Key offerings
            • 14.16 Trojan Technologies
              • Trojan Technologies - Overview
              • Trojan Technologies - Product / Service
              • Trojan Technologies - Key offerings
            • 14.17 Nortek Air Solutions
              • Nortek Air Solutions - Overview
              • Nortek Air Solutions - Product / Service
              • Nortek Air Solutions - Key offerings
            • 14.18 Lennox International
              • Lennox International - Overview
              • Lennox International - Product / Service
              • Lennox International - Key offerings
            • 14.19 Blueair
              • Blueair - Overview
              • Blueair - Product / Service
              • Blueair - Key offerings
            • 14.20 Honeywell
              • Honeywell - Overview
              • Honeywell - Product / Service
              • Honeywell - Key offerings
            • 14.21 Johnson Controls
              • Johnson Controls - Overview
              • Johnson Controls - Product / Service
              • Johnson Controls - Key offerings
            • 14.22 Munters
              • Munters - Overview
              • Munters - Product / Service
              • Munters - Key offerings
            • 3M Co.
              • 3M Co. - Overview
              • 3M Co. - Product / Service
              • 3M Co. - Key offerings
            • 14.24 Aerospace America Inc.
              • Aerospace America Inc. - Overview
              • Aerospace America Inc. - Product / Service
              • Aerospace America Inc. - Key offerings
            • 14.25 Ahlstrom Holding 3 Oy
              • Ahlstrom Holding 3 Oy - Overview
              • Ahlstrom Holding 3 Oy - Product / Service
              • Ahlstrom Holding 3 Oy - Key offerings
            • 14.26 Airtech Japan Ltd.
              • Airtech Japan Ltd. - Overview
              • Airtech Japan Ltd. - Product / Service
              • Airtech Japan Ltd. - Key offerings
            • 14.27 Atlas Copco AB
              • Atlas Copco AB - Overview
              • Atlas Copco AB - Product / Service
              • Atlas Copco AB - Key offerings
            • 14.28 Camfil AB
              • Camfil AB - Overview
              • Camfil AB - Product / Service
              • Camfil AB - Key offerings
            • 14.29 CleanAir Solutions Inc.
              • CleanAir Solutions Inc. - Overview
              • CleanAir Solutions Inc. - Product / Service
              • CleanAir Solutions Inc. - Key offerings
            • 14.30 Daesung Industrial Co. Ltd.
              • Daesung Industrial Co. Ltd. - Overview
              • Daesung Industrial Co. Ltd. - Product / Service
              • Daesung Industrial Co. Ltd. - Key offerings
            • 14.31 Daikin Industries Ltd.
              • Daikin Industries Ltd. - Overview
              • Daikin Industries Ltd. - Product / Service
              • Daikin Industries Ltd. - Key offerings
            • 14.32 E.L. Foust
              • E.L. Foust - Overview
              • E.L. Foust - Product / Service
              • E.L. Foust - Key offerings
            • 14.33 Filtration Group Corp.
              • Filtration Group Corp. - Overview
              • Filtration Group Corp. - Product / Service
              • Filtration Group Corp. - Key offerings
            • 14.34 Freudenberg and Co. KG
              • Freudenberg and Co. KG - Overview
              • Freudenberg and Co. KG - Product / Service
              • Freudenberg and Co. KG - Key offerings
            • 14.35 Kalthoff Luftfilter und Filtermedien GmbH
              • Kalthoff Luftfilter und Filtermedien GmbH - Overview
              • Kalthoff Luftfilter und Filtermedien GmbH - Product / Service
              • Kalthoff Luftfilter und Filtermedien GmbH - Key offerings
            • 14.36 KOWA Air Filter Industry Ltd
              • KOWA Air Filter Industry Ltd - Overview
              • KOWA Air Filter Industry Ltd - Product / Service
              • KOWA Air Filter Industry Ltd - Key offerings
            • 14.37 Labconco Corp.
              • Labconco Corp. - Overview
              • Labconco Corp. - Product / Service
              • Labconco Corp. - Key offerings
            • 14.38 Lindab AB
              • Lindab AB - Overview
              • Lindab AB - Product / Service
              • Lindab AB - Key offerings
            • 14.39 MANN HUMMEL International GmbH and Co. KG
              • MANN HUMMEL International GmbH and Co. KG - Overview
              • MANN HUMMEL International GmbH and Co. KG - Product / Service
              • MANN HUMMEL International GmbH and Co. KG - Key offerings
            • 14.40 Parker Hannifin Corp.
              • Parker Hannifin Corp. - Overview
              • Parker Hannifin Corp. - Product / Service
              • Parker Hannifin Corp. - Key offerings
            • 14.41 TROX GmbH
              • TROX GmbH - Overview
              • TROX GmbH - Product / Service
              • TROX GmbH - Key offerings
            • 14.42 Airex Filter Corp.
              • Airex Filter Corp. - Overview
              • Airex Filter Corp. - Product / Service
              • Airex Filter Corp. - Key offerings

            13 Appendix

            • 13.1 Scope of the report
              • 13.2 Inclusions and exclusions checklist
                • Exhibit 171: Inclusions checklist
                • Exhibit 172: Exclusions checklist
              • 13.3 Currency conversion rates for US$
                • Exhibit 173: Currency conversion rates for US$
              • 13.4 Research methodology
                • Exhibit 174: Research methodology
                • Exhibit 175: Validation techniques employed for market sizing
                • Exhibit 176: Information sources
              • 13.5 List of abbreviations
                • Exhibit 177: List of abbreviations

              Research Methodology

              Technavio presents a detailed picture of the market by way of study, synthesis, and summation of data from multiple sources. The analysts have presented the various facets of the market with a particular focus on identifying the key industry influencers. The data thus presented is comprehensive, reliable, and the result of extensive research, both primary and secondary.

              INFORMATION SOURCES

              Primary sources

              • Manufacturers and suppliers
              • Channel partners
              • Industry experts
              • Strategic decision makers

              Secondary sources

              • Industry journals and periodicals
              • Government data
              • Financial reports of key industry players
              • Historical data
              • Press releases

              DATA ANALYSIS

              Data Synthesis

              • Collation of data
              • Estimation of key figures
              • Analysis of derived insights

              Data Validation

              • Triangulation with data models
              • Reference against proprietary databases
              • Corroboration with industry experts

              REPORT WRITING

              Qualitative

              • Market drivers
              • Market challenges
              • Market trends
              • Five forces analysis

              Quantitative

              • Market size and forecast
              • Market segmentation
              • Geographical insights
              • Competitive landscape

              Interested in this report?

              Get your sample now to see our research methodology and insights!

              Download Now

              Frequently Asked Questions

              Cleanroom Air Filter market growth will increase by $ 154.08 mn during 2024-2028.

              The Cleanroom Air Filter market is expected to grow at a CAGR of 4.36% during 2024-2028.

              Cleanroom Air Filter market is segmented by Type( HEPA filter, ULPA filter) Application( Life science, Semi-conductor and optical industry, optical industry)

              Camfil, MANN+HUMMEL, AAF International, Freudenberg Filtration, Donaldson Company, Parker Hannifin, Porvair Filtration, W. L. Gore & Associates, Daikin Industries, 3M, Clarcor, Filtration Group, Purafil, Trojan Technologies, Nortek Air Solutions, Lennox International, Blueair, Honeywell, Johnson Controls, Munters are a few of the key vendors in the Cleanroom Air Filter market.

              APAC will register the highest growth rate of 54% among the other regions. Therefore, the Cleanroom Air Filter market in APAC is expected to garner significant business opportunities for the vendors during the forecast period.

              US, China, Germany, Japan, UK, Australia, India, France, Brazil, UAE, Rest of World (ROW), Saudi Arabia, France, South Korea, Mexico, Italy, Spain

              • Increasing focus on worker safetyCleanroom air filters play an important role in ensuring worker safety within controlled environments by maintaining high standards of air quality. Cleanroom air filters effectively eliminate airborne particles is the driving factor this market.
              • dust is the driving factor this market.
              • microbes is the driving factor this market.
              • and contaminants from the air is the driving factor this market.
              • which reduces the risk of workers inhaling harmful particles that could cause respiratory issues or allergies. In several industries dealing with hazardous materials or chemicals is the driving factor this market.
              • air filters play a critical role in removing or reducing the presence of these substances in the air is the driving factor this market.
              • minimizing the exposure risk for workers. Cleanroom facilities admit to strict safety standards and regulations. By employing high-efficiency cleanroom air filtration systems is the driving factor this market.
              • these facilities ensure compliance with safety protocols is the driving factor this market.
              • offering a safer working environment for employees. By constantly filtering and purifying the air is the driving factor this market.
              • cleanroom air filtration systems significantly contribute to maintaining a safe and healthy work environment for employees in industries that require controlled and sterile conditions. Therefore is the driving factor this market.
              • the increasing focus on worker safety drives the growth of the global cleanroom air filter market during the forecast period. is the driving factor this market.

              The Cleanroom Air Filter market vendors should focus on grabbing business opportunities from the HEPA filter segment as it accounted for the largest market share in the base year.