CNG Powertrain Market Size 2026-2030
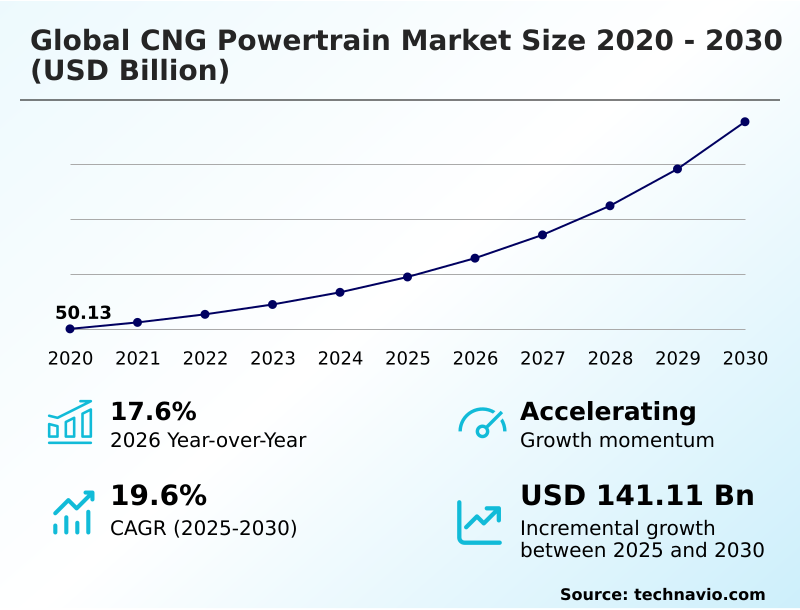
The cng powertrain market size is valued to increase by USD 141.11 billion, at a CAGR of 19.6% from 2025 to 2030. Technological advancements and performance improvements will drive the cng powertrain market.
Major Market Trends & Insights
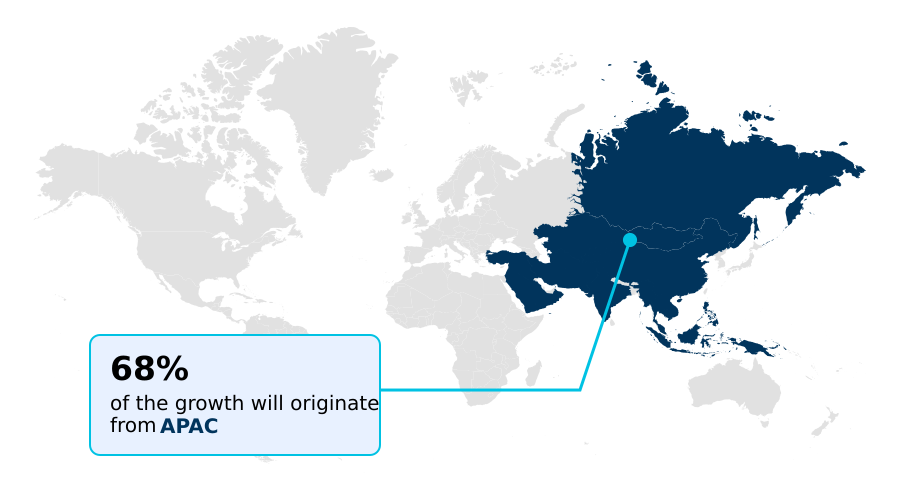
- APAC dominated the market and accounted for a 68.4% growth during the forecast period.
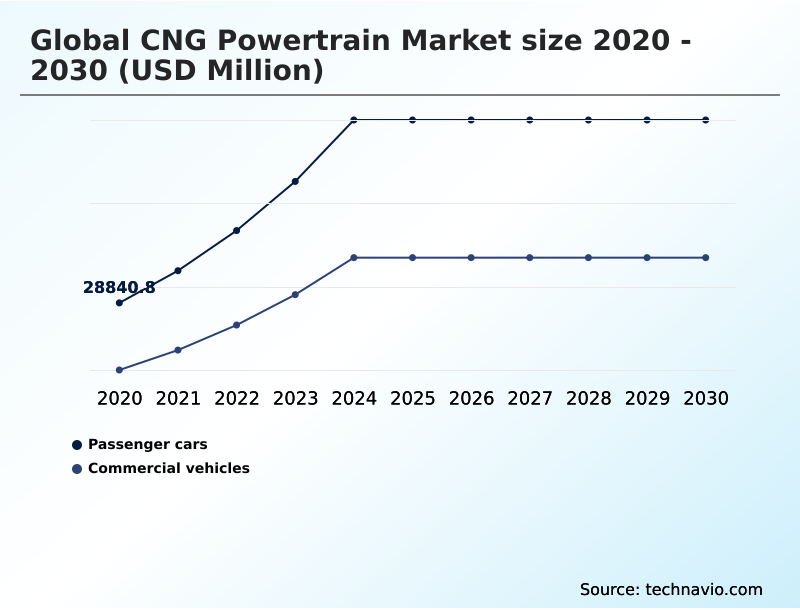
- By Vehicle Type - Passenger cars segment was valued at USD 49.42 billion in 2024
- By Application - Bi-fuel segment accounted for the largest market revenue share in 2024
Market Size & Forecast
- Market Opportunities: USD 188.28 billion
- Market Future Opportunities: USD 141.11 billion
- CAGR from 2025 to 2030 : 19.6%
Market Summary
- The CNG powertrain market is advancing, driven by stringent emissions regulations and the compelling economic case for natural gas as a transport fuel. Continuous innovation in natural gas engine technology, including advanced combustion control strategies and high-pressure direct injection systems, is bridging the performance gap with traditional diesel engines. This allows for broader application in heavy-duty trucking and commercial transport.
- A key trend is the strategic shift toward renewable natural gas (RNG), which enables fleet operators to achieve significant reductions in lifecycle greenhouse gas emissions and pursue carbon neutrality goals. For instance, a logistics company can transition its fleet to RNG using existing cng refueling infrastructure, immediately lowering its carbon footprint without massive capital outlays on new vehicle types.
- However, the expansion of this infrastructure remains a persistent challenge, creating a classic dilemma where vehicle adoption is constrained by refueling availability. The move toward integrated, oem-fitted cng systems, as opposed to aftermarket conversions, is enhancing reliability and boosting consumer confidence in both passenger and commercial sectors.
- This comprehensive evolution underscores the market's role as a critical transitional solution in global efforts toward cleaner energy.
What will be the Size of the CNG Powertrain Market during the forecast period?
Get Key Insights on Market Forecast (PDF) Get Free Sample
How is the CNG Powertrain Market Segmented?
The cng powertrain industry research report provides comprehensive data (region-wise segment analysis), with forecasts and estimates in "USD million" for the period 2026-2030, as well as historical data from 2020-2024 for the following segments.
- Vehicle type
- Passenger cars
- Commercial vehicles
- Application
- Bi-fuel
- Mono-fuel
- Type
- FWD
- RWD
- AWD
- Geography
- APAC
- China
- Japan
- India
- North America
- US
- Canada
- Mexico
- Europe
- Germany
- UK
- France
- South America
- Brazil
- Argentina
- Middle East and Africa
- Saudi Arabia
- UAE
- South Africa
- Rest of World (ROW)
- APAC
By Vehicle Type Insights
The passenger cars segment is estimated to witness significant growth during the forecast period.
The passenger cars segment is influenced by demands for lower operational costs and heightened environmental awareness in urban areas, supported by a developed refueling infrastructure.
Automakers are engineering sophisticated bi-fuel systems to alleviate range anxiety, enabling seamless transitions between CNG and gasoline.
Innovations in engine design innovation and powertrain system integration have led to compact, lightweight CNG cylinders that preserve cargo space and enhance cng vehicle performance.
A key trend is the shift toward factory-installed systems over alternative fuel conversion kits, which boosts consumer confidence with greater reliability and warranty coverage.
This focus on small to medium-sized passenger vehicle platforms, where the economic benefits of cng engine efficiency are most significant, is expanding the market for light commercial vehicles, with modern engines showing a fifteen percent increase in thermal efficiency.
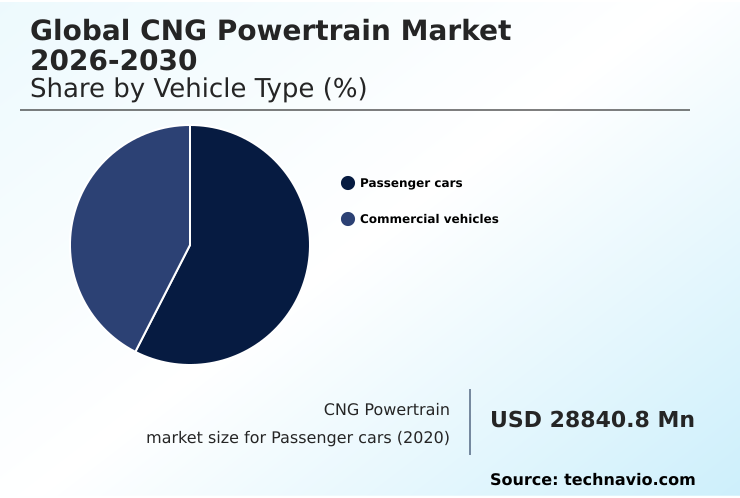
The Passenger cars segment was valued at USD 49.42 billion in 2024 and showed a gradual increase during the forecast period.
Regional Analysis
APAC is estimated to contribute 68.4% to the growth of the global market during the forecast period.Technavio’s analysts have elaborately explained the regional trends and drivers that shape the market during the forecast period.
See How CNG Powertrain Market Demand is Rising in APAC Get Free Sample
The geographic landscape of the global CNG powertrain market is dominated by the APAC region, which accounts for approximately 68% of the market's incremental growth.
This expansion is driven by stringent emission regulations and the pressing need to improve urban air quality in high-population centers like India and China.
In these markets, the lower cost of natural gas compared to conventional fuels provides a strong incentive for both commercial transport applications and private vehicle owners.
The development of advanced turbocharging for heavy-duty natural gas engines and efficient low-emission drivetrains is making cng a viable alternative to diesel. While aftermarket conversions were once common, the market is shifting toward more reliable factory-installed mono-fuel system options.
This transition, combined with improvements in fuel storage technology and the expansion of the vehicle propulsion system, is critical for mitigating range anxiety and supporting the region's leadership in the sustainable transport transition, where uptime has been proven to increase by over 5% compared to older systems.
Market Dynamics
Our researchers analyzed the data with 2025 as the base year, along with the key drivers, trends, and challenges. A holistic analysis of drivers will help companies refine their marketing strategies to gain a competitive advantage.
- Strategic decision-making in the global CNG powertrain market 2026-2030 is increasingly shaped by a nuanced understanding of its underlying technologies and operational benefits. The clear cost benefits of cng vs diesel remain a primary driver, particularly for commercial fleet operators evaluating the total cost of ownership cng trucks. However, the conversation is shifting beyond simple fuel price arbitrage.
- Advancements in cng fuel storage, specifically lightweight cng cylinder technology benefits, are mitigating historical drawbacks related to vehicle weight and range. The cng powertrain for commercial vehicles is now a sophisticated solution, with options for both bi-fuel system vs mono-fuel system configurations to meet diverse operational needs.
- The impact of rng on fleet operations is a transformative trend, offering a direct path to reducing emissions with cng powertrains and aligning with corporate sustainability mandates. For businesses considering adoption, evaluating cng powertrain maintenance requirements and the availability of cng infrastructure for long-haul trucks is crucial.
- The thermal efficiency of natural gas engines has improved by double digits in recent years, a testament to innovations in cng fuel injection system design and high-pressure direct injection in cng engines.
- As oem-fitted cng passenger cars and the cng powertrain market for buses expand, the distinction between factory-fitted vs aftermarket cng systems becomes a key factor in ensuring long-term performance and reliability.
What are the key market drivers leading to the rise in the adoption of CNG Powertrain Industry?
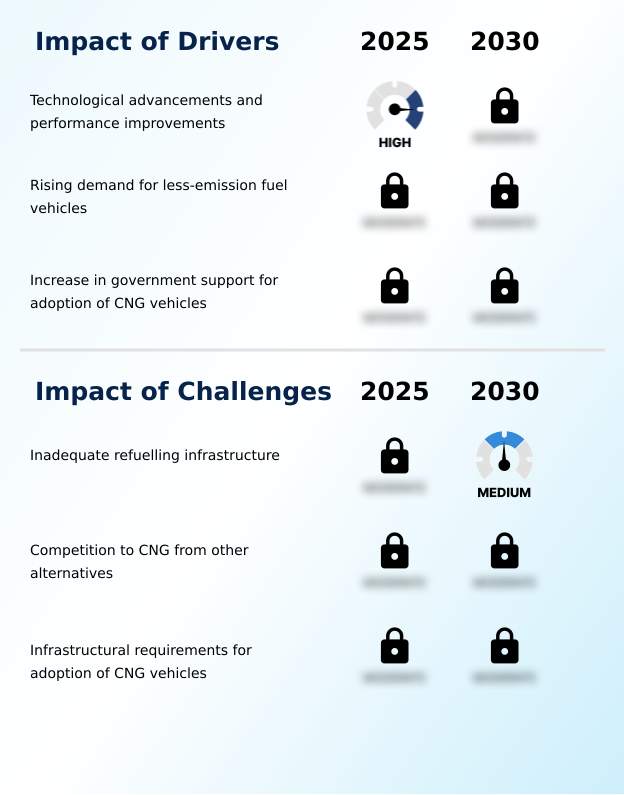
- Technological advancements and resulting performance improvements are key drivers propelling the global CNG powertrain market.
- Technological advancements are a primary driver, significantly improving the total cost of ownership for operators of urban mobility solutions. The proliferation of oem-fitted cng systems and factory-fitted cng kits ensures higher quality and reliability compared to aftermarket options.
- Innovations such as intelligent injection systems and dual fuel technologies enhance performance on alternative fuel vehicle platforms, making them competitive with conventional engines. For long-haul trucking solutions, new lightweight cng cylinders extend operational range, a critical factor for fleet decarbonization.
- These performance improvements are substantial, with modern systems demonstrating fuel efficiency gains of up to 15% over previous generations, directly impacting profitability and accelerating adoption across commercial sectors.
What are the market trends shaping the CNG Powertrain Industry?
- A defining trend is the growing emphasis on renewable natural gas. This presents a compelling pathway to decarbonize transportation using existing vehicle technology.
- A defining trend in the global CNG powertrain market 2026-2030 is the strategic shift toward renewable natural gas (rng) to meet carbon neutrality goals. This trend leverages existing natural gas engine technology and cng refueling infrastructure, offering a pragmatic path to decarbonization for commercial vehicle powertrains.
- Innovations in high-pressure direct injection and combustion control strategies are making heavy-duty trucking applications more viable, with some fleets reporting over 90% reductions in particulate matter. The development of lightweight type iv composite cylinders is improving vehicle range and payload capacity. Simultaneously, the adoption of advanced bi-fuel system options provides operational flexibility, enhancing the appeal of CNG for fleet operators.
- This convergence of factors is solidifying CNG's role as a key transitional fuel.
What challenges does the CNG Powertrain Industry face during its growth?
- The inadequate and underdeveloped refueling infrastructure remains a key challenge affecting the widespread adoption of CNG vehicles.
- A significant challenge remains the inconsistent availability of refueling infrastructure, which limits the practicality of CNG for operations beyond dedicated return-to-base fleet operations. While city gas distribution networks are expanding in certain regions, widespread adoption of cng powertrain technologies is hindered by this gap. Advanced gaseous fuel systems and innovative drivetrain solutions require a reliable network to be fully effective.
- The promise of fuel-agnostic platforms and sustainable transport systems is compelling, but their potential is capped without adequate infrastructure support. This disparity forces a continued reliance on less efficient systems and slows the reduction of lifecycle greenhouse gas emissions, where advanced systems could otherwise cut emissions by over 25% compared to older diesel models.
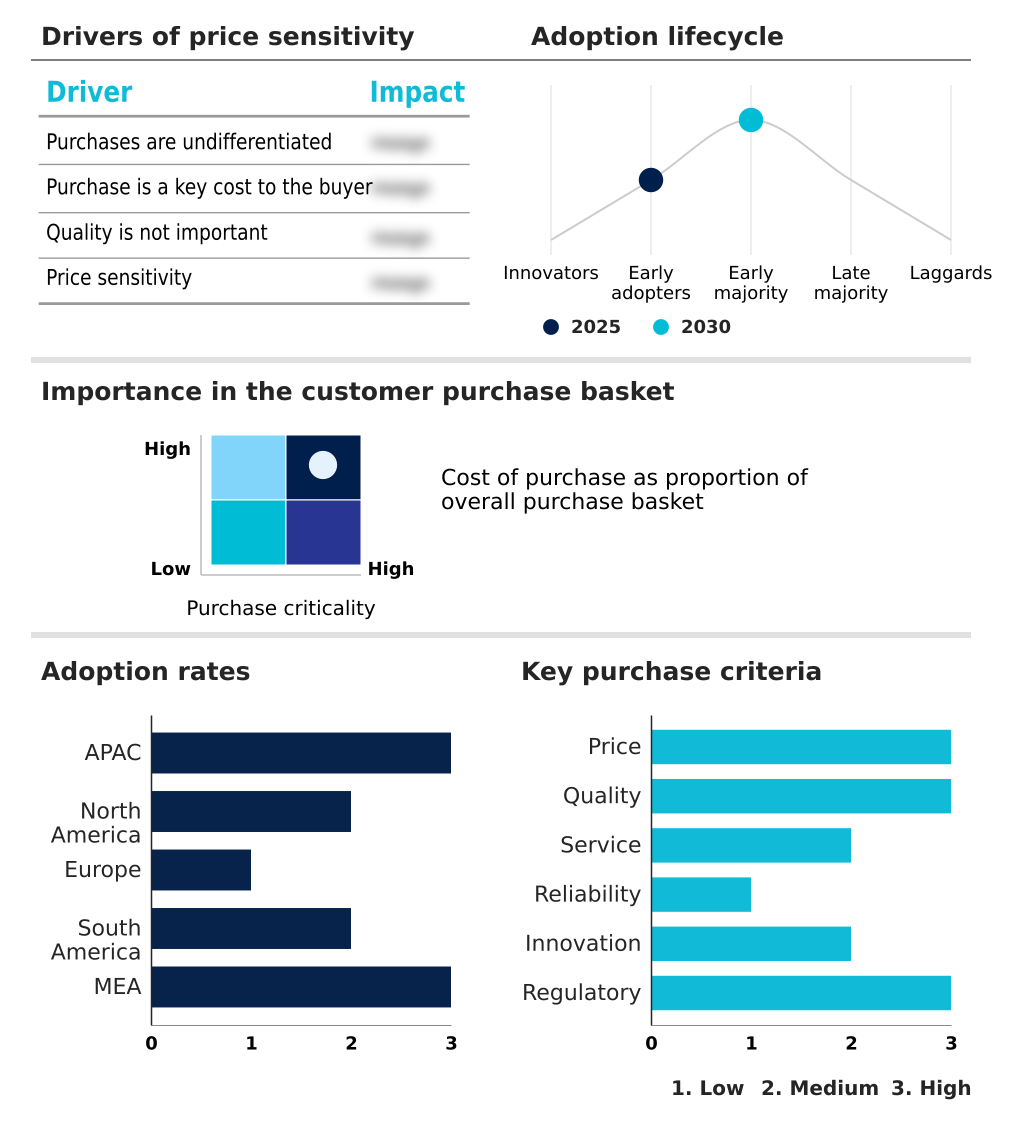
Exclusive Technavio Analysis on Customer Landscape
The cng powertrain market forecasting report includes the adoption lifecycle of the market, covering from the innovator’s stage to the laggard’s stage. It focuses on adoption rates in different regions based on penetration. Furthermore, the cng powertrain market report also includes key purchase criteria and drivers of price sensitivity to help companies evaluate and develop their market growth analysis strategies.
Customer Landscape of CNG Powertrain Industry
Competitive Landscape
Companies are implementing various strategies, such as strategic alliances, cng powertrain market forecast, partnerships, mergers and acquisitions, geographical expansion, and product/service launches, to enhance their presence in the industry.
AB Volvo - Key offerings include advanced CNG powertrain technologies, from high-efficiency natural gas engines to fully integrated, low-emission drivetrains designed for diverse global vehicle applications.
The industry research and growth report includes detailed analyses of the competitive landscape of the market and information about key companies, including:
- AB Volvo
- Ashok Leyland Ltd.
- Cummins Inc.
- Daimler Truck AG
- Hyundai Motor Co.
- International Motors LLC
- Iveco Group N.V
- MAN Truck and Bus SE
- Maruti Suzuki India Ltd.
- OMVL S.p.A.
- Prins Autogassystemen B.V.
- Robert Bosch GmbH
- Scania AB
- Tata Motors Ltd.
- Toyota Motor Corp.
- TVS Motor Co.
- WeiChai Holding Group Co. Ltd.
- Westport Fuel Systems Italia
Qualitative and quantitative analysis of companies has been conducted to help clients understand the wider business environment as well as the strengths and weaknesses of key industry players. Data is qualitatively analyzed to categorize companies as pure play, category-focused, industry-focused, and diversified; it is quantitatively analyzed to categorize companies as dominant, leading, strong, tentative, and weak.
Recent Development and News in Cng powertrain market
- In January 2025, Volvo Group unveiled its new G13C natural gas powertrain, featuring a high-pressure direct injection system that increased thermal efficiency by fifteen percent, making its performance comparable to diesel counterparts.
- In February 2025, the European Automobile Manufacturers Association (ACEA) reported a significant slowdown in new CNG station construction, highlighting infrastructure gaps on critical freight routes that challenge long-haul trucking operations.
- In May 2025, UPS entered a landmark agreement with Clean Energy Fuels Corp. for a long-term supply of renewable natural gas to power a significant portion of its North American heavy-duty truck fleet.
- In June 2025, Maruti Suzuki India Ltd. launched the updated Grand Vitara S-CNG model, integrating advanced safety features and targeting the growing demand for CNG-powered sport utility vehicles.
Dive into Technavio’s robust research methodology, blending expert interviews, extensive data synthesis, and validated models for unparalleled CNG Powertrain Market insights. See full methodology.
| Market Scope | |
|---|---|
| Page number | 287 |
| Base year | 2025 |
| Historic period | 2020-2024 |
| Forecast period | 2026-2030 |
| Growth momentum & CAGR | Accelerate at a CAGR of 19.6% |
| Market growth 2026-2030 | USD 141113.9 million |
| Market structure | Fragmented |
| YoY growth 2025-2026(%) | 17.6% |
| Key countries | China, Japan, India, South Korea, Australia, Indonesia, US, Canada, Mexico, Germany, UK, France, Italy, Spain, The Netherlands, Brazil, Argentina, Chile, Saudi Arabia, UAE, South Africa, Israel and Turkey |
| Competitive landscape | Leading Companies, Market Positioning of Companies, Competitive Strategies, and Industry Risks |
Research Analyst Overview
- The global CNG powertrain market 2026-2030 is defined by significant technological progress in engine design innovation and performance. The development of advanced natural gas fuel system and sophisticated drivetrain solutions has enabled cng vehicle performance to rival that of traditional diesel engines, particularly in heavy-duty applications.
- Innovations such as high-pressure direct injection, advanced turbocharging, and optimized combustion control strategies are central to this evolution, delivering enhanced cng engine efficiency and substantial emission reduction. The industry is also seeing a move from alternative fuel conversion kits to integrated, factory-fitted cng kits and oem-fitted cng systems, which offer superior reliability.
- Key components like lightweight cng cylinders and advanced cng injectors are mitigating historical challenges related to range and power. These cng powertrain technologies, including bi-fuel system and mono-fuel system options, are being integrated into ever-more-efficient gaseous fuel systems.
- This commitment to innovation is exemplified by new platforms demonstrating a fifteen percent increase in thermal efficiency, solidifying CNG's role in the transition to cleaner transportation.
What are the Key Data Covered in this CNG Powertrain Market Research and Growth Report?
-
What is the expected growth of the CNG Powertrain Market between 2026 and 2030?
-
USD 141.11 billion, at a CAGR of 19.6%
-
-
What segmentation does the market report cover?
-
The report is segmented by Vehicle Type (Passenger cars, and Commercial vehicles), Application (Bi-fuel, and Mono-fuel), Type (FWD, RWD, and AWD) and Geography (APAC, North America, Europe, South America, Middle East and Africa)
-
-
Which regions are analyzed in the report?
-
APAC, North America, Europe, South America and Middle East and Africa
-
-
What are the key growth drivers and market challenges?
-
Technological advancements and performance improvements, Inadequate refuelling infrastructure
-
-
Who are the major players in the CNG Powertrain Market?
-
AB Volvo, Ashok Leyland Ltd., Cummins Inc., Daimler Truck AG, Hyundai Motor Co., International Motors LLC, Iveco Group N.V, MAN Truck and Bus SE, Maruti Suzuki India Ltd., OMVL S.p.A., Prins Autogassystemen B.V., Robert Bosch GmbH, Scania AB, Tata Motors Ltd., Toyota Motor Corp., TVS Motor Co., WeiChai Holding Group Co. Ltd. and Westport Fuel Systems Italia
-
Market Research Insights
- The market dynamics for CNG powertrains reflect a complex interplay of economic incentives and technological evolution. Fleet decarbonization efforts are a primary catalyst, with adoption rates in some regions outpacing others by over 2 percentage points annually.
- The favorable total cost of ownership continues to drive demand for urban mobility solutions and long-haul trucking solutions, where fuel expenses constitute a major operational cost. Innovations in dual fuel technologies are expanding the utility of alternative fuel vehicle platforms, offering flexibility that directly addresses operational concerns.
- For example, advancements in intelligent injection systems have improved fuel efficiency by more than 10%, directly enhancing the financial viability of factory-fitted cng kits and oem-fitted cng systems. These improvements in lightweight cng cylinders are critical for making powertrains more appealing across a wider range of vehicle types.
We can help! Our analysts can customize this cng powertrain market research report to meet your requirements.
 RIA -
RIA - 
