Coding Bootcamp Market Size 2025-2029
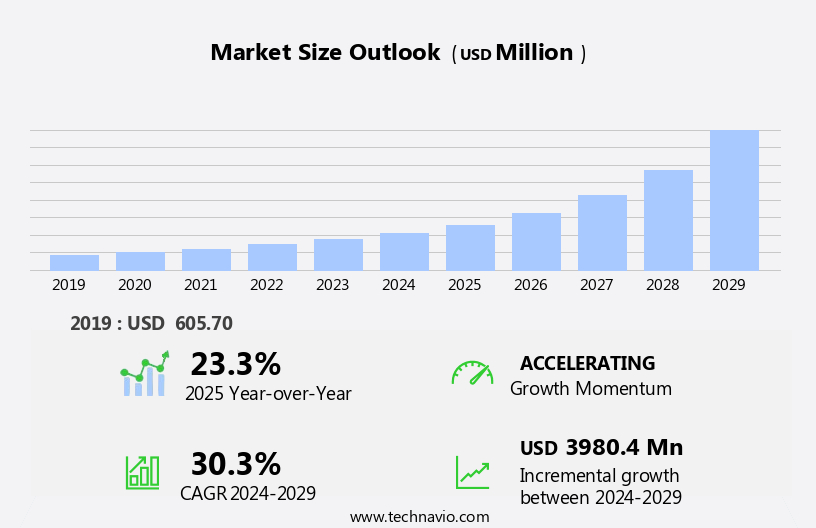
The coding bootcamp market size is forecast to increase by USD 3.98 billion at a CAGR of 30.3% between 2024 and 2029.
- The market is experiencing significant growth due to several key factors. The increasing demand for software developers and IT professionals in various industries is driving the need for more efficient and effective training programs. Coding bootcamps, with their interactive and intensive curriculum, offer a viable solution to meet this demand. Additionally, the rise of ready-to-work coding bootcamps provides employers with a pool of skilled and prepared candidates, reducing the time and resources required for traditional hiring and training processes. Furthermore, the trend towards formal education in tech fields is also contributing to the market's growth, as individuals seek to upskill or reskill in response to industry demands. Overall, the market is poised for continued expansion, offering a valuable opportunity for individuals seeking to enter the tech industry and for businesses looking to stay competitive.
What will be the Size of the Coding Bootcamp Market During the Forecast Period?
- The market in the US continues to experience strong growth, driven by the increasing demand for tech-savvy individuals with specialized skills in areas such as software engineering, artificial intelligence, machine learning, automation, IoT, cloud computing, and web development. As IT fields evolve and expand, job positions like AI developer, technical careers in hiring and onboarding, and various tech-based roles require advanced problem-solving skills and technical expertise. Universities and traditional education methods can't always keep up with the industry's rapidly changing demands. Coding bootcamps offer intensive, accelerated learning programs that equip students with hands-on experience in programming, software development, and other essential technical skills.
- Additionally, these boot camps provide a future-ready workforce, focusing on coding efficiency and real-world application, which is increasingly preferred by employers. Online bootcamps have also gained popularity due to their flexibility and affordability, allowing individuals to learn at their own pace and convenience. Corporate training programs have started to recognize the value of coding bootcamps, integrating specialized courses into their upskilling initiatives to maintain a competitive edge in the market. Overall, the market is poised for continued growth, providing an essential bridge between technical education and the workforce.
How is this Coding Bootcamp Industry segmented and which is the largest segment?
The coding bootcamp industry research report provides comprehensive data (region-wise segment analysis), with forecasts and estimates in "USD billion" for the period 2025-2029, as well as historical data from 2019-2023 for the following segments.
- End-user
- Individual learners
- Institutional learners
- Language
- Java
- Python
- .NET
- Ruby
- Others
- Delivery Mode
- Full-time bootcamps
- Part-time bootcamps
- Geography
- North America
- Canada
- US
- APAC
- China
- India
- Japan
- South Korea
- Europe
- Germany
- UK
- France
- Italy
- South America
- Middle East and Africa
- North America
By End-user Insights
- The individual learners segment is estimated to witness significant growth during the forecast period.
The US job market for computer science and Information Technology (IT) professionals is projected to expand by 15% from 2021 to 2031, according to the US Bureau of Labor Statistics (BLS), which is significantly higher than the average growth rate for all occupations. This growth is expected to create approximately 682,800 new jobs during this period. The increasing demand for IT professionals is driven by the essential role software engineering and web development play in various industries.
Additionally, coding bootcamps have gained popularity due to their cost-effective nature, providing an accessible and efficient solution for individuals seeking to acquire coding skills in Java, Python, and other programming languages. These intensive training programs offer a practical and interactive learning experience for aspiring data engineers, data scientists, database administrators, mobile application developers, cloud architects, and other IT professionals. The market is poised for growth as a result.
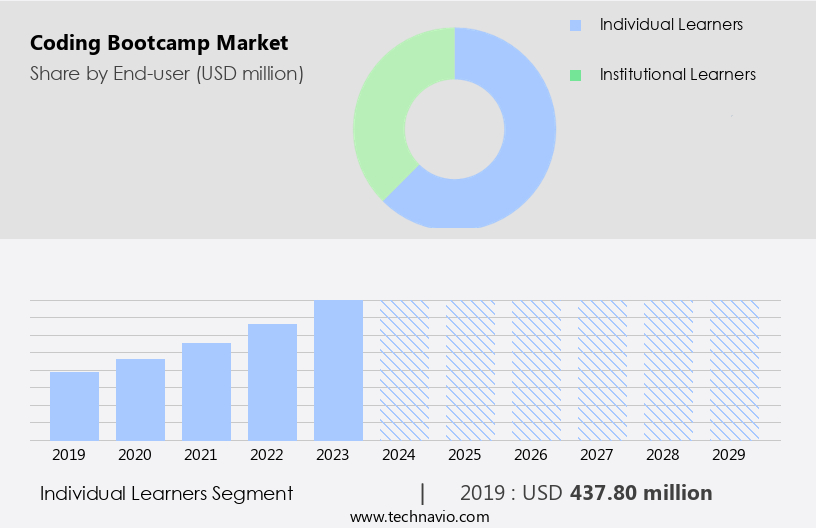
Get a glance at the Coding Bootcamp Industry report of share of various segments Request Free Sample
The individual learners segment was valued at USD 437.80 million in 2019 and showed a gradual increase during the forecast period.
Regional Analysis
- North America is estimated to contribute 47% to the growth of the global market during the forecast period.
Technavio's analysts have elaborately explained the regional trends and drivers that shape the market during the forecast period.

For more insights on the market share of various regions, Request Free Sample
The North American market is a thriving sector for software engineering skills development. Various institutions and training centers offer accelerated programming courses, providing hands-on experience and coding efficiency. Tech-based jobs continue to increase in demand, making coding bootcamps an attractive option for individuals seeking to enter this industry. Cities such as San Francisco, New York, and Seattle, known for their strong tech industries, host numerous coding bootcamps. Students benefit from real-world project exposure, networking opportunities, and potential employment prospects in these urban environments. The market in North America is a significant contributor to the region's innovation and technical skill development.
Market Dynamics
Our coding bootcamp market researchers analyzed the data with 2024 as the base year, along with the key drivers, trends, and challenges. A holistic analysis of drivers will help companies refine their marketing strategies to gain a competitive advantage.
What are the key market drivers leading to the rise in adoption of Coding Bootcamp Industry?
The increasing need for software developers and IT professionals is the key driver of the market.
- The market in the US is experiencing significant growth due to the increasing demand for software engineers and IT professionals. This demand is driven by the widespread integration of technology in various industries, leading to an increased need for individuals with coding skills in programming languages such as Java, Python, and JavaScript, as well as expertise in web development, mobile application development, and software engineering. Furthermore, the importance of data analysis, artificial intelligence (AI), machine learning, automation, Internet of Things (IoT), cloud computing, and cybersecurity is fueling the demand for IT professionals with specialized skills in these areas. The tech industry's shift towards digital transformation has created a high demand for job positions like AI developer, data engineer, data scientist, database administrator, cloud architect, and more.
- Additionally, online learning platforms and ed-tech companies offer intensive training programmes, flexible schedules, and self-paced courses to help individuals acquire the necessary skills and become job-ready. Additionally, corporate training and specialized niche courses are also popular options for institutional learners and individual learners alike. The future-ready tech workforce is expected to be tech-savvy, problem-solving, and skilled in digital technologies. Online bootcamps, accelerated learning, and e-learning are becoming increasingly popular for their hands-on experience and career support. The market for coding skills training is expected to continue growing as technology-based jobs become more prevalent, and coding efficiency and user experience design become essential for businesses to remain competitive.
What are the market trends shaping the Coding Bootcamp Industry?
Increasing ready-to-work coding bootcamps is the upcoming trend in the market.
- Coding bootcamps have gained significant traction in the US job market as they address the sudden demand for IT skills in various sectors. These intensive training programs transform individuals into junior developers, focusing on full-stack web development, artificial intelligence, machine learning, automation, IoT, cloud computing, and other IT fields. The curriculum covers programming languages like Java, Python, JavaScript, HTML & CSS, and niche areas such as e-commerce, data science, and user experience design. Ready-to-work bootcamps offer flexible schedules, with full-time and part-time options. Full-time bootcamps require 6-10 hours of daily commitment, while part-time programs demand 3-5 hours. Notable organizations offering these programs include General Assembly, Coding Dojo, and App Academy.
- Additionally, these bootcamps provide hands-on experience, accelerated learning, and career support. They prepare individuals for technical careers such as software engineering, cybersecurity, data engineering, data science, database administration, mobile application development, cloud architecture, and product management. With a focus on problem-solving skills, technical skills, and digital technologies, these bootcamps aim to produce job-ready individuals. Online bootcamps and e-learning platforms are also popular, offering recorded lectures, academic support, and career services. These platforms cater to individual learners and institutional learners alike, enabling skill development in a self-paced, part-time, or full-time remote setting. Coding bootcamps play a crucial role in upskilling the tech workforce by providing intensive, future-ready training in various IT fields. They equip participants with the necessary skills to excel in tech-based jobs and adapt to the ever-evolving digital landscape.
What challenges does Coding Bootcamp Industry face during the growth?
An increase in formal education is a key challenge affecting the industry's growth.
- The IT industries' ongoing digital transformation and the increasing demand for tech-savvy individuals with specialized skills in areas like artificial intelligence (AI), machine learning, automation, IoT, cloud computing, and web development have fueled the growth of coding bootcamps in the US. These intensive training programs offer individuals, both institutional and individual learners, the opportunity to acquire coding skills and expertise in various programming languages such as Java, Python, JavaScript, HTML & CSS, and others, through flexible schedules and self-paced or part-time learning. Coding bootcamps provide hands-on experience and career support, preparing job-ready individuals for a range of technical careers, including AI developer, data engineer, data scientist, database administrator, mobile application developer, cloud architect, and more.
- Additionally, these niche and specialized courses cater to the growing demand for tech talent in various industries, from e-commerce to cybersecurity, user experience design, product management, full-stack web development, and more. Despite the growth of coding bootcamps, the formal education sector, including universities, continues to dominate the skills training landscape. The increasing number of students enrolling in computer science engineering programs and the preference of employers for degree-holding candidates in some regions stifle the emergence of coding bootcamps. However, the accelerated learning and customization models offered by coding bootcamps, along with the convenience of online learning and recorded lectures, make them an attractive alternative for individuals seeking to upskill or reskill quickly and efficiently. The market is poised for growth as the demand for tech talent continues to rise. The market dynamics are driven by the increasing importance of technical skills in various industries and the need for individuals to upskill and reskill quickly and efficiently. While formal education institutions continue to dominate the skills training landscape, coding bootcamps offer a flexible, efficient, and cost-effective alternative for individuals seeking to enter the tech workforce or advance their careers.
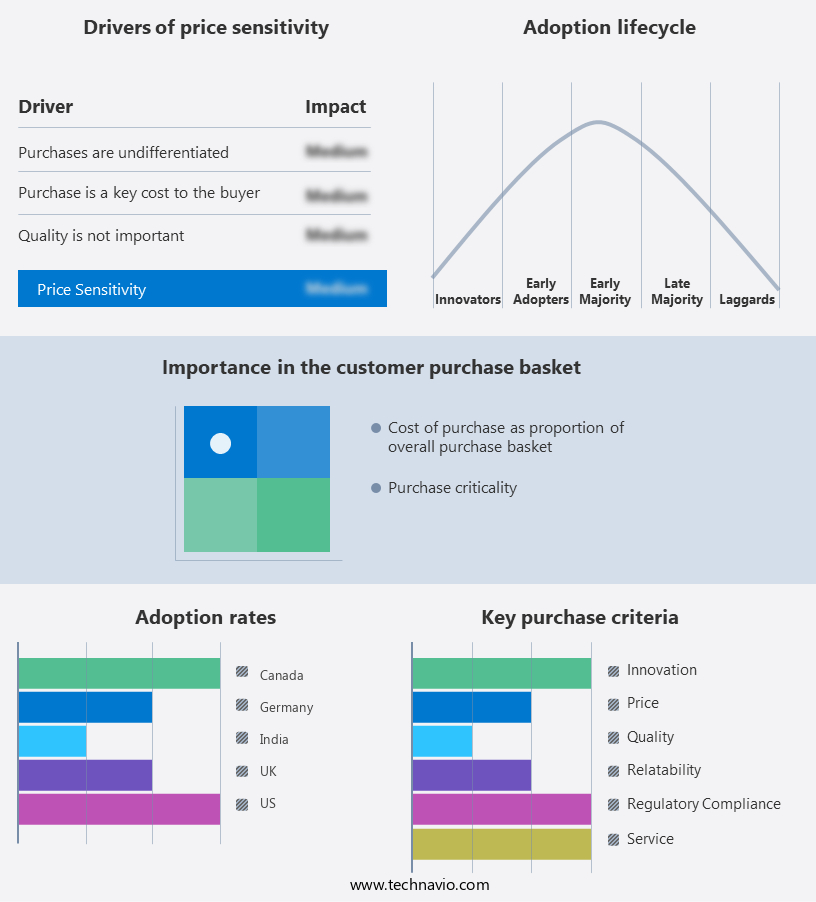
Exclusive Customer Landscape
The coding bootcamp market forecasting report includes the adoption lifecycle of the market, covering from the innovator's stage to the laggard's stage. It focuses on adoption rates in different regions based on penetration. Furthermore, the market report also includes key purchase criteria and drivers of price sensitivity to help companies evaluate and develop their market growth analysis strategies.
Customer Landscape
Key Companies & Market Insights
Companies are implementing various strategies, such as strategic alliances, market forecast, partnerships, mergers and acquisitions, geographical expansion, and product/service launches, to enhance their presence in the industry.
Barcelona Code School: The company offers coding bootcamp programs for senior software engineers which provides web development language, learn algorithm scripting and build awesome apps using front end libraries.
The coding bootcamp industry research and growth report includes detailed analyses of the competitive landscape of the market and information about key companies, including:
- 4Geeks Academy LLC
- Academia de Codigo
- Barcelona Code School
- Chegg Inc.
- Dataquest Labs Inc.
- Epicodus Inc.
- Flatiron School LLC
- Fullstack Academy LLC
- General Assembly Space Inc.
- Hackwagon Academy Pte Ltd.
- Hash Map Labs Inc.
- Ironhack Inc.
- LA LOCO SAS
- Launch School
- Makers Academy
- Nippon Telegraph and Telephone Corp.
- Skillcrush Inc.
- Stride Inc.
- Udacity Inc.
- Zip Code Wilmington
Qualitative and quantitative analysis of companies has been conducted to help clients understand the wider business environment as well as the strengths and weaknesses of key industry players. Data is qualitatively analyzed to categorize companies as pure play, category-focused, industry-focused, and diversified; it is quantitatively analyzed to categorize companies as dominant, leading, strong, tentative, and weak.
Research Analyst Overview
The market has experienced remarkable growth in recent years, driven by the increasing demand for tech-savvy individuals in various IT fields. This sector caters to individuals seeking to acquire coding skills and transition into software engineering, data engineering, data science, database administration, mobile application development, cloud architecture, and other technical careers. Coding bootcamps offer intensive training programs designed to equip learners with the necessary skills to excel in these roles. These programs often focus on hands-on experience, problem-solving abilities, and proficiency in programming languages such as Java, Python, JavaScript, HTML & CSS, and Ruby. The market for coding bootcamps is diverse, catering to both individual learners and institutional clients. These programs offer flexible schedules, including part-time and full-time options, as well as self-paced and remote learning opportunities. Furthermore, they provide access to specialized courses in niche areas like artificial intelligence, machine learning, automation, IoT, cloud computing, and cybersecurity. The coding bootcamp industry's growth can be attributed to several factors. The increasing popularity of e-commerce and the rise of Ed-Tech platforms have made skill development more accessible and affordable.
Moreover, the demand for job-ready individuals in the tech industry has led to a growth in hiring and onboarding processes, making coding bootcamps an attractive alternative to traditional university programs. The market for coding bootcamps also benefits from the growing awareness of social media and the need for a future-ready workforce. As digital technologies continue to evolve, the demand for individuals with strong technical skills and problem-solving abilities will only increase. Moreover, coding bootcamps offer a customization model that caters to the unique needs of each learner. They provide academic and career support, recorded lectures, and live instruction to ensure that learners are fully prepared for their chosen careers. The market is expected to continue its growth trajectory, driven by the increasing demand for tech talent and the need for individuals with specialized skills. As the tech workforce becomes more diverse, there is also a growing focus on increasing female labor participation in the industry. Coding bootcamps play a vital role in preparing the workforce for the ever-evolving tech industry. They offer flexible, accessible, and affordable training programs that equip learners with the necessary skills to excel in various IT careers. As the demand for tech talent continues to grow, the market will remain a vital player in the skills training landscape.
|
Coding Bootcamp Market Scope |
|
|
Report Coverage |
Details |
|
Page number |
217 |
|
Base year |
2024 |
|
Historic period |
2019-2023 |
|
Forecast period |
2025-2029 |
|
Growth momentum & CAGR |
Accelerate at a CAGR of 30.3% |
|
Market growth 2025-2029 |
USD 3.98 billion |
|
Market structure |
Fragmented |
|
YoY growth 2024-2025(%) |
23.3 |
|
Key countries |
US, Canada, Germany, China, UK, India, France, Italy, Japan, and South Korea |
|
Competitive landscape |
Leading Companies, Market Positioning of Companies, Competitive Strategies, and Industry Risks |
What are the Key Data Covered in this Market Research and Growth Report?
- CAGR of the Coding Bootcamp industry during the forecast period
- Detailed information on factors that will drive the market growth and forecasting between 2025 and 2029
- Precise estimation of the size of the market and its contribution of the industry in focus to the parent market
- Accurate predictions about upcoming market growth and trends and changes in consumer behaviour
- Growth of the market across North America, APAC, Europe, South America, and Middle East and Africa
- Thorough analysis of the market's competitive landscape and detailed information about companies
- Comprehensive analysis of factors that will challenge the growth of industry companies
We can help! Our analysts can customize this market research report to meet your requirements. Get in touch
 RIA -
RIA - 
