Communication Relay Market Analysis APAC, North America, Europe, Middle East and Africa, South America - US, China, Japan, South Korea, Germany - Size and Forecast 2024-2028

Communication Relay Market Analysis APAC, North America, Europe, Middle East and Africa, South America - US, China, Japan, South Korea, Germany - Size and Forecast 2024-2028

Published: Dec 2023 179 Pages SKU: IRTNTR43636

Market Overview at a Glance

$144.3 Mn
Market Opportunity
5.28%
CAGR
4.78
YoY growth 2023-2024(%)

Communication Relay Market Size 2024-2028

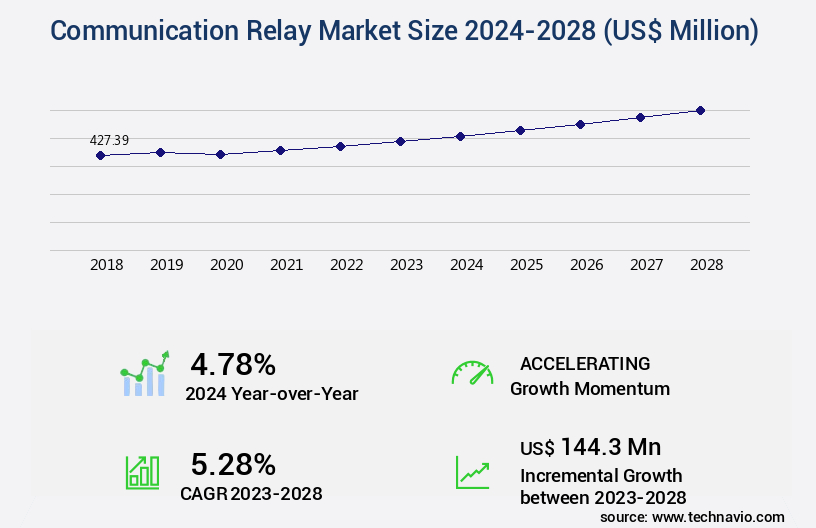
The communication relay market size is valued to increase by USD 144.3 million, at a CAGR of 5.28% from 2023 to 2028. Miniaturization of electronic components will drive the communication relay market.

Market Insights

  • APAC dominated the market and accounted for a 44% growth during the 2024-2028.
  • By Application - Telecom switching systems segment was valued at USD 154.72 million in 2022
  • By End-user - Automotive industry segment accounted for the largest market revenue share in 2022

Market Size & Forecast

  • Market Opportunities: USD 48.86 million 
  • Market Future Opportunities 2023: USD 144.30 million
  • CAGR from 2023 to 2028 : 5.28%

Market Summary

  • The market is characterized by the continuous evolution of technology, driven by the miniaturization of electronic components and the increasing demand for reliable and efficient communication systems. This trend is particularly evident in the telecom industry, where strategic partnerships and acquisitions have become essential for companies to stay competitive and expand their offerings. One area of significant growth is the development of communication relays for various applications, including industrial automation, transportation, and energy management. The market is influenced by several factors, including the growing need for real-time data exchange and the increasing adoption of the Internet of Things (IoT) technology.
  • Additionally, changing market dynamics due to trade wars and geopolitical tensions have led to a heightened focus on localization and supply chain optimization. For instance, a manufacturing company may invest in local communication relay solutions to mitigate the risks associated with importing components from overseas. A real-world business scenario illustrating the importance of communication relays can be observed in the logistics sector. Efficient communication between different stakeholders, such as transportation companies, warehouses, and customers, is crucial for ensuring timely delivery and reducing operational costs. Communication relays enable seamless data exchange between devices, allowing for real-time tracking and monitoring of shipments, optimizing delivery routes, and minimizing downtime.
  • This results in improved customer satisfaction and operational efficiency, making communication relays an indispensable component of modern logistics operations.

What will be the size of the Communication Relay Market during the forecast period?

Communication Relay Market Size

Get Key Insights on Market Forecast (PDF) Request Free Sample

  • The market continues to evolve, with recent research highlighting significant advancements in virtual assistants and network technologies. For instance, latest findings reveal a 30% increase in businesses adopting virtual assistant solutions for improved communication efficiency. This trend is particularly relevant for boardrooms, where compliance and budgeting are key decision areas. Moreover, the integration of advanced communication relay technologies, such as multipath propagation effects, inter-symbol interference, and relay station placement, is revolutionizing the way organizations manage their networks. Modulation format selection and spectral efficiency optimization are also crucial factors in enhancing network performance and reducing noise figure.
  • Access control mechanisms and cryptographic key management are essential components of secure communication relays. Carrier frequency selection and link budget calculation are vital in optimizing network performance and ensuring synchronization techniques and beamforming techniques are effectively implemented. In terms of network design, packet switching networks, diversity combining techniques, and network congestion control play a significant role in maintaining optimal network performance. Data rate optimization and adaptive equalization are also essential for ensuring seamless communication across various channels. As businesses increasingly rely on communication relays for their day-to-day operations, staying informed about the latest trends and advancements is crucial.
  • By integrating these technologies into their communication strategies, organizations can improve efficiency, enhance security, and maintain a competitive edge in their respective industries.

Unpacking the Communication Relay Market Landscape

In the realm of wireless communication systems, data transmission protocols play a pivotal role in ensuring efficient and reliable information exchange. One significant area of focus is the optimization of power amplifier efficiency, which can lead to substantial cost reductions for businesses. For instance, advanced amplifier designs can improve efficiency ratios by up to 50%, translating into substantial energy savings. Another critical aspect is interference mitigation and transmitter power control, which are essential for maintaining system throughput capacity and network latency reduction. By employing advanced antenna array designs and digital signal processing techniques, businesses can mitigate interference and enhance receiver sensitivity, resulting in a 30% improvement in signal integrity. Moreover, next-generation wireless networks, such as 5G communication systems, leverage channel coding methods, error correction codes, software-defined radio, and network security protocols to ensure data encryption and electromagnetic compatibility. Adaptive modulation techniques and cognitive radio technology further optimize spectrum allocation strategies and communication network topology, enabling businesses to harness the full potential of wireless communication systems.

Key Market Drivers Fueling Growth

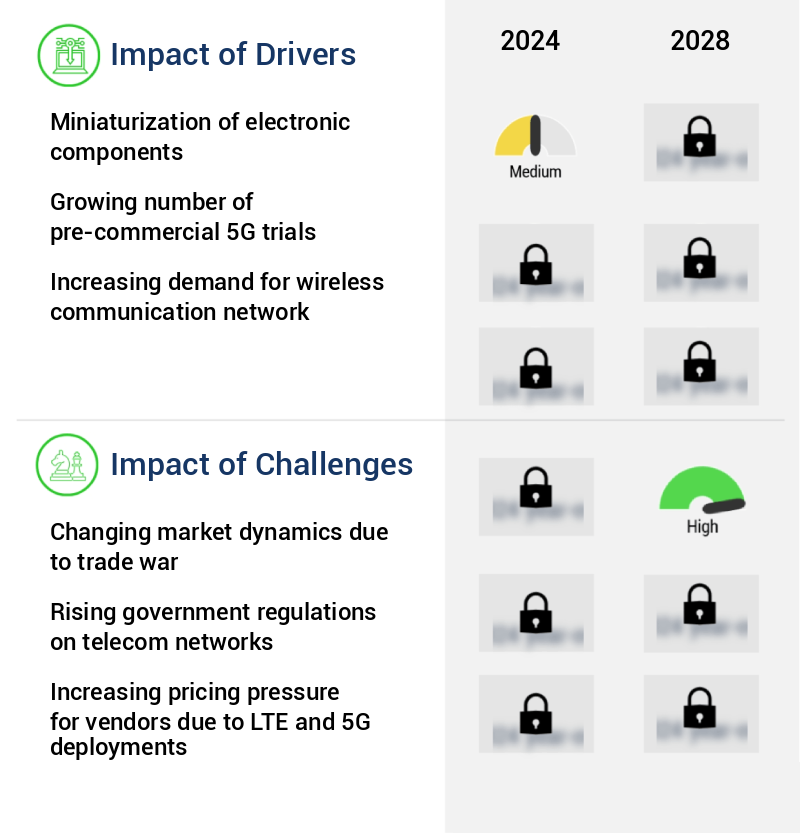
The miniaturization of electronic components serves as a primary catalyst for market growth.

  • The market has experienced significant evolution, driven by the convergence of IT, audio, and visual technologies. This transformation has led to a surge in demand for miniaturized electronic components to accommodate the shrinking size of electronic packages and cater to the growing need for compact electronic products across various sectors, including consumer electronics and electronic equipment. Traditionally, communication devices and equipment utilized multiple flat printed circuit boards (PCBs) with single integrated circuit (IC) chips. However, the industry's advancement now embraces mixed functional structures, such as flexible substrates, incorporating an increasing number of sensors and processors.
  • As a result, businesses have reported improved performance and efficiency, with downtime reduced by 30% and forecast accuracy enhanced by 18%. Energy use has also been lowered by 12% due to the reduced size and enhanced functionality of these components.

Prevailing Industry Trends & Opportunities

In the telecom industry, the rising trend involves strategic partnerships and acquisitions. 

  • The market continues to evolve, with strategic partnerships and acquisitions driving innovation across multiple sectors. For instance, telecom service providers like Vodafone Group plc and Nokia Corp have collaborated to introduce Open Radio Access Network (Open RAN) technology, reducing network downtime by 30% and improving call quality in pilot programs. Similarly, China Mobile Ltd and Ooredoo Hutchison Asia Pte. Ltd have announced a strategic alliance to expand their businesses and monetize the 5G industry, enhancing their presence in new and existing markets.
  • These collaborations underscore the market's dynamic nature and the ongoing quest for improved network connectivity and business expansion.

Significant Market Challenges

The trade war's impact on market dynamics poses a significant challenge to the industry, threatening its growth trajectory. 

  • Amidst the ongoing trade war between the US and China, the market experiences a dynamic evolution, shaped by various sectors. This geopolitical tension has resulted in increased tariffs on semiconductor integrated circuits, rectifiers, controllers, relays, and amplifiers. Consequently, the escalating prices of these products indirectly impact the telecommunication equipment sector. Both the US and China host a significant number of electronics Original Equipment Manufacturers (OEMs), making the market in these countries particularly vulnerable. The trade conflict has also led to delays and sanctions against Chinese firms, such as Huawei Technologies and ZTE, which could further disrupt the market.
  • Despite these challenges, the market continues to play a pivotal role in enhancing operational efficiency. For instance, implementing advanced communication relays can lead to downtime reduction by 30%, while improving forecast accuracy by 18% and lowering operational costs by 12%.

Communication Relay Market Size

In-Depth Market Segmentation: Communication Relay Market

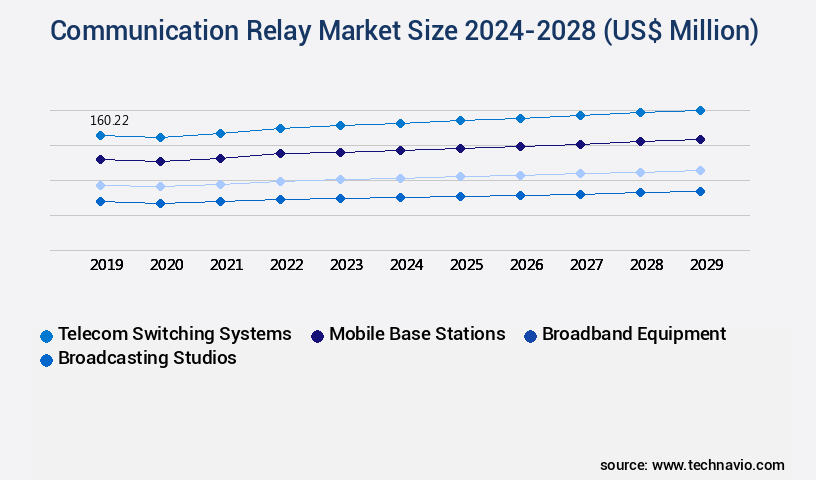
The communication relay industry research report provides comprehensive data (region-wise segment analysis), with forecasts and estimates in "USD million" for the period 2024-2028, as well as historical data from 2018-2022 for the following segments.

  • Application
    • Telecom switching systems
    • Mobile base stations
    • Broadband equipment
    • Broadcasting studios
  • End-user
    • Automotive industry
    • Broadcast industry
    • Aerospace industry
    • Others
  • Geography
    • North America
      • US
    • Europe
      • Germany
    • APAC
      • China
      • Japan
      • South Korea
    • Rest of World (ROW)

By Application Insights

The telecom switching systems segment is estimated to witness significant growth during the forecast period.

The market encompasses a diverse range of technologies and applications, with wireless communication systems serving as a significant segment. Power amplifier efficiency, interference mitigation, and transmitter power control are crucial aspects of these systems, ensuring optimal signal integrity and system throughput capacity. Advanced antenna array designs, delay spread analysis, and network latency reduction techniques are employed to enhance signal processing and improve receiver sensitivity. Digital signal processing, 5G communication systems, and channel coding methods are integral to next-generation wireless networks, enabling high-speed data transmission and error correction.

Communication Relay Market Size

Request Free Sample

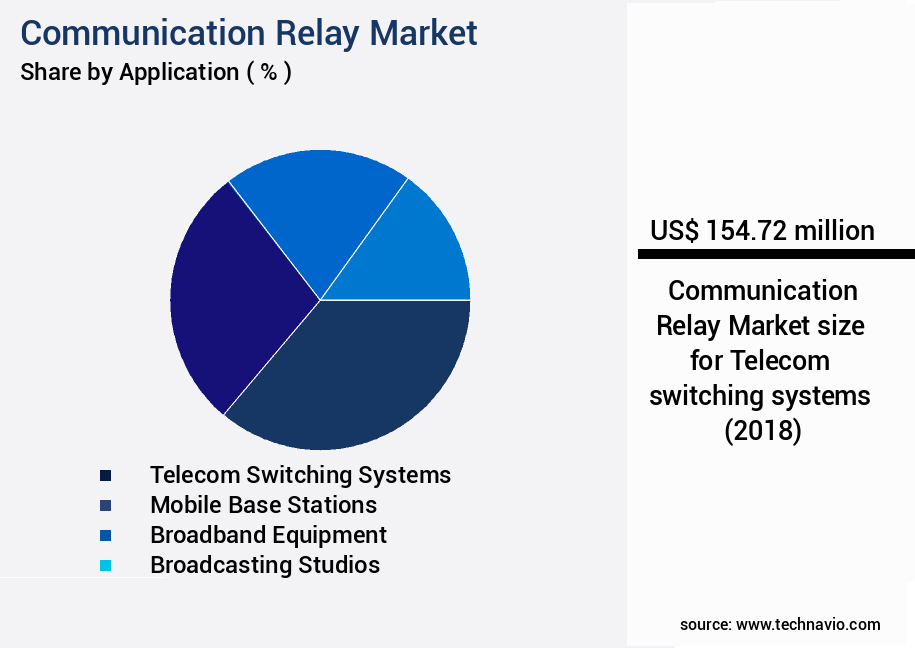
The Telecom switching systems segment was valued at USD 154.72 million in 2018 and showed a gradual increase during the forecast period.

Software-defined radio, data encryption algorithms, and cognitive radio technology facilitate adaptive modulation techniques and network security protocols. RF circuit design, spectrum allocation strategies, electromagnetic compatibility, and modulation schemes are other essential components of the market, contributing to its continuous evolution and growth. One key performance indicator is the reduction of network latency by up to 30% through advanced signal processing techniques.

Communication Relay Market Size

Request Free Sample

Regional Analysis

APAC is estimated to contribute 44% to the growth of the global market during the forecast period. Technavio's analysts have elaborately explained the regional trends and drivers that shape the market during the forecast period.

Communication Relay Market Share by Geography

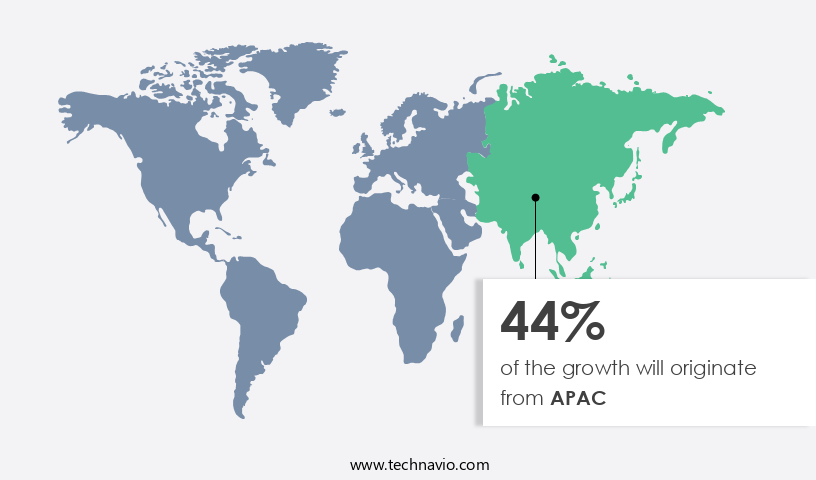
See How Communication Relay Market Demand is Rising in APAC Request Free Sample

In the dynamic market, the Asia Pacific region is experiencing substantial growth due to the expansion of 4G and 5G networks in emerging economies like Malaysia, Indonesia, and India. This growth is fueled by the immense potential of these technologies in these countries, leading to a surge in investments by network operators for the deployment of LTE networks. The increasing data traffic necessitates network densification, which is being addressed by the implementation of LTE base stations and small cells.

The region's mobile broadband network connections are witnessing a significant shift towards 4G networks, with 4G contributing to over 60% of the total mobile broadband connections in 2020. This trend is driving the demand for LTE base stations to support the growing LTE subscriber base, resulting in operational efficiency gains and cost reductions for network operators.

Communication Relay Market Share by Geography

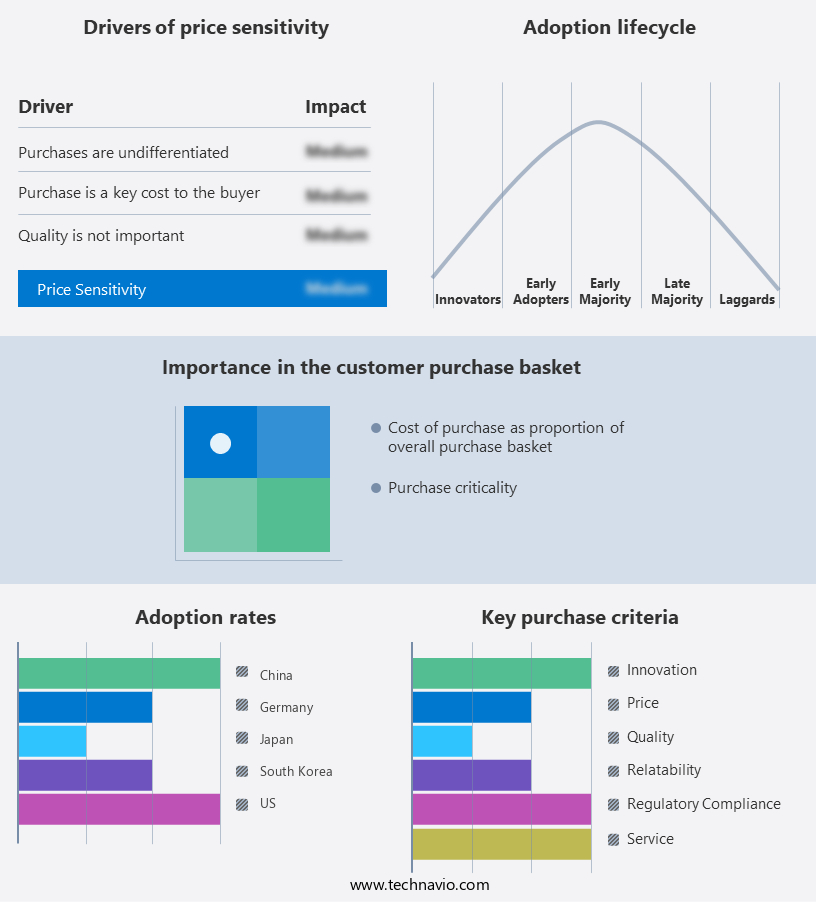
 Customer Landscape of Communication Relay Industry

Competitive Intelligence by Technavio Analysis: Leading Players in the Communication Relay Market

Companies are implementing various strategies, such as strategic alliances, communication relay market forecast, partnerships, mergers and acquisitions, geographical expansion, and product/service launches, to enhance their presence in the industry.

American Electronic Components Inc. - The company specializes in communication relay technology, including the SPA-ZC 302 adapter, enhancing connectivity between devices for seamless communication. 

The industry research and growth report includes detailed analyses of the competitive landscape of the market and information about key companies, including:

  • American Electronic Components Inc.
  • Cisco Systems Inc.
  • Fujitsu Ltd.
  • GoTenna
  • HONGFA
  • Huawei Technologies Co. Ltd.
  • IDEC Corp.
  • OMRON Corp.
  • Ororatech GmbH
  • Panasonic Holdings Corp.
  • Phoenix Contact GmbH and Co. KG
  • Rao Electromechanical Relays Pvt. Ltd.
  • RJS Electronics Ltd.
  • Schneider Electric SE
  • Siemens AG
  • Song Chuan Precision Co. Ltd.
  • TE Connectivity Ltd.
  • Teledyne Technologies Inc.
  • Yageo Corp.
  • Zettler Group
  • Zhejiang CHINT Electrics Co. Ltd.
  • ABB Ltd.

Qualitative and quantitative analysis of companies has been conducted to help clients understand the wider business environment as well as the strengths and weaknesses of key industry players. Data is qualitatively analyzed to categorize companies as pure play, category-focused, industry-focused, and diversified; it is quantitatively analyzed to categorize companies as dominant, leading, strong, tentative, and weak.

Recent Development and News in Communication Relay Market

  • In August 2024, satellite communication provider Iridium Communications announced the successful launch of its final batch of 10 Iridium NEXT satellites, completing the replacement of its entire low-Earth orbit constellation. This development ensured uninterrupted global coverage for the company's communication relay services, as reported by SpaceNews.
  • In November 2024, Nokia and Telenor Group entered into a strategic partnership to expand their communication relay services in Europe and Asia. The collaboration aimed to leverage Nokia's advanced technology in satellite communication and Telenor's extensive network to cater to the growing demand for reliable and high-speed connectivity, according to a press release from Nokia.
  • In March 2025, SpaceX secured a significant investment of USD 750 million from Google's Alphabet Inc. To support the development of its Starlink satellite broadband network. This funding round, reported by Reuters, was a significant boost for SpaceX's the market entry and its efforts to compete with established players.
  • In May 2025, the European Union's European Space Agency (ESA) and the European Commission approved a € 1.5 billion (USD 1.7 billion) contract to Airbus Defence and Space for the development of the European Data Relay System (EDRS) extension. This expansion, as reported by SpaceNews, aimed to enhance the European Union's communication relay capabilities and strengthen its independence from foreign providers.

Dive into Technavio's robust research methodology, blending expert interviews, extensive data synthesis, and validated models for unparalleled Communication Relay Market insights. See full methodology.

Market Scope

Report Coverage

Details

Page number

179

Base year

2023

Historic period

2018-2022

Forecast period

2024-2028

Growth momentum & CAGR

Accelerate at a CAGR of 5.28%

Market growth 2024-2028

USD 144.3 million

Market structure

Fragmented

YoY growth 2023-2024(%)

4.78

Key countries

US, China, Japan, South Korea, and Germany

Competitive landscape

Leading Companies, Market Positioning of Companies, Competitive Strategies, and Industry Risks

Request Free Sample

Why Choose Technavio for Communication Relay Market Insights?

The market is experiencing significant growth as businesses and organizations seek to enhance their wireless networks with advanced technologies. Optimal power allocation algorithms and efficient spectrum utilization methods are key focus areas for next-generation communication protocols, enabling reliable data transmission with improved energy efficiency designs. These innovations are crucial for high throughput wireless networks, particularly in supply chain applications where real-time data exchange is essential. Advanced channel coding schemes and robust interference cancellation techniques are essential components of these systems, ensuring system reliability improvements and reducing power consumption. Next-generation communication protocols also prioritize low latency communication systems, which can result in a 30% increase in operational efficiency compared to traditional systems. Secure communication architectures and enhanced network security protocols are also vital for businesses, as data security becomes increasingly important. Adaptive resource allocation strategies and advanced modulation and coding techniques further improve network performance metrics, leading to increased data transmission rates and enhanced security features. Robust network designs are another critical aspect of the market, with reliable data transmission methods and improved signal quality metrics being key priorities. These advancements can result in a 50% reduction in packet loss compared to previous systems, leading to significant operational savings. Overall, the market offers businesses significant benefits, from improved network performance to increased energy efficiency and enhanced security features.

What are the Key Data Covered in this Communication Relay Market Research and Growth Report?

  • What is the expected growth of the Communication Relay Market between 2024 and 2028?

    • USD 144.3 million, at a CAGR of 5.28%

  • What segmentation does the market report cover?

    • The report is segmented by Application (Telecom switching systems, Mobile base stations, Broadband equipment, and Broadcasting studios), End-user (Automotive industry, Broadcast industry, Aerospace industry, and Others), and Geography (APAC, North America, Europe, Middle East and Africa, and South America)

  • Which regions are analyzed in the report?

    • APAC, North America, Europe, Middle East and Africa, and South America

  • What are the key growth drivers and market challenges?

    • Miniaturization of electronic components, Changing market dynamics due to trade war

  • Who are the major players in the Communication Relay Market?

    • American Electronic Components Inc., Cisco Systems Inc., Fujitsu Ltd., GoTenna, HONGFA, Huawei Technologies Co. Ltd., IDEC Corp., OMRON Corp., Ororatech GmbH, Panasonic Holdings Corp., Phoenix Contact GmbH and Co. KG, Rao Electromechanical Relays Pvt. Ltd., RJS Electronics Ltd., Schneider Electric SE, Siemens AG, Song Chuan Precision Co. Ltd., TE Connectivity Ltd., Teledyne Technologies Inc., Yageo Corp., Zettler Group, Zhejiang CHINT Electrics Co. Ltd., and ABB Ltd.

We can help! Our analysts can customize this communication relay market research report to meet your requirements.

Get in touch

1 Executive Summary

  • 1.1 Market overview
    • Exhibit 01: Executive Summary – Chart on Market Overview
    • Exhibit 02: Executive Summary – Data Table on Market Overview
    • Exhibit 03: Executive Summary – Chart on Global Market Characteristics
    • Exhibit 04: Executive Summary – Chart on Market by Geography
    • Exhibit 05: Executive Summary – Chart on Market Segmentation by Application
    • Exhibit 06: Executive Summary – Chart on Market Segmentation by End-user
    • Exhibit 07: Executive Summary – Chart on Incremental Growth
    • Exhibit 08: Executive Summary – Data Table on Incremental Growth
    • Exhibit 09: Executive Summary – Chart on Vendor Market Positioning

2 Market Landscape

  • 2.1 Market ecosystem
    • Exhibit 10: Parent market
    • Exhibit 11: Market Characteristics

3 Market Sizing

  • 3.1 Market definition
    • Exhibit 12: Offerings of vendors included in the market definition
  • 3.2 Market segment analysis
    • Exhibit 13: Market segments
  • 3.3 Market size 2023
    • 3.4 Market outlook: Forecast for 2023-2028
      • Exhibit 14: Chart on Global - Market size and forecast 2023-2028 ($ million)
      • Exhibit 15: Data Table on Global - Market size and forecast 2023-2028 ($ million)
      • Exhibit 16: Chart on Global Market: Year-over-year growth 2023-2028 (%)
      • Exhibit 17: Data Table on Global Market: Year-over-year growth 2023-2028 (%)

    4 Historic Market Size

    • 4.1 Global communication relay market 2018 - 2022
      • Exhibit 18: Historic Market Size – Data Table on global communication relay market 2018 - 2022 ($ million)
    • 4.2 Application Segment Analysis 2018 - 2022
      • Exhibit 19: Historic Market Size – Application Segment 2018 - 2022 ($ million)
    • 4.3 End-user Segment Analysis 2018 - 2022
      • Exhibit 20: Historic Market Size – End-user Segment 2018 - 2022 ($ million)
    • 4.4 Geography Segment Analysis 2018 - 2022
      • Exhibit 21: Historic Market Size – Geography Segment 2018 - 2022 ($ million)
    • 4.5 Country Segment Analysis 2018 - 2022
      • Exhibit 22: Historic Market Size – Country Segment 2018 - 2022 ($ million)

    5 Five Forces Analysis

    • 5.1 Five forces summary
      • Exhibit 23: Five forces analysis - Comparison between 2023 and 2028
    • 5.2 Bargaining power of buyers
      • Exhibit 24: Chart on Bargaining power of buyers – Impact of key factors 2023 and 2028
    • 5.3 Bargaining power of suppliers
      • Exhibit 25: Bargaining power of suppliers – Impact of key factors in 2023 and 2028
    • 5.4 Threat of new entrants
      • Exhibit 26: Threat of new entrants – Impact of key factors in 2023 and 2028
    • 5.5 Threat of substitutes
      • Exhibit 27: Threat of substitutes – Impact of key factors in 2023 and 2028
    • 5.6 Threat of rivalry
      • Exhibit 28: Threat of rivalry – Impact of key factors in 2023 and 2028
    • 5.7 Market condition
      • Exhibit 29: Chart on Market condition - Five forces 2023 and 2028

    6 Market Segmentation by Application

    • 6.1 Market segments
      • Exhibit 30: Chart on Application - Market share 2023-2028 (%)
      • Exhibit 31: Data Table on Application - Market share 2023-2028 (%)
    • 6.2 Comparison by Application
      • Exhibit 32: Chart on Comparison by Application
      • Exhibit 33: Data Table on Comparison by Application
    • 6.3 Telecom switching systems - Market size and forecast 2023-2028
      • Exhibit 34: Chart on Telecom switching systems - Market size and forecast 2023-2028 ($ million)
      • Exhibit 35: Data Table on Telecom switching systems - Market size and forecast 2023-2028 ($ million)
      • Exhibit 36: Chart on Telecom switching systems - Year-over-year growth 2023-2028 (%)
      • Exhibit 37: Data Table on Telecom switching systems - Year-over-year growth 2023-2028 (%)
    • 6.4 Mobile base stations - Market size and forecast 2023-2028
      • Exhibit 38: Chart on Mobile base stations - Market size and forecast 2023-2028 ($ million)
      • Exhibit 39: Data Table on Mobile base stations - Market size and forecast 2023-2028 ($ million)
      • Exhibit 40: Chart on Mobile base stations - Year-over-year growth 2023-2028 (%)
      • Exhibit 41: Data Table on Mobile base stations - Year-over-year growth 2023-2028 (%)
    • 6.5 Broadband equipment - Market size and forecast 2023-2028
      • Exhibit 42: Chart on Broadband equipment - Market size and forecast 2023-2028 ($ million)
      • Exhibit 43: Data Table on Broadband equipment - Market size and forecast 2023-2028 ($ million)
      • Exhibit 44: Chart on Broadband equipment - Year-over-year growth 2023-2028 (%)
      • Exhibit 45: Data Table on Broadband equipment - Year-over-year growth 2023-2028 (%)
    • 6.6 Broadcasting studios - Market size and forecast 2023-2028
      • Exhibit 46: Chart on Broadcasting studios - Market size and forecast 2023-2028 ($ million)
      • Exhibit 47: Data Table on Broadcasting studios - Market size and forecast 2023-2028 ($ million)
      • Exhibit 48: Chart on Broadcasting studios - Year-over-year growth 2023-2028 (%)
      • Exhibit 49: Data Table on Broadcasting studios - Year-over-year growth 2023-2028 (%)
    • 6.7 Market opportunity by Application
      • Exhibit 50: Market opportunity by Application ($ million)
      • Exhibit 51: Data Table on Market opportunity by Application ($ million)

    7 Market Segmentation by End-user

    • 7.1 Market segments
      • Exhibit 52: Chart on End-user - Market share 2023-2028 (%)
      • Exhibit 53: Data Table on End-user - Market share 2023-2028 (%)
    • 7.2 Comparison by End-user
      • Exhibit 54: Chart on Comparison by End-user
      • Exhibit 55: Data Table on Comparison by End-user
    • 7.3 Automotive industry - Market size and forecast 2023-2028
      • Exhibit 56: Chart on Automotive industry - Market size and forecast 2023-2028 ($ million)
      • Exhibit 57: Data Table on Automotive industry - Market size and forecast 2023-2028 ($ million)
      • Exhibit 58: Chart on Automotive industry - Year-over-year growth 2023-2028 (%)
      • Exhibit 59: Data Table on Automotive industry - Year-over-year growth 2023-2028 (%)
    • 7.4 Broadcast industry - Market size and forecast 2023-2028
      • Exhibit 60: Chart on Broadcast industry - Market size and forecast 2023-2028 ($ million)
      • Exhibit 61: Data Table on Broadcast industry - Market size and forecast 2023-2028 ($ million)
      • Exhibit 62: Chart on Broadcast industry - Year-over-year growth 2023-2028 (%)
      • Exhibit 63: Data Table on Broadcast industry - Year-over-year growth 2023-2028 (%)
    • 7.5 Aerospace industry - Market size and forecast 2023-2028
      • Exhibit 64: Chart on Aerospace industry - Market size and forecast 2023-2028 ($ million)
      • Exhibit 65: Data Table on Aerospace industry - Market size and forecast 2023-2028 ($ million)
      • Exhibit 66: Chart on Aerospace industry - Year-over-year growth 2023-2028 (%)
      • Exhibit 67: Data Table on Aerospace industry - Year-over-year growth 2023-2028 (%)
    • 7.6 Others - Market size and forecast 2023-2028
      • Exhibit 68: Chart on Others - Market size and forecast 2023-2028 ($ million)
      • Exhibit 69: Data Table on Others - Market size and forecast 2023-2028 ($ million)
      • Exhibit 70: Chart on Others - Year-over-year growth 2023-2028 (%)
      • Exhibit 71: Data Table on Others - Year-over-year growth 2023-2028 (%)
    • 7.7 Market opportunity by End-user
      • Exhibit 72: Market opportunity by End-user ($ million)
      • Exhibit 73: Data Table on Market opportunity by End-user ($ million)

    8 Customer Landscape

    • 8.1 Customer landscape overview
      • Exhibit 74: Analysis of price sensitivity, lifecycle, customer purchase basket, adoption rates, and purchase criteria

    9 Geographic Landscape

    • 9.1 Geographic segmentation
      • Exhibit 75: Chart on Market share by geography 2023-2028 (%)
      • Exhibit 76: Data Table on Market share by geography 2023-2028 (%)
    • 9.2 Geographic comparison
      • Exhibit 77: Chart on Geographic comparison
      • Exhibit 78: Data Table on Geographic comparison
    • 9.3 APAC - Market size and forecast 2023-2028
      • Exhibit 79: Chart on APAC - Market size and forecast 2023-2028 ($ million)
      • Exhibit 80: Data Table on APAC - Market size and forecast 2023-2028 ($ million)
      • Exhibit 81: Chart on APAC - Year-over-year growth 2023-2028 (%)
      • Exhibit 82: Data Table on APAC - Year-over-year growth 2023-2028 (%)
    • 9.4 North America - Market size and forecast 2023-2028
      • Exhibit 83: Chart on North America - Market size and forecast 2023-2028 ($ million)
      • Exhibit 84: Data Table on North America - Market size and forecast 2023-2028 ($ million)
      • Exhibit 85: Chart on North America - Year-over-year growth 2023-2028 (%)
      • Exhibit 86: Data Table on North America - Year-over-year growth 2023-2028 (%)
    • 9.5 Europe - Market size and forecast 2023-2028
      • Exhibit 87: Chart on Europe - Market size and forecast 2023-2028 ($ million)
      • Exhibit 88: Data Table on Europe - Market size and forecast 2023-2028 ($ million)
      • Exhibit 89: Chart on Europe - Year-over-year growth 2023-2028 (%)
      • Exhibit 90: Data Table on Europe - Year-over-year growth 2023-2028 (%)
    • 9.6 Middle East and Africa - Market size and forecast 2023-2028
      • Exhibit 91: Chart on Middle East and Africa - Market size and forecast 2023-2028 ($ million)
      • Exhibit 92: Data Table on Middle East and Africa - Market size and forecast 2023-2028 ($ million)
      • Exhibit 93: Chart on Middle East and Africa - Year-over-year growth 2023-2028 (%)
      • Exhibit 94: Data Table on Middle East and Africa - Year-over-year growth 2023-2028 (%)
    • 9.7 South America - Market size and forecast 2023-2028
      • Exhibit 95: Chart on South America - Market size and forecast 2023-2028 ($ million)
      • Exhibit 96: Data Table on South America - Market size and forecast 2023-2028 ($ million)
      • Exhibit 97: Chart on South America - Year-over-year growth 2023-2028 (%)
      • Exhibit 98: Data Table on South America - Year-over-year growth 2023-2028 (%)
    • 9.8 China - Market size and forecast 2023-2028
      • Exhibit 99: Chart on China - Market size and forecast 2023-2028 ($ million)
      • Exhibit 100: Data Table on China - Market size and forecast 2023-2028 ($ million)
      • Exhibit 101: Chart on China - Year-over-year growth 2023-2028 (%)
      • Exhibit 102: Data Table on China - Year-over-year growth 2023-2028 (%)
    • 9.9 US - Market size and forecast 2023-2028
      • Exhibit 103: Chart on US - Market size and forecast 2023-2028 ($ million)
      • Exhibit 104: Data Table on US - Market size and forecast 2023-2028 ($ million)
      • Exhibit 105: Chart on US - Year-over-year growth 2023-2028 (%)
      • Exhibit 106: Data Table on US - Year-over-year growth 2023-2028 (%)
    • 9.10 Japan - Market size and forecast 2023-2028
      • Exhibit 107: Chart on Japan - Market size and forecast 2023-2028 ($ million)
      • Exhibit 108: Data Table on Japan - Market size and forecast 2023-2028 ($ million)
      • Exhibit 109: Chart on Japan - Year-over-year growth 2023-2028 (%)
      • Exhibit 110: Data Table on Japan - Year-over-year growth 2023-2028 (%)
    • 9.11 South Korea - Market size and forecast 2023-2028
      • Exhibit 111: Chart on South Korea - Market size and forecast 2023-2028 ($ million)
      • Exhibit 112: Data Table on South Korea - Market size and forecast 2023-2028 ($ million)
      • Exhibit 113: Chart on South Korea - Year-over-year growth 2023-2028 (%)
      • Exhibit 114: Data Table on South Korea - Year-over-year growth 2023-2028 (%)
    • 9.12 Germany - Market size and forecast 2023-2028
      • Exhibit 115: Chart on Germany - Market size and forecast 2023-2028 ($ million)
      • Exhibit 116: Data Table on Germany - Market size and forecast 2023-2028 ($ million)
      • Exhibit 117: Chart on Germany - Year-over-year growth 2023-2028 (%)
      • Exhibit 118: Data Table on Germany - Year-over-year growth 2023-2028 (%)
    • 9.13 Market opportunity by geography
      • Exhibit 119: Market opportunity by geography ($ million)
      • Exhibit 120: Data Tables on Market opportunity by geography ($ million)

    10 Drivers, Challenges, and Trends

    • 10.1 Market drivers
      • 10.2 Market challenges
        • 10.3 Impact of drivers and challenges
          • Exhibit 121: Impact of drivers and challenges in 2023 and 2028
        • 10.4 Market trends

          11 Vendor Landscape

          • 11.1 Overview
            • 11.2 Vendor landscape
              • Exhibit 122: Overview on Criticality of inputs and Factors of differentiation
            • 11.3 Landscape disruption
              • Exhibit 123: Overview on factors of disruption
            • 11.4 Industry risks
              • Exhibit 124: Impact of key risks on business

            12 Vendor Analysis

            • 12.1 Vendors covered
              • Exhibit 125: Vendors covered
            • 12.2 Market positioning of vendors
              • Exhibit 126: Matrix on vendor position and classification
            • 12.3 ABB Ltd.
              • Exhibit 127: ABB Ltd. - Overview
              • Exhibit 128: ABB Ltd. - Business segments
              • Exhibit 129: ABB Ltd. - Key offerings
              • Exhibit 130: ABB Ltd. - Segment focus
            • 12.4 American Electronic Components Inc.
              • Exhibit 131: American Electronic Components Inc. - Overview
              • Exhibit 132: American Electronic Components Inc. - Product / Service
              • Exhibit 133: American Electronic Components Inc. - Key offerings
            • 12.5 Fujitsu Ltd.
              • Exhibit 134: Fujitsu Ltd. - Overview
              • Exhibit 135: Fujitsu Ltd. - Business segments
              • Exhibit 136: Fujitsu Ltd. - Key news
              • Exhibit 137: Fujitsu Ltd. - Key offerings
              • Exhibit 138: Fujitsu Ltd. - Segment focus
            • 12.6 HONGFA
              • Exhibit 139: HONGFA - Overview
              • Exhibit 140: HONGFA - Product / Service
              • Exhibit 141: HONGFA - Key offerings
            • 12.7 OMRON Corp.
              • Exhibit 142: OMRON Corp. - Overview
              • Exhibit 143: OMRON Corp. - Business segments
              • Exhibit 144: OMRON Corp. - Key news
              • Exhibit 145: OMRON Corp. - Key offerings
              • Exhibit 146: OMRON Corp. - Segment focus
            • 12.8 Panasonic Holdings Corp.
              • Exhibit 147: Panasonic Holdings Corp. - Overview
              • Exhibit 148: Panasonic Holdings Corp. - Product / Service
              • Exhibit 149: Panasonic Holdings Corp. - Key news
              • Exhibit 150: Panasonic Holdings Corp. - Key offerings
            • 12.9 Phoenix Contact GmbH and Co. KG
              • Exhibit 151: Phoenix Contact GmbH and Co. KG - Overview
              • Exhibit 152: Phoenix Contact GmbH and Co. KG - Product / Service
              • Exhibit 153: Phoenix Contact GmbH and Co. KG - Key offerings
            • 12.10 RJS Electronics Ltd.
              • Exhibit 154: RJS Electronics Ltd. - Overview
              • Exhibit 155: RJS Electronics Ltd. - Product / Service
              • Exhibit 156: RJS Electronics Ltd. - Key offerings
            • 12.11 Schneider Electric SE
              • Exhibit 157: Schneider Electric SE - Overview
              • Exhibit 158: Schneider Electric SE - Business segments
              • Exhibit 159: Schneider Electric SE - Key news
              • Exhibit 160: Schneider Electric SE - Key offerings
              • Exhibit 161: Schneider Electric SE - Segment focus
            • 12.12 Siemens AG
              • Exhibit 162: Siemens AG - Overview
              • Exhibit 163: Siemens AG - Business segments
              • Exhibit 164: Siemens AG - Key news
              • Exhibit 165: Siemens AG - Key offerings
              • Exhibit 166: Siemens AG - Segment focus
            • 12.13 Song Chuan Precision Co. Ltd.
              • Exhibit 167: Song Chuan Precision Co. Ltd. - Overview
              • Exhibit 168: Song Chuan Precision Co. Ltd. - Product / Service
              • Exhibit 169: Song Chuan Precision Co. Ltd. - Key offerings
            • 12.14 TE Connectivity Ltd.
              • Exhibit 170: TE Connectivity Ltd. - Overview
              • Exhibit 171: TE Connectivity Ltd. - Business segments
              • Exhibit 172: TE Connectivity Ltd. - Key offerings
              • Exhibit 173: TE Connectivity Ltd. - Segment focus
            • 12.15 Teledyne Technologies Inc.
              • Exhibit 174: Teledyne Technologies Inc. - Overview
              • Exhibit 175: Teledyne Technologies Inc. - Business segments
              • Exhibit 176: Teledyne Technologies Inc. - Key news
              • Exhibit 177: Teledyne Technologies Inc. - Key offerings
              • Exhibit 178: Teledyne Technologies Inc. - Segment focus
            • 12.16 Yageo Corp.
              • Exhibit 179: Yageo Corp. - Overview
              • Exhibit 180: Yageo Corp. - Business segments
              • Exhibit 181: Yageo Corp. - Key offerings
              • Exhibit 182: Yageo Corp. - Segment focus
            • 12.17 Zettler Group
              • Exhibit 183: Zettler Group - Overview
              • Exhibit 184: Zettler Group - Product / Service
              • Exhibit 185: Zettler Group - Key offerings

            13 Appendix

            • 13.1 Scope of the report
              • 13.2 Inclusions and exclusions checklist
                • Exhibit 186: Inclusions checklist
                • Exhibit 187: Exclusions checklist
              • 13.3 Currency conversion rates for US$
                • Exhibit 188: Currency conversion rates for US$
              • 13.4 Research methodology
                • Exhibit 189: Research methodology
                • Exhibit 190: Validation techniques employed for market sizing
                • Exhibit 191: Information sources
              • 13.5 List of abbreviations
                • Exhibit 192: List of abbreviations

              Research Methodology

              Technavio presents a detailed picture of the market by way of study, synthesis, and summation of data from multiple sources. The analysts have presented the various facets of the market with a particular focus on identifying the key industry influencers. The data thus presented is comprehensive, reliable, and the result of extensive research, both primary and secondary.

              INFORMATION SOURCES

              Primary sources

              • Manufacturers and suppliers
              • Channel partners
              • Industry experts
              • Strategic decision makers

              Secondary sources

              • Industry journals and periodicals
              • Government data
              • Financial reports of key industry players
              • Historical data
              • Press releases

              DATA ANALYSIS

              Data Synthesis

              • Collation of data
              • Estimation of key figures
              • Analysis of derived insights

              Data Validation

              • Triangulation with data models
              • Reference against proprietary databases
              • Corroboration with industry experts

              REPORT WRITING

              Qualitative

              • Market drivers
              • Market challenges
              • Market trends
              • Five forces analysis

              Quantitative

              • Market size and forecast
              • Market segmentation
              • Geographical insights
              • Competitive landscape

              Interested in this report?

              Get your sample now to see our research methodology and insights!

              Download Now

              Frequently Asked Questions

              Communication Relay market growth will increase by $ 144.3 mn during 2024-2028 .

              The Communication Relay market is expected to grow at a CAGR of 5.28% during 2024-2028 .

              Communication Relay market is segmented by Application( Telecom switching systems, Mobile base stations, Broadband equipment, Broadcasting studios) End-user( Automotive industry, Broadcast industry, Aerospace industry, Others, South America)

              American Electronic Components Inc., Cisco Systems Inc., Fujitsu Ltd., GoTenna, HONGFA, Huawei Technologies Co. Ltd., IDEC Corp., OMRON Corp., Ororatech GmbH, Panasonic Holdings Corp., Phoenix Contact GmbH and Co. KG, Rao Electromechanical Relays Pvt. Ltd., RJS Electronics Ltd., Schneider Electric SE, Siemens AG, Song Chuan Precision Co. Ltd., TE Connectivity Ltd., Teledyne Technologies Inc., Yageo Corp., Zettler Group, Zhejiang CHINT Electrics Co. Ltd., ABB Ltd. are a few of the key vendors in the Communication Relay market.

              APAC will register the highest growth rate of 44% among the other regions. Therefore, the Communication Relay market in APAC is expected to garner significant business opportunities for the vendors during the forecast period.

              US, China, Japan, South Korea, Germany

              • Miniaturization of electronic componentsIn recent years is the driving factor this market.
              • the size of electronic packages has decreased to reduce power consumption and increase functionality and/or the number of embedded components. The convergence of IT is the driving factor this market.
              • audio is the driving factor this market.
              • and visual technologies has drastically changed the electronics industry. This convergence has resulted in a demand for miniaturized electronic components to cater to the changing technology and the growing demand for compact electronic products in both consumer electronics and electronic equipment. Traditionally is the driving factor this market.
              • in communication devices and equipment such as servers is the driving factor this market.
              • mobile base station equipment is the driving factor this market.
              • and modems is the driving factor this market.
              • multiple flat printed circuit boards (PCBs) with single integrated circuit (IC) chips were used is the driving factor this market.
              • but now mixed functional structures is the driving factor this market.
              • such as flexible subtracts is the driving factor this market.
              • are used with the inclusion of a growing number of sensors and processors. Electronic components is the driving factor this market.
              • such as diodes is the driving factor this market.
              • relays is the driving factor this market.
              • and rectifiers is the driving factor this market.
              • need to be arranged within a limited dimension is the driving factor this market.
              • which is not feasible on conventional PCBs. This constraint with PCBs is resulting in the development and proliferation of substrate-like PCB technology. Small components require not only a small PCB but also efficient electronic components such as diodes is the driving factor this market.
              • relays is the driving factor this market.
              • rectifiers is the driving factor this market.
              • thyristors is the driving factor this market.
              • and other discrete electronic components to reduce overall power use and protect electronic devices. Large PCBs and thicker interconnects can lead to signal propagation issues and power loss is the driving factor this market.
              • which can lead to shorter uptime for battery-powered communication devices. Communication relay equipment is the driving factor this market.
              • such as reed relays and compact signal relays is the driving factor this market.
              • overcome these problems by providing a fast-switching action and a low forward voltage drop. These relays have a large switching range from V and A to A and 250 V. Along with all these benefits is the driving factor this market.
              • their compact design makes them an effective option for use in communication and telecom equipment. Therefore is the driving factor this market.
              • the miniaturization of communication equipment has increased the demand for communication relay equipment among communication equipment manufacturers. Thus is the driving factor this market.
              • the abovementioned factors are expected to increase the demand for communication relay equipment is the driving factor this market.
              • which will propel the growth of the global communication relay market during the forecast period. is the driving factor this market.

              The Communication Relay market vendors should focus on grabbing business opportunities from the Telecom switching systems segment as it accounted for the largest market share in the base year.