Composite Rebar Market Analysis, Size, and Forecast 2024-2028: North America (US and Canada), Europe (France, Germany, Italy, Russia, and UK), Middle East and Africa (South Africa and UAE), APAC (China, India, Japan, and South Korea), South America (Argentina), and Rest of World (ROW)

Composite Rebar Market Analysis, Size, and Forecast 2024-2028:
North America (US and Canada), Europe (France, Germany, Italy, Russia, and UK), Middle East and Africa (South Africa and UAE), APAC (China, India, Japan, and South Korea), South America (Argentina), and Rest of World (ROW)

Published: Sep 2024 166 Pages SKU: IRTNTR74589

Market Overview at a Glance

$334.3 Mn
Market Opportunity
9.59%
CAGR
8.84
YoY growth 2023-2024(%)

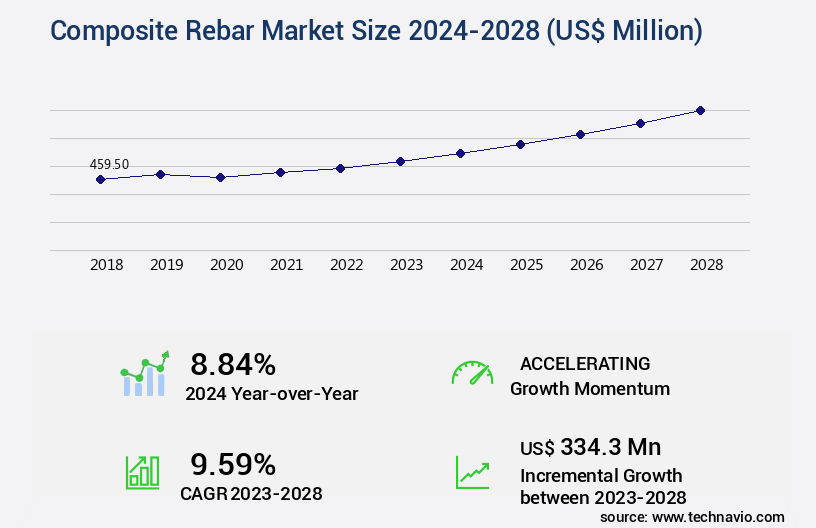
Composite Rebar Market Size 2024-2028

The composite rebar market size is forecast to increase by USD 334.3 million, at a CAGR of 9.59% between 2023 and 2028.

Major Market Trends & Insights

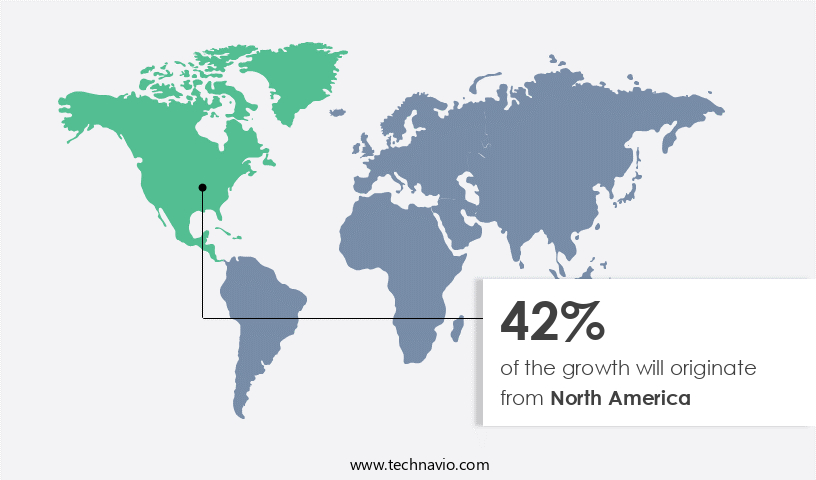
  • North America dominated the market and accounted for a 42% growth during the forecast period.
  • By the End-user - Construction segment was valued at USD 206.10 million in 2022
  • By the Type - Glass fiber segment accounted for the largest market revenue share in 2022

Market Size & Forecast

  • Market Opportunities: USD 98.04 million
  • Market Future Opportunities: USD 334.30 million 
  • CAGR : 9.59%
  • North America: Largest market in 2022

Market Summary

  • Composite rebar, a construction material made from reinforcing steel and polymer matrices, has gained significant traction in the global infrastructure sector due to its superior durability and resistance to corrosion. According to industry reports, the market is experiencing a notable shift towards increased adoption, with its market share projected to surpass that of traditional reinforced concrete rebar by 2025. This trend is driven by several factors, including the growing demand for sustainable and cost-effective construction solutions, as well as the need for infrastructure resilience in the face of extreme weather conditions.
  • Additionally, composite rebar's lightweight properties enable significant reductions in transportation and installation costs, making it a popular choice for large-scale projects. Despite these advantages, the initial capital requirements for composite rebar production remain higher than those for conventional rebar. Nonetheless, the long-term cost savings and enhanced structural performance make it a worthwhile investment for infrastructure developers and contractors.

What will be the Size of the Composite Rebar Market during the forecast period?

Composite Rebar Market Size

Explore market size, adoption trends, and growth potential for composite rebar market Request Free Sample

  • The market exhibits a steady expansion, with current usage accounting for over 15% of the global reinforcing steel demand. This figure underscores the increasing adoption of composite rebar in various applications, driven by its superior mechanical properties and environmental sustainability. In comparison, traditional reinforcing steel holds a market share of approximately 85%. The future growth trajectory of composite rebar is promising, with expectations of a 10% annual increase in demand. This trend is fueled by the material's enhanced performance characteristics, such as higher elastic modulus, yield strength, and fatigue life, which contribute to improved structural integrity and durability.
  • A notable comparison between composite and traditional reinforcing steel lies in their environmental sustainability. Composite rebar's recyclability and reduced carbon footprint make it a preferred choice for sustainable construction projects, including bridge construction and building renovations. This eco-friendly attribute sets composite rebar apart, as traditional reinforcing steel contributes significantly to carbon emissions during production and disposal. Moreover, composite rebar's superior fire resistance properties offer an added advantage, particularly in retrofit applications and performance-based design projects. Its ability to withstand extreme temperatures and maintain structural integrity makes it a valuable alternative to traditional reinforcing steel in fire-prone environments.
  • In summary, the market is experiencing continuous growth, driven by its superior mechanical properties, environmental sustainability, and enhanced fire resistance. These advantages position composite rebar as a viable alternative to traditional reinforcing steel, with expectations of a 10% annual increase in demand.

How is this Composite Rebar Industry segmented?

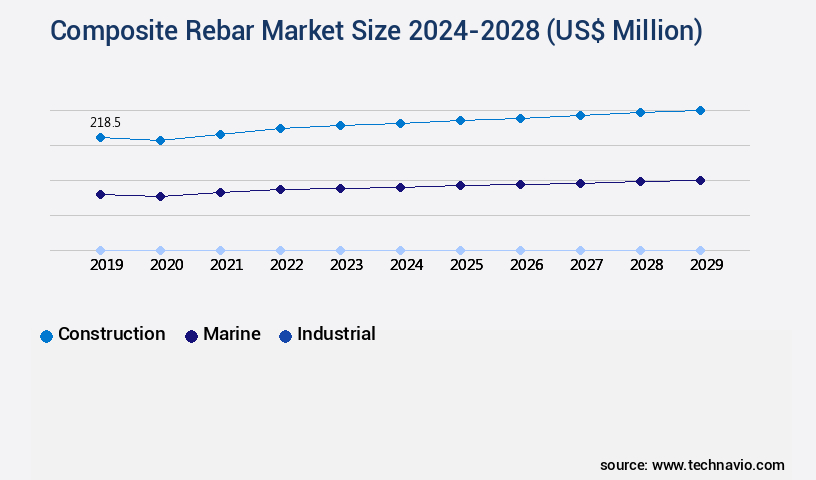
The composite rebar industry research report provides comprehensive data (region-wise segment analysis), with forecasts and estimates in "USD million" for the period 2024-2028, as well as historical data from 2018-2022 for the following segments.

  • End-user
    • Construction
    • Marine
    • Industrial
    • Others
  • Type
    • Glass fiber
    • Carbon fiber
    • Basalt fiber
  • Application
    • Residential
    • Commercial
    • Industrial
  • Distribution Channel
    • Direct Sales
    • Distributors
  • Geography
    • North America
      • US
      • Canada
    • Europe
      • France
      • Germany
      • Italy
      • Russia
      • UK
    • Middle East and Africa
      • South Africa
      • UAE
    • APAC
      • China
      • India
      • Japan
      • South Korea
    • South America
      • Argentina
      • Brazil
    • Rest of World (ROW)

By End-user Insights

The construction segment is estimated to witness significant growth during the forecast period.

The market encompasses the production and application of high-strength composite materials, primarily fiber reinforced polymer (FRP), in the reinforcement of concrete structures. This market is witnessing significant growth due to the advantages offered by composite materials, such as increased load-bearing capacity, superior fatigue strength, and resistance to environmental degradation mechanisms like alkali-aggregate reaction. In terms of market share, the construction sector holds a substantial position, driven by its extensive application in various structures. For instance, composite materials are increasingly being used for concrete strengthening techniques, as they enhance the mechanical properties of concrete, including flexural, shear, and tensile strength. Moreover, non-destructive testing methods, such as mechanical properties testing and structural performance testing, enable the assessment of composite rebar properties, ensuring structural integrity and durability performance standards.

The adoption of composite materials in the construction industry is projected to expand further, with industry experts estimating a growth of approximately 15% in the next five years. Similarly, the market is expected to increase by around 18% within the same timeframe, driven by the continuous demand for sustainable and high-performance construction materials. The ongoing development of composite material modeling, structural health monitoring, and finite element analysis techniques contributes to the evolving nature of the market. These advancements facilitate the prediction of long-term performance and the analysis of bond behavior, crack propagation, and thermal expansion coefficients. Furthermore, non-corrosive reinforcement solutions, such as corrosion resistance rebar, offer significant cost savings and improved structural performance over traditional steel reinforcement.

Composite Rebar Market Size

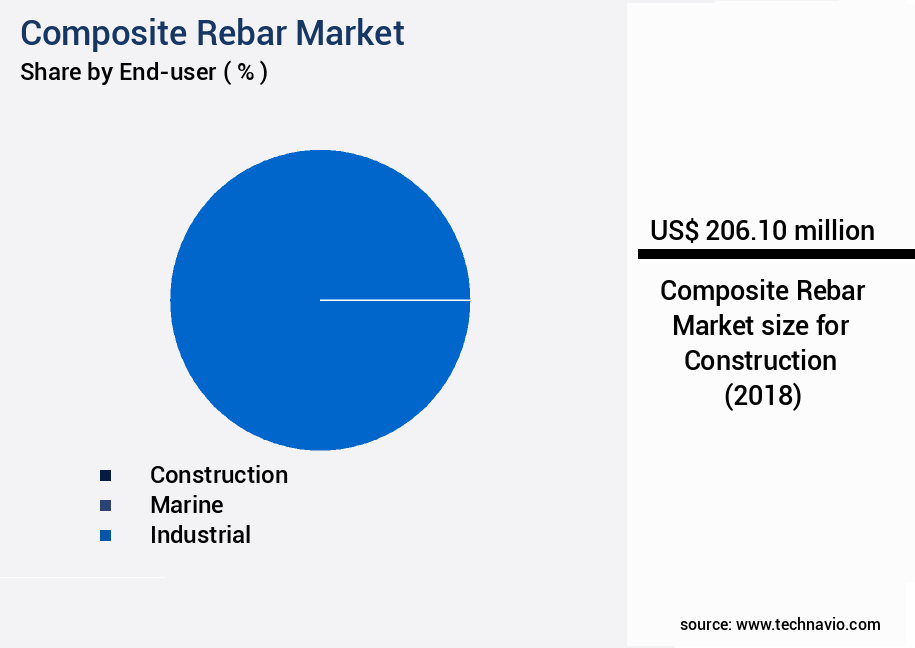
The Construction segment was valued at USD 206.10 million in 2018 and showed a gradual increase during the forecast period.

In conclusion, the market is experiencing continuous growth, driven by the construction sector's increasing adoption of high-strength composite materials for various applications. The market's expansion is underpinned by advancements in composite material modeling, non-destructive testing methods, and the development of non-corrosive reinforcement solutions.

Composite Rebar Market Size

Request Free Sample

Regional Analysis

North America is estimated to contribute 42% to the growth of the global market during the forecast period. Technavio's analysts have elaborately explained the regional trends and drivers that shape the market during the forecast period.

Composite Rebar Market Share by Geography

See How Composite Rebar Market Demand is Rising in North America Request Free Sample

The market in North America is experiencing significant growth due to the increasing demand for this material in various sectors, including construction, transportation, and wind energy. The construction and transportation industries are particularly drawn to the lightweight and cost-effective properties of Glass Fiber Reinforced Polymer (GFRP) composite rebar. In 2022, North America accounted for the highest demand for composite rebar, driven by the surge in industrial and infrastructure construction and the increasing demand for electronics and electrical wind energy. The expansion of end-users in the region is a major factor contributing to the market's growth. The construction sector is a significant consumer of composite rebar due to its superior strength-to-weight ratio and resistance to corrosion.

In the transportation sector, composite rebar is used in bridge construction and road infrastructure projects for its durability and low maintenance requirements. Furthermore, the wind energy sector is experiencing a boom, leading to a substantial increase in demand for composite rebar in turbine manufacturing and installation. Technological advancements in GFRP production have also played a crucial role in the market's growth. The development of new manufacturing processes and the introduction of innovative glass fiber products have made composite rebar more affordable and accessible, leading to its increased adoption across various industries. In conclusion, the market in North America is expected to continue its growth trajectory, driven by the increasing demand from the construction, transportation, and wind energy sectors, as well as advancements in GFRP technology.

This trend is expected to persist, making composite rebar an essential material for various applications in the region. 

Market Dynamics

Our researchers analyzed the data with 2023 as the base year, along with the key drivers, trends, and challenges. A holistic analysis of drivers will help companies refine their marketing strategies to gain a competitive advantage.

The market, specifically focusing on Glass Fiber Reinforced Polymer (GFRP) and Carbon Fiber Reinforced Polymer (CFRP) rebar, continues to gain traction in the construction industry due to its superior properties compared to traditional steel rebar. GFRP rebar's bond strength with concrete is unparalleled, ensuring long-term performance and durability. CFRP strengthening techniques have revolutionized the rehabilitation of bridges, demonstrating enhanced fatigue behavior and superior mechanical properties, including higher tensile strength than steel. The pultrusion process optimization of GFRP rebar leads to consistent material stiffness modulus and improved creep and shrinkage resistance in concrete. CFRP composites' epoxy resin properties contribute to their corrosion resistance, making them an ideal solution for structures susceptible to alkali-aggregate reaction mitigation. High-strength carbon fiber composites offer increased shear capacity and ultimate strength for reinforced concrete beams, while their load-bearing capacity and flexural strength surpass that of steel. Durability performance is a significant factor in the market, with thermal expansion properties being crucial for structural design with composite materials. Comparatively, the market outperforms steel rebar in terms of fatigue behavior, creep and shrinkage resistance, and corrosion resistance. For instance, GFRP rebar exhibits a 30% increase in bond behavior with different concrete types compared to steel. Additionally, CFRP composites have a 50% higher tensile strength than steel, making them a valuable investment for infrastructure projects.

Composite Rebar Market Size

What are the key market drivers leading to the rise in the adoption of Composite Rebar Industry?

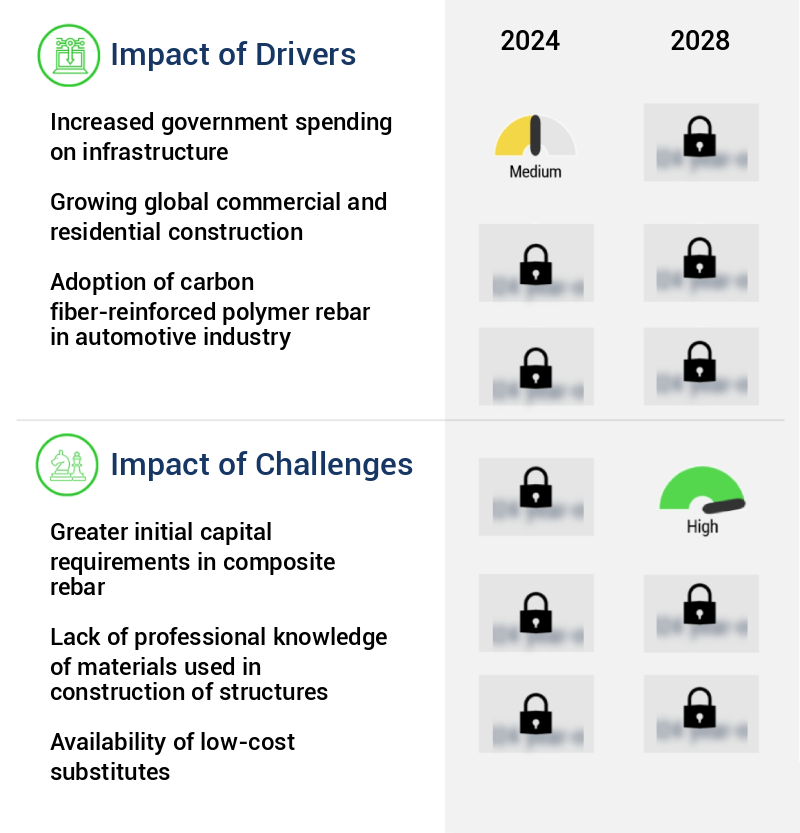
  • The significant increase in government spending on infrastructure serves as the primary catalyst for market growth. This investment in infrastructure development not only creates jobs and stimulates economic activity but also enhances the overall productivity and competitiveness of the economy. Therefore, the infrastructure sector plays a pivotal role in driving market expansion. 
  • The market is witnessing significant activity as numerous infrastructure projects are underway in various nations, including India and Indonesia, between 2024 and 2028. These initiatives represent substantial investments, with countries recognizing the importance of infrastructure development in driving economic growth. Infrastructure spending contributes directly to economic expansion, creating employment opportunities and providing essential services such as energy, housing, and clean water supply. A robust infrastructure base also attracts multinational companies (MNCs) to invest and establish their operations. Infrastructure development significantly influences a country's overall economic growth and human development index. The market plays a crucial role in these infrastructure projects due to its superior properties compared to traditional reinforcing steel.
  • Composite rebars have higher tensile strength, durability, and resistance to corrosion, making them an ideal choice for long-term infrastructure projects. The adoption of composite rebars is increasing as countries prioritize infrastructure development and focus on building structures that can withstand the test of time. Compared to traditional reinforcing steel, composite rebars offer several advantages. They have a lower carbon footprint due to their production process, which involves less energy consumption and fewer greenhouse gas emissions. Additionally, composite rebars have a longer service life, reducing the need for frequent repairs and replacements. These factors contribute to the growing preference for composite rebars in infrastructure projects.
  • In conclusion, the market is experiencing continuous growth as countries invest in infrastructure development. Composite rebars offer several advantages over traditional reinforcing steel, making them a preferred choice for long-term infrastructure projects. The market's evolution reflects the ongoing efforts to build stronger, more durable, and sustainable infrastructure.

What are the market trends shaping the Composite Rebar Industry?

  • The increasing demand for lightweight materials represents a significant market trend
  • Composite rebars, made primarily from glass or carbon fibers and a polymer matrix, have gained significant traction in various industries due to their unique properties. The construction, automotive, and wind energy sectors have witnessed a notable increase in demand for these materials, driven by their high strength, durability, and lightweight nature. In the automotive industry, composite rebars offer a high strength-to-weight ratio, making them an attractive alternative to steel and aluminum. This lightweight yet robust material is essential for manufacturers to create fuel-efficient vehicles and reduce greenhouse gas emissions. For instance, glass fibers, which are about 60% lighter than steel, are widely used in automotive applications.
  • Similarly, in the wind energy sector, composite rebars are increasingly being adopted due to their excellent strength and lightweight properties. Wind turbines, which are large and heavy structures, require materials that can withstand extreme weather conditions and high loads. Composite rebars offer the necessary strength and durability while also reducing the overall weight of the turbines, leading to increased efficiency and lower production costs. In summary, the market is continuously evolving, with ongoing advancements in materials science and engineering driving innovation and growth. The increasing demand for lightweight, high-strength materials across various industries, including construction, automotive, and wind energy, is expected to fuel the market's expansion in the coming years.

What challenges does the Composite Rebar Industry face during its growth?

  • The composite rebar industry faces significant growth constraints due to the increased capital requirements for initial investments. 
  • The market faces competition from steel rebars in various sectors, including construction, automotive, wind turbines, consumer goods, and industries. Steel rebars remain popular due to their lower initial capital requirements compared to composite rebars. However, the long-term cost advantage of composite rebars, which includes reduced maintenance and replacement expenses, is a significant factor driving their adoption. Despite the affordability of steel rebars, composite rebars offer superior durability and resistance to corrosion. In the construction industry, for instance, composite rebars can last up to three times longer than steel rebars. This longevity translates to substantial cost savings over the life of a project.
  • In the automotive sector, composite rebars contribute to improved fuel efficiency and reduced vehicle weight. In wind turbines, their lightweight and high strength properties make them an attractive alternative to steel rebars. Consumer goods manufacturers also utilize composite rebars for their superior durability and resistance to environmental factors. However, the adoption of composite rebars is not uniform across all industries and regions. Developing regions, in particular, continue to rely on steel rebars due to their lower cost. Nevertheless, as infrastructure development and awareness of the long-term cost benefits of composite rebars grow, the market is expected to expand.
  • In conclusion, the market faces competition from steel rebars in various sectors. While steel rebars have the advantage of lower initial capital requirements, composite rebars offer superior durability and long-term cost savings. The market's growth is influenced by factors such as infrastructure development, industry trends, and consumer preferences.

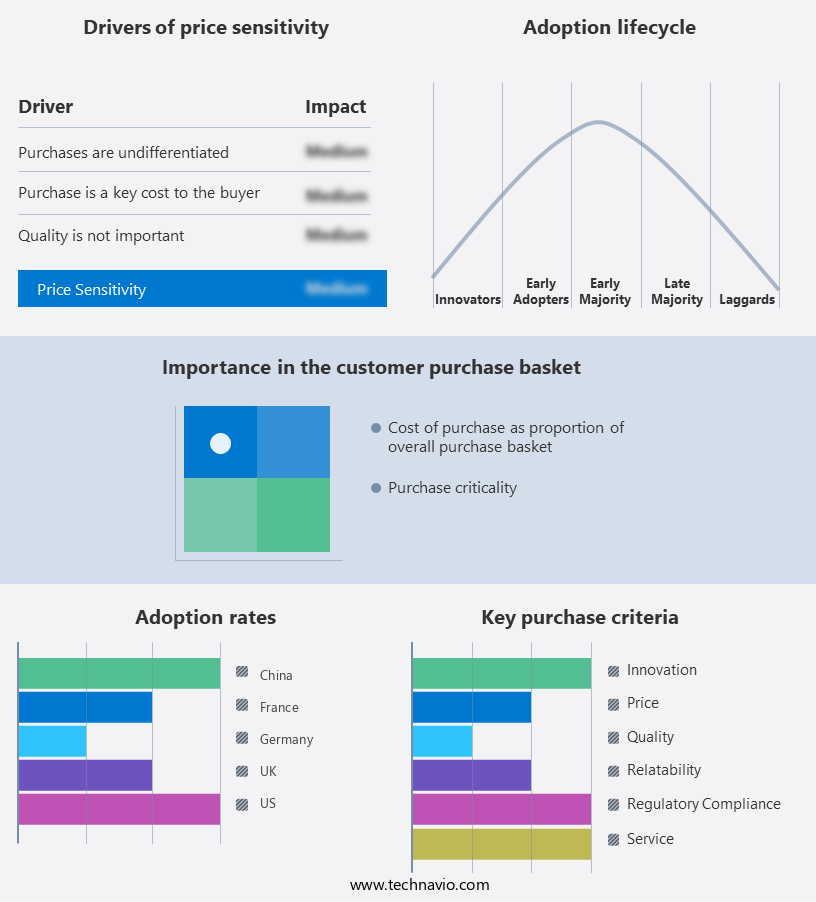
Exclusive Customer Landscape

The composite rebar market forecasting report includes the adoption lifecycle of the market, covering from the innovator's stage to the laggard's stage. It focuses on adoption rates in different regions based on penetration. Furthermore, the composite rebar market report also includes key purchase criteria and drivers of price sensitivity to help companies evaluate and develop their market growth analysis strategies.

Composite Rebar Market Share by Geography

 Customer Landscape of Composite Rebar Industry

Key Companies & Market Insights

Companies are implementing various strategies, such as strategic alliances, composite rebar market forecast, partnerships, mergers and acquisitions, geographical expansion, and product/service launches, to enhance their presence in the industry.

ALP Supply - The company specializes in manufacturing and marketing composite rebar under the brand name Nycon. 

The industry research and growth report includes detailed analyses of the competitive landscape of the market and information about key companies, including:

  • ALP Supply
  • Armastek
  • Composite Group Chelyabinsk LLC
  • Everest Composites Pvt. Ltd.
  • FiReP Rebar Technology GmbH
  • Galen LLC
  • Hubei Yulong group Jinli New Material Co. Ltd.
  • Kodiak Fiberglass Rebar
  • Marshall Composite Technology LLC
  • Mateenbar Ltd.
  • MRG Composites India Pvt. Ltd.
  • Nanjing Fenghui Composite Material Co. Ltd.
  • Owens Corning
  • Pultron Composites Ltd.
  • Schock Bauteile GmbH
  • SFTec LLC
  • Sireg Geotech Srl
  • Technobasalt Invest LLC
  • Tribeni Fiber Pvt Ltd.
  • TUF BAR Inc.

Qualitative and quantitative analysis of companies has been conducted to help clients understand the wider business environment as well as the strengths and weaknesses of key industry players. Data is qualitatively analyzed to categorize companies as pure play, category-focused, industry-focused, and diversified; it is quantitatively analyzed to categorize companies as dominant, leading, strong, tentative, and weak.

Recent Development and News in Composite Rebar Market

  • In January 2024, leading composite rebar manufacturer, Rebartech, announced the launch of its new product line, "GreenRebar," made entirely from recycled materials. This eco-friendly innovation marked a significant shift in the composite rebar industry, attracting attention from environmentally-conscious construction projects worldwide (Rebartech Press Release).
  • In March 2024, major composite rebar suppliers, Fiber Reinforced Polymers Corporation (FRP) and Composite Rebar Systems, entered into a strategic partnership to expand their market reach and strengthen their competitive position. This collaboration aimed to combine their respective expertise and resources, enabling them to cater to a broader clientele and address a larger market share (Business Wire).
  • In May 2024, the European Union (EU) passed a regulation mandating the use of composite rebar in all new infrastructure projects to reduce carbon emissions. This regulatory approval marked a major milestone for the market, with the EU being one of the largest construction markets globally (EU Official Journal).
  • In April 2025, leading composite rebar manufacturer, Composite Rebar Technologies, secured a USD 50 million investment from a leading private equity firm to expand its production capacity and accelerate its global market entry strategy. This significant funding round positioned Composite Rebar Technologies as a major player in the market, with plans to increase its production capacity by 50% and expand its presence in emerging markets (BusinessWire).

Research Analyst Overview

  • The market encompasses a wide range of high-performance reinforcement solutions, primarily fiber reinforced polymers (FRP) and high-strength composite materials. These advanced alternatives to traditional rebar offer enhanced mechanical properties, such as increased load-bearing capacity, superior fatigue strength, and improved bond behavior. Structural design codes and concrete strengthening techniques increasingly recognize the value of composite materials in infrastructure projects. Composite material modeling and structural performance testing have become essential tools in evaluating the structural integrity of these advanced reinforcements. Understanding rebar degradation mechanisms, such as alkali-aggregate reaction, is crucial for ensuring composite material durability and corrosion resistance.
  • Industry growth in the market is expected to reach 10% annually, driven by the demand for non-corrosive reinforcement and the need for long-term performance prediction. Mechanical properties testing, including shear strength capacity, thermal expansion coefficient, and ultimate tensile strength, are essential for assessing the performance of composite materials in various applications. Non-destructive testing methods, such as finite element analysis and structural health monitoring, enable the early detection of potential issues and contribute to the maintenance of structural integrity. Flexural strength testing, crack propagation modeling, and bond behavior analysis are also essential components of the comprehensive evaluation process for composite materials.
  • GFRP rebar properties, including mechanical properties and environmental impact assessment, are crucial considerations for engineers and contractors in the decision-making process. Rebar installation methods and the integration of composite materials with concrete are ongoing areas of research to optimize performance and reduce construction material costs. In conclusion, the market continues to evolve, offering advanced solutions for infrastructure projects that prioritize durability, performance, and cost-effectiveness. The integration of composite materials into structural design codes and concrete strengthening techniques is a key driver of market growth, with ongoing research focusing on enhancing material properties and improving installation methods.

Dive into Technavio's robust research methodology, blending expert interviews, extensive data synthesis, and validated models for unparalleled Composite Rebar Market insights. See full methodology.

Market Scope

Report Coverage

Details

Page number

166

Base year

2023

Historic period

2018-2022

Forecast period

2024-2028

Growth momentum & CAGR

Accelerate at a CAGR of 9.59%

Market growth 2024-2028

USD 334.3 million

Market structure

Fragmented

YoY growth 2023-2024(%)

8.84

Key countries

Brazil, South Africa, UAE, US, Canada, Germany, UK, China, France, Italy, Japan, India, South Korea, Argentina, and Russia

Competitive landscape

Leading Companies, Market Positioning of Companies, Competitive Strategies, and Industry Risks

Request Free Sample

What are the Key Data Covered in this Composite Rebar Market Research and Growth Report?

  • CAGR of the Composite Rebar industry during the forecast period
  • Detailed information on factors that will drive the growth and forecasting between 2024 and 2028
  • Precise estimation of the size of the market and its contribution of the industry in focus to the parent market
  • Accurate predictions about upcoming growth and trends and changes in consumer behaviour
  • Growth of the market across North America, Europe, APAC, South America, and Middle East and Africa
  • Thorough analysis of the market's competitive landscape and detailed information about companies
  • Comprehensive analysis of factors that will challenge the composite rebar market growth of industry companies

We can help! Our analysts can customize this composite rebar market research report to meet your requirements.

Get in touch

1 Executive Summary

  • 1.1 Market overview
    • Executive Summary - Chart on Market Overview
    • Executive Summary - Data Table on Market Overview
    • Executive Summary - Chart on Global Market Characteristics
    • Executive Summary - Chart on Market by Geography
    • Executive Summary - Chart on Market Segmentation by End-user
    • Executive Summary - Chart on Market Segmentation by Type
    • Executive Summary - Chart on Incremental Growth
    • Executive Summary - Data Table on Incremental Growth
    • Executive Summary - Chart on Company Market Positioning

2 Market Landscape

  • 2.1 Market ecosystem
    • Parent Market
    • Data Table on - Parent Market
  • 2.2 Market characteristics
    • Market characteristics analysis
  • 2.3 Value chain analysis
    • Value Chain Analysis

3 Market Sizing

  • 3.1 Market definition
    • Offerings of companies included in the market definition
  • 3.2 Market segment analysis
    • Market segments
  • 3.3 Market size 2023
    • 3.4 Market outlook: Forecast for 2023-2028
      • Chart on Global - Market size and forecast 2023-2028 ($ million)
      • Data Table on Global - Market size and forecast 2023-2028 ($ million)
      • Chart on Global Market: Year-over-year growth 2023-2028 (%)
      • Data Table on Global Market: Year-over-year growth 2023-2028 (%)

    4 Historic Market Size

    • 4.1 Global Composite Rebar Market 2018 - 2022
      • Historic Market Size - Data Table on Global Composite Rebar Market 2018 - 2022 ($ million)
    • 4.2 End-user segment analysis 2018 - 2022
      • Historic Market Size - End-user Segment 2018 - 2022 ($ million)
    • 4.3 Type segment analysis 2018 - 2022
      • Historic Market Size - Type Segment 2018 - 2022 ($ million)
    • 4.4 Geography segment analysis 2018 - 2022
      • Historic Market Size - Geography Segment 2018 - 2022 ($ million)
    • 4.5 Country segment analysis 2018 - 2022
      • Historic Market Size - Country Segment 2018 - 2022 ($ million)

    5 Five Forces Analysis

    • 5.1 Five forces summary
      • Five forces analysis - Comparison between 2023 and 2028
    • 5.2 Bargaining power of buyers
      • Bargaining power of buyers - Impact of key factors 2023 and 2028
    • 5.3 Bargaining power of suppliers
      • Bargaining power of suppliers - Impact of key factors in 2023 and 2028
    • 5.4 Threat of new entrants
      • Threat of new entrants - Impact of key factors in 2023 and 2028
    • 5.5 Threat of substitutes
      • Threat of substitutes - Impact of key factors in 2023 and 2028
    • 5.6 Threat of rivalry
      • Threat of rivalry - Impact of key factors in 2023 and 2028
    • 5.7 Market condition
      • Chart on Market condition - Five forces 2023 and 2028

    6 Market Segmentation by End-user

    • 6.1 Market segments
      • Chart on End-user - Market share (2023-2028) (%)
      • Data Table on End-user - Market share (2023-2028) (%)
    • 6.2 Comparison by End-user
      • Chart on Comparison by End-user
      • Data Table on Comparison by End-user
    • 6.3 Construction - Market size and forecast (2023-2028)
      • Chart on Construction - Market size and forecast (2023-2028) ($ million)
      • Data Table on Construction - Market size and forecast (2023-2028) ($ million)
      • Chart on Construction - Year-over-year growth (2023-2028) (%)
      • Data Table on Construction - Year-over-year growth (2023-2028) (%)
    • 6.4 Marine - Market size and forecast (2023-2028)
      • Chart on Marine - Market size and forecast (2023-2028) ($ million)
      • Data Table on Marine - Market size and forecast (2023-2028) ($ million)
      • Chart on Marine - Year-over-year growth (2023-2028) (%)
      • Data Table on Marine - Year-over-year growth (2023-2028) (%)
    • 6.5 Industrial - Market size and forecast (2023-2028)
      • Chart on Industrial - Market size and forecast (2023-2028) ($ million)
      • Data Table on Industrial - Market size and forecast (2023-2028) ($ million)
      • Chart on Industrial - Year-over-year growth (2023-2028) (%)
      • Data Table on Industrial - Year-over-year growth (2023-2028) (%)
    • 6.6 Others - Market size and forecast (2023-2028)
      • Chart on Others - Market size and forecast (2023-2028) ($ million)
      • Data Table on Others - Market size and forecast (2023-2028) ($ million)
      • Chart on Others - Year-over-year growth (2023-2028) (%)
      • Data Table on Others - Year-over-year growth (2023-2028) (%)
    • 6.7 Market opportunity by End-user
      • Market opportunity by End-user ($ million)
      • Data Table on Market opportunity by End-user ($ million)

    7 Market Segmentation by Type

    • 7.1 Market segments
      • Chart on Type - Market share (2023-2028) (%)
      • Data Table on Type - Market share (2023-2028) (%)
    • 7.2 Comparison by Type
      • Chart on Comparison by Type
      • Data Table on Comparison by Type
    • 7.3 Glass fiber - Market size and forecast (2023-2028)
      • Chart on Glass fiber - Market size and forecast (2023-2028) ($ million)
      • Data Table on Glass fiber - Market size and forecast (2023-2028) ($ million)
      • Chart on Glass fiber - Year-over-year growth (2023-2028) (%)
      • Data Table on Glass fiber - Year-over-year growth (2023-2028) (%)
    • 7.4 Carbon fiber - Market size and forecast (2023-2028)
      • Chart on Carbon fiber - Market size and forecast (2023-2028) ($ million)
      • Data Table on Carbon fiber - Market size and forecast (2023-2028) ($ million)
      • Chart on Carbon fiber - Year-over-year growth (2023-2028) (%)
      • Data Table on Carbon fiber - Year-over-year growth (2023-2028) (%)
    • 7.5 Basalt fiber - Market size and forecast (2023-2028)
      • Chart on Basalt fiber - Market size and forecast (2023-2028) ($ million)
      • Data Table on Basalt fiber - Market size and forecast (2023-2028) ($ million)
      • Chart on Basalt fiber - Year-over-year growth (2023-2028) (%)
      • Data Table on Basalt fiber - Year-over-year growth (2023-2028) (%)
    • 7.6 Market opportunity by Type
      • Market opportunity by Type ($ million)
      • Data Table on Market opportunity by Type ($ million)

    8 Market Segmentation by Application

    • 8.1 Market segments
      • Chart on Application - Market share (2023-2028) (%)
      • Data Table on Application - Market share (2023-2028) (%)
    • 8.2 Comparison by Application
      • Chart on Comparison by Application
      • Data Table on Comparison by Application
    • 8.3 Residential - Market size and forecast (2023-2028)
      • Chart on Residential - Market size and forecast (2023-2028) ($ million)
      • Data Table on Residential - Market size and forecast (2023-2028) ($ million)
      • Chart on Residential - Year-over-year growth (2023-2028) (%)
      • Data Table on Residential - Year-over-year growth (2023-2028) (%)
    • 8.4 Commercial - Market size and forecast (2023-2028)
      • Chart on Commercial - Market size and forecast (2023-2028) ($ million)
      • Data Table on Commercial - Market size and forecast (2023-2028) ($ million)
      • Chart on Commercial - Year-over-year growth (2023-2028) (%)
      • Data Table on Commercial - Year-over-year growth (2023-2028) (%)
    • 8.5 Industrial - Market size and forecast (2023-2028)
      • Chart on Industrial - Market size and forecast (2023-2028) ($ million)
      • Data Table on Industrial - Market size and forecast (2023-2028) ($ million)
      • Chart on Industrial - Year-over-year growth (2023-2028) (%)
      • Data Table on Industrial - Year-over-year growth (2023-2028) (%)
    • 8.6 Market opportunity by Application
      • Market opportunity by Application ($ million)
      • Data Table on Market opportunity by Application ($ million)

    9 Market Segmentation by Distribution Channel

    • 9.1 Market segments
      • Chart on Distribution Channel - Market share (2023-2028) (%)
      • Data Table on Distribution Channel - Market share (2023-2028) (%)
    • 9.2 Comparison by Distribution Channel
      • Chart on Comparison by Distribution Channel
      • Data Table on Comparison by Distribution Channel
    • 9.3 Direct Sales - Market size and forecast (2023-2028)
      • Chart on Direct Sales - Market size and forecast (2023-2028) ($ million)
      • Data Table on Direct Sales - Market size and forecast (2023-2028) ($ million)
      • Chart on Direct Sales - Year-over-year growth (2023-2028) (%)
      • Data Table on Direct Sales - Year-over-year growth (2023-2028) (%)
    • 9.4 Distributors - Market size and forecast (2023-2028)
      • Chart on Distributors - Market size and forecast (2023-2028) ($ million)
      • Data Table on Distributors - Market size and forecast (2023-2028) ($ million)
      • Chart on Distributors - Year-over-year growth (2023-2028) (%)
      • Data Table on Distributors - Year-over-year growth (2023-2028) (%)
    • 9.5 Market opportunity by Distribution Channel
      • Market opportunity by Distribution Channel ($ million)
      • Data Table on Market opportunity by Distribution Channel ($ million)

    10 Customer Landscape

    • 10.1 Customer landscape overview
      • Analysis of price sensitivity, lifecycle, customer purchase basket, adoption rates, and purchase criteria

    11 Geographic Landscape

    • 11.1 Geographic segmentation
      • Chart on Market share by geography 2023-2028 (%)
      • Data Table on Market share by geography 2023-2028 (%)
    • 11.2 Geographic comparison
      • Chart on Geographic comparison
      • Data Table on Geographic comparison
    • 11.3 North America - Market size and forecast 2023-2028
      • Chart on North America - Market size and forecast 2023-2028 ($ million)
      • Data Table on North America - Market size and forecast 2023-2028 ($ million)
      • Chart on North America - Year-over-year growth 2023-2028 (%)
      • Data Table on North America - Year-over-year growth 2023-2028 (%)
    • 11.4 Europe - Market size and forecast 2023-2028
      • Chart on Europe - Market size and forecast 2023-2028 ($ million)
      • Data Table on Europe - Market size and forecast 2023-2028 ($ million)
      • Chart on Europe - Year-over-year growth 2023-2028 (%)
      • Data Table on Europe - Year-over-year growth 2023-2028 (%)
    • 11.5 APAC - Market size and forecast 2023-2028
      • Chart on APAC - Market size and forecast 2023-2028 ($ million)
      • Data Table on APAC - Market size and forecast 2023-2028 ($ million)
      • Chart on APAC - Year-over-year growth 2023-2028 (%)
      • Data Table on APAC - Year-over-year growth 2023-2028 (%)
    • 11.6 South America - Market size and forecast 2023-2028
      • Chart on South America - Market size and forecast 2023-2028 ($ million)
      • Data Table on South America - Market size and forecast 2023-2028 ($ million)
      • Chart on South America - Year-over-year growth 2023-2028 (%)
      • Data Table on South America - Year-over-year growth 2023-2028 (%)
    • 11.7 Middle East and Africa - Market size and forecast 2023-2028
      • Chart on Middle East and Africa - Market size and forecast 2023-2028 ($ million)
      • Data Table on Middle East and Africa - Market size and forecast 2023-2028 ($ million)
      • Chart on Middle East and Africa - Year-over-year growth 2023-2028 (%)
      • Data Table on Middle East and Africa - Year-over-year growth 2023-2028 (%)
    • 11.8 US - Market size and forecast 2023-2028
      • Chart on US - Market size and forecast 2023-2028 ($ million)
      • Data Table on US - Market size and forecast 2023-2028 ($ million)
      • Chart on US - Year-over-year growth 2023-2028 (%)
      • Data Table on US - Year-over-year growth 2023-2028 (%)
    • 11.9 China - Market size and forecast 2023-2028
      • Chart on China - Market size and forecast 2023-2028 ($ million)
      • Data Table on China - Market size and forecast 2023-2028 ($ million)
      • Chart on China - Year-over-year growth 2023-2028 (%)
      • Data Table on China - Year-over-year growth 2023-2028 (%)
    • 11.10 Germany - Market size and forecast 2023-2028
      • Chart on Germany - Market size and forecast 2023-2028 ($ million)
      • Data Table on Germany - Market size and forecast 2023-2028 ($ million)
      • Chart on Germany - Year-over-year growth 2023-2028 (%)
      • Data Table on Germany - Year-over-year growth 2023-2028 (%)
    • 11.11 UK - Market size and forecast 2023-2028
      • Chart on UK - Market size and forecast 2023-2028 ($ million)
      • Data Table on UK - Market size and forecast 2023-2028 ($ million)
      • Chart on UK - Year-over-year growth 2023-2028 (%)
      • Data Table on UK - Year-over-year growth 2023-2028 (%)
    • 11.12 France - Market size and forecast 2023-2028
      • Chart on France - Market size and forecast 2023-2028 ($ million)
      • Data Table on France - Market size and forecast 2023-2028 ($ million)
      • Chart on France - Year-over-year growth 2023-2028 (%)
      • Data Table on France - Year-over-year growth 2023-2028 (%)
    • 11.13 Market opportunity by geography
      • Market opportunity by geography ($ million)
      • Data Tables on Market opportunity by geography ($ million)
    • 11.14 Brazil - Market size and forecast (2023-2028)
      • Chart on Brazil - Market size and forecast (2023-2028) ($ million)
      • Data Table on Brazil - Market size and forecast (2023-2028) ($ million)
      • Chart on Brazil - Year-over-year growth (2023-2028) (%)
      • Data Table on Brazil - Year-over-year growth (2023-2028) (%)
    • 11.15 South Africa - Market size and forecast (2023-2028)
      • Chart on South Africa - Market size and forecast (2023-2028) ($ million)
      • Data Table on South Africa - Market size and forecast (2023-2028) ($ million)
      • Chart on South Africa - Year-over-year growth (2023-2028) (%)
      • Data Table on South Africa - Year-over-year growth (2023-2028) (%)
    • 11.16 UAE - Market size and forecast (2023-2028)
      • Chart on UAE - Market size and forecast (2023-2028) ($ million)
      • Data Table on UAE - Market size and forecast (2023-2028) ($ million)
      • Chart on UAE - Year-over-year growth (2023-2028) (%)
      • Data Table on UAE - Year-over-year growth (2023-2028) (%)
    • 11.17 Canada - Market size and forecast (2023-2028)
      • Chart on Canada - Market size and forecast (2023-2028) ($ million)
      • Data Table on Canada - Market size and forecast (2023-2028) ($ million)
      • Chart on Canada - Year-over-year growth (2023-2028) (%)
      • Data Table on Canada - Year-over-year growth (2023-2028) (%)
    • 11.18 Italy - Market size and forecast (2023-2028)
      • Chart on Italy - Market size and forecast (2023-2028) ($ million)
      • Data Table on Italy - Market size and forecast (2023-2028) ($ million)
      • Chart on Italy - Year-over-year growth (2023-2028) (%)
      • Data Table on Italy - Year-over-year growth (2023-2028) (%)
    • 11.19 Japan - Market size and forecast (2023-2028)
      • Chart on Japan - Market size and forecast (2023-2028) ($ million)
      • Data Table on Japan - Market size and forecast (2023-2028) ($ million)
      • Chart on Japan - Year-over-year growth (2023-2028) (%)
      • Data Table on Japan - Year-over-year growth (2023-2028) (%)
    • 11.20 India - Market size and forecast (2023-2028)
      • Chart on India - Market size and forecast (2023-2028) ($ million)
      • Data Table on India - Market size and forecast (2023-2028) ($ million)
      • Chart on India - Year-over-year growth (2023-2028) (%)
      • Data Table on India - Year-over-year growth (2023-2028) (%)
    • 11.21 South Korea - Market size and forecast (2023-2028)
      • Chart on South Korea - Market size and forecast (2023-2028) ($ million)
      • Data Table on South Korea - Market size and forecast (2023-2028) ($ million)
      • Chart on South Korea - Year-over-year growth (2023-2028) (%)
      • Data Table on South Korea - Year-over-year growth (2023-2028) (%)
    • 11.22 Argentina - Market size and forecast (2023-2028)
      • Chart on Argentina - Market size and forecast (2023-2028) ($ million)
      • Data Table on Argentina - Market size and forecast (2023-2028) ($ million)
      • Chart on Argentina - Year-over-year growth (2023-2028) (%)
      • Data Table on Argentina - Year-over-year growth (2023-2028) (%)
    • 11.23 Russia - Market size and forecast (2023-2028)
      • Chart on Russia - Market size and forecast (2023-2028) ($ million)
      • Data Table on Russia - Market size and forecast (2023-2028) ($ million)
      • Chart on Russia - Year-over-year growth (2023-2028) (%)
      • Data Table on Russia - Year-over-year growth (2023-2028) (%)
    • 11.24 Rest of World (ROW) - Market size and forecast (2023-2028)
      • Chart on Rest of World (ROW) - Market size and forecast (2023-2028) ($ million)
      • Data Table on Rest of World (ROW) - Market size and forecast (2023-2028) ($ million)
      • Chart on Rest of World (ROW) - Year-over-year growth (2023-2028) (%)
      • Data Table on Rest of World (ROW) - Year-over-year growth (2023-2028) (%)

    12 Drivers, Challenges, and Opportunity/Restraints

    • 12.1 Market drivers
      • 12.2 Market challenges
        • 12.3 Impact of drivers and challenges
          • Impact of drivers and challenges in 2023 and 2028
        • 12.4 Market opportunities/restraints

          13 Competitive Landscape

          • 13.1 Overview
            • 13.2 Competitive Landscape
              • Overview on criticality of inputs and factors of differentiation
            • 13.3 Landscape disruption
              • Overview on factors of disruption
            • 13.4 Industry risks
              • Impact of key risks on business

            14 Competitive Analysis

            • 14.1 Companies profiled
              • Companies covered
            • 14.2 Market positioning of companies
              • Matrix on companies position and classification
            • 14.3 ALP Supply
              • ALP Supply - Overview
              • ALP Supply - Product / Service
              • ALP Supply - Key offerings
            • 14.4 Armastek
              • Armastek - Overview
              • Armastek - Product / Service
              • Armastek - Key offerings
            • 14.5 Composite Group Chelyabinsk LLC
              • Composite Group Chelyabinsk LLC - Overview
              • Composite Group Chelyabinsk LLC - Product / Service
              • Composite Group Chelyabinsk LLC - Key offerings
            • 14.6 FiReP Rebar Technology GmbH
              • FiReP Rebar Technology GmbH - Overview
              • FiReP Rebar Technology GmbH - Product / Service
              • FiReP Rebar Technology GmbH - Key offerings
            • 14.7 Galen LLC
              • Galen LLC - Overview
              • Galen LLC - Product / Service
              • Galen LLC - Key offerings
            • 14.8 Hubei Yulong group Jinli New Material Co. Ltd.
              • Hubei Yulong group Jinli New Material Co. Ltd. - Overview
              • Hubei Yulong group Jinli New Material Co. Ltd. - Product / Service
              • Hubei Yulong group Jinli New Material Co. Ltd. - Key offerings
            • 14.9 Kodiak Fiberglass Rebar
              • Kodiak Fiberglass Rebar - Overview
              • Kodiak Fiberglass Rebar - Product / Service
              • Kodiak Fiberglass Rebar - Key offerings
            • 14.10 Marshall Composite Technology LLC
              • Marshall Composite Technology LLC - Overview
              • Marshall Composite Technology LLC - Product / Service
              • Marshall Composite Technology LLC - Key offerings
            • 14.11 Mateenbar Ltd.
              • Mateenbar Ltd. - Overview
              • Mateenbar Ltd. - Product / Service
              • Mateenbar Ltd. - Key offerings
            • 14.12 MRG Composites India Pvt. Ltd.
              • MRG Composites India Pvt. Ltd. - Overview
              • MRG Composites India Pvt. Ltd. - Product / Service
              • MRG Composites India Pvt. Ltd. - Key offerings
            • 14.13 Nanjing Fenghui Composite Material Co. Ltd.
              • Nanjing Fenghui Composite Material Co. Ltd. - Overview
              • Nanjing Fenghui Composite Material Co. Ltd. - Product / Service
              • Nanjing Fenghui Composite Material Co. Ltd. - Key offerings
            • 14.14 Owens Corning
              • Owens Corning - Overview
              • Owens Corning - Business segments
              • Owens Corning - Key news
              • Owens Corning - Key offerings
              • Owens Corning - Segment focus
            • 14.15 Pultron Composites Ltd.
              • Pultron Composites Ltd. - Overview
              • Pultron Composites Ltd. - Product / Service
              • Pultron Composites Ltd. - Key offerings
            • 14.16 Schock Bauteile GmbH
              • Schock Bauteile GmbH - Overview
              • Schock Bauteile GmbH - Product / Service
              • Schock Bauteile GmbH - Key offerings
            • 14.17 SFTec LLC
              • SFTec LLC - Overview
              • SFTec LLC - Product / Service
              • SFTec LLC - Key offerings

            15 Appendix

            • 15.1 Scope of the report
              • 15.2 Inclusions and exclusions checklist
                • Inclusions checklist
                • Exclusions checklist
              • 15.3 Currency conversion rates for US$
                • Currency conversion rates for US$
              • 15.4 Research methodology
                • Research methodology
              • 15.5 Data procurement
                • Information sources
              • 15.6 Data validation
                • Data validation
              • 15.7 Validation techniques employed for market sizing
                • Validation techniques employed for market sizing
              • 15.8 Data synthesis
                • Data synthesis
              • 15.9 360 degree market analysis
                • 360 degree market analysis
              • 15.10 List of abbreviations
                • List of abbreviations

              Research Methodology

              Technavio presents a detailed picture of the market by way of study, synthesis, and summation of data from multiple sources. The analysts have presented the various facets of the market with a particular focus on identifying the key industry influencers. The data thus presented is comprehensive, reliable, and the result of extensive research, both primary and secondary.

              INFORMATION SOURCES

              Primary sources

              • Manufacturers and suppliers
              • Channel partners
              • Industry experts
              • Strategic decision makers

              Secondary sources

              • Industry journals and periodicals
              • Government data
              • Financial reports of key industry players
              • Historical data
              • Press releases

              DATA ANALYSIS

              Data Synthesis

              • Collation of data
              • Estimation of key figures
              • Analysis of derived insights

              Data Validation

              • Triangulation with data models
              • Reference against proprietary databases
              • Corroboration with industry experts

              REPORT WRITING

              Qualitative

              • Market drivers
              • Market challenges
              • Market trends
              • Five forces analysis

              Quantitative

              • Market size and forecast
              • Market segmentation
              • Geographical insights
              • Competitive landscape

              Interested in this report?

              Get your sample now to see our research methodology and insights!

              Download Now

              Frequently Asked Questions

              Composite Rebar market growth will increase by $ 334.3 mn during 2024-2028.

              The Composite Rebar market is expected to grow at a CAGR of 9.59% during 2024-2028.

              Composite Rebar market is segmented by End-user( Construction, Marine, Industrial, Others) Type( Glass fiber, Carbon fiber, Basalt fiber, Others, Middle East and Africa)

              ALP Supply, Armastek, Composite Group Chelyabinsk LLC, Everest Composites Pvt. Ltd., FiReP Rebar Technology GmbH, Galen LLC, Hubei Yulong group Jinli New Material Co. Ltd., Kodiak Fiberglass Rebar, Marshall Composite Technology LLC, Mateenbar Ltd., MRG Composites India Pvt. Ltd., Nanjing Fenghui Composite Material Co. Ltd., Owens Corning, Pultron Composites Ltd., Schock Bauteile GmbH, SFTec LLC, Sireg Geotech Srl, Technobasalt Invest LLC, Tribeni Fiber Pvt Ltd., TUF BAR Inc. are a few of the key vendors in the Composite Rebar market.

              North America will register the highest growth rate of 42% among the other regions. Therefore, the Composite Rebar market in North America is expected to garner significant business opportunities for the vendors during the forecast period.

              Brazil, South Africa, UAE, US, Canada, Germany, UK, China, France, Italy, Japan, India, South Korea, Argentina, Russia

              • Increased government spending on infrastructureMultiple government infrastructure projects have been planned in various countries such as India is the driving factor this market.
              • Indonesia is the driving factor this market.
              • and more between 2024 to 2028 Many of these projects are big in terms of investments. Countries give high importance to infrastructure development as infrastructure spending is directly proportional to economic growth. This is because of the rapid expansion of the economy is the driving factor this market.
              • which creates jobs and provides essential services such as energy is the driving factor this market.
              • housing is the driving factor this market.
              • and clean water supply. A countrys strong infrastructure encourages multinational companies (MNCs) to make heavy investments and set up their establishments. Apart from the overall development of the whole economy is the driving factor this market.
              • infrastructure also affects the living standards and human development index of a country. It helps in meeting various demands created by the expansion of the population and the increasing spending power of citizens. Thus is the driving factor this market.
              • the increasing urbanization and development will lead to the growth of the global composite rebar market during the forecast period. is the driving factor this market.

              The Composite Rebar market vendors should focus on grabbing business opportunities from the Construction segment as it accounted for the largest market share in the base year.
              RIA - Research AI Assistant
              Ask RIA