Steel Rebars Market Analysis, Size, and Forecast 2026-2030: APAC (China, Japan, and India), Europe (Germany, UK, and France), North America (US, Canada, and Mexico), Middle East and Africa (Saudi Arabia, UAE, and Turkey), South America (Brazil and Argentina), and Rest of World (ROW)

Steel Rebars Market Analysis, Size, and Forecast 2026-2030:
APAC (China, Japan, and India), Europe (Germany, UK, and France), North America (US, Canada, and Mexico), Middle East and Africa (Saudi Arabia, UAE, and Turkey), South America (Brazil and Argentina), and Rest of World (ROW)

Published: May 2026 302 Pages SKU: IRTNTR45238

Market Overview at a Glance

$66.2 B
Market Opportunity
4.7%
CAGR 2025 - 2030
53%
APAC Growth
$158.7 B
Deformed segment 2024

Steel Rebars Market Size 2026-2030

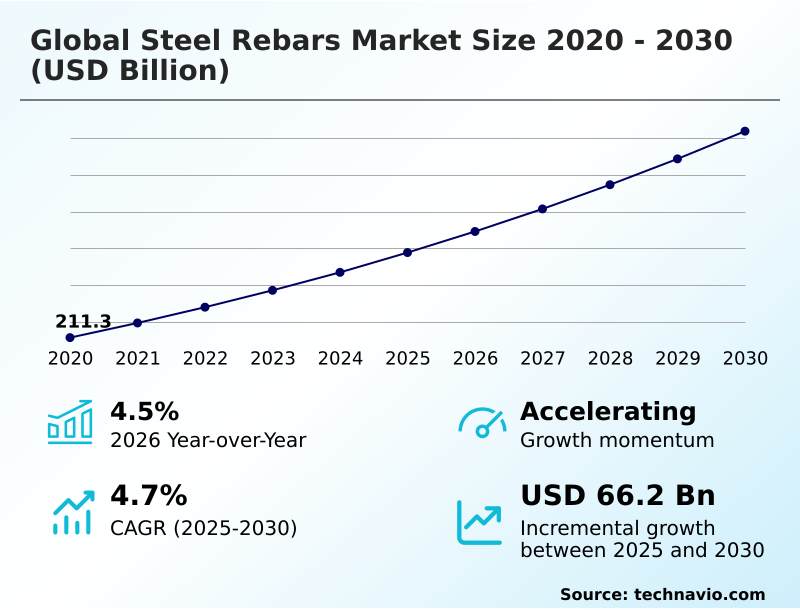
The Steel Rebars Market size was valued at USD 257.7 billion in 2025, growing at a CAGR of 4.7% during the forecast period 2026-2030.

Major Market Trends & Insights

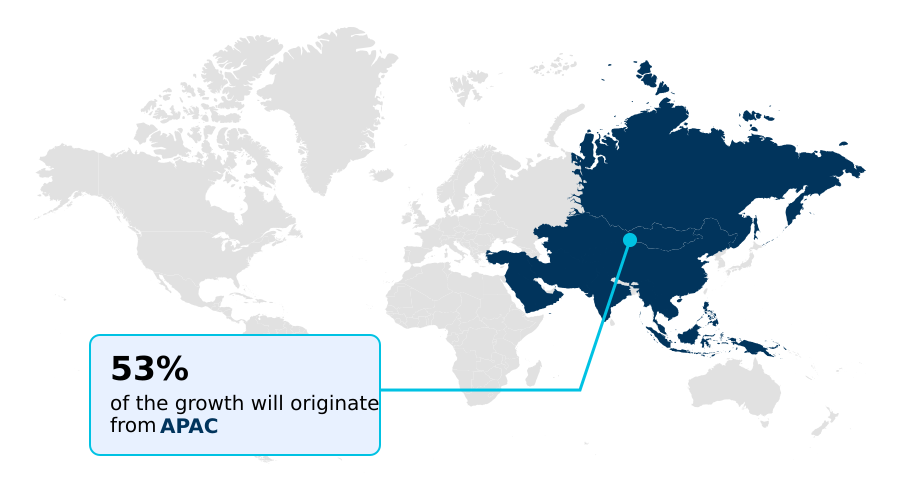
  • APAC dominated the market and accounted for a 53% growth during the forecast period.
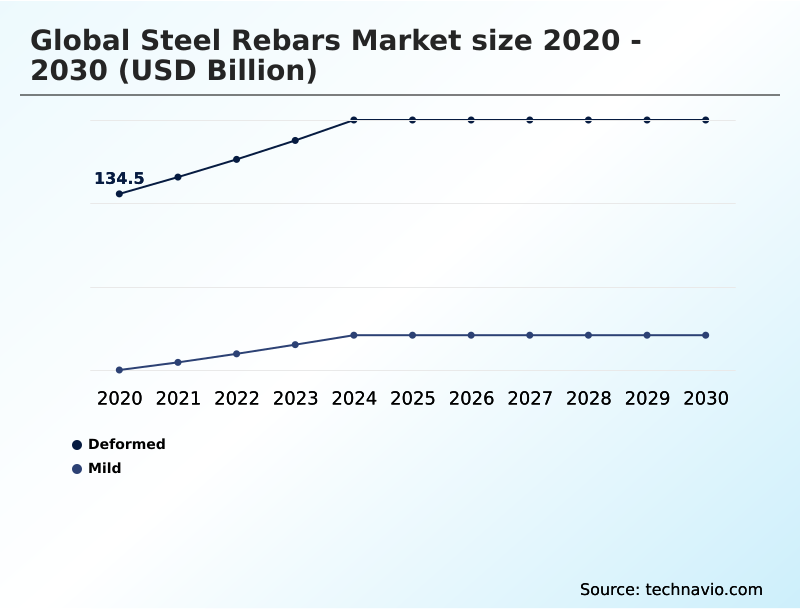
  • By Type - Deformed segment was valued at USD 158.7 billion in 2024
  • By Application - Residential segment accounted for the largest market revenue share in 2024

Market Size & Forecast

  • Historic Market Opportunities 2020-2024: USD 112.6 billion
  • Market Future Opportunities 2025-2030: USD 66.2 billion
  • CAGR from 2025 to 2030 : 4.7%

Market Summary

  • The steel rebars market is characterized by steady demand, with an approximate 4.5% year-over-year growth driven by global construction. APAC continues to dominate the landscape, accounting for over 50% of the market's incremental growth, fueled by massive public infrastructure investment in the region.
  • A key driver is the emphasis on infrastructure development, as nations invest heavily in transportation and utility projects that require vast quantities of reinforced concrete. Conversely, a primary challenge is raw material price volatility, which can increase production costs by over 20% in a single quarter, disrupting supply chain stability.
  • For instance, a manufacturer must balance long-term supply contracts for iron ore against spot market price swings, directly impacting project bidding and profitability. This dynamic requires sophisticated risk management to maintain competitiveness in a market fundamentally linked to global economic health.

What will be the Size of the Steel Rebars Market during the forecast period?

Get Key Insights on Market Forecast (PDF) Request Free Sample

How is the Steel Rebars Market Segmented?

The steel rebars industry research report provides comprehensive data (region-wise segment analysis), with forecasts and analysis for the period 2026-2030, as well as historical data from 2020-2024 for the following segments.

  • Type
    • Deformed
    • Mild
  • Application
    • Residential
    • Commercial
    • Public infrastructure
  • Grade type
    • Grade 60
    • Grade 40
    • Grade 75
    • Grade 80
    • Others
  • Geography
    • APAC
      • China
      • Japan
      • India
    • Europe
      • Germany
      • UK
      • France
    • North America
      • US
      • Canada
      • Mexico
    • Middle East and Africa
      • Saudi Arabia
      • UAE
      • Turkey
    • South America
      • Brazil
      • Argentina
    • Rest of World (ROW)

How is the Steel Rebars Market Segmented by Type?

The deformed segment is estimated to witness significant growth during the forecast period.

The deformed segment, which accounts for over 65% of market volume, is defined by its surface protrusions that enhance concrete bonding properties.

These high-strength deformed bars are essential for modern civil engineering, with demand driven by building code standards requiring superior seismic performance.

In practice, the use of advanced deformed rebar can reduce reinforcement congestion by up to 15% compared to lower-grade alternatives, enabling more efficient concrete placement.

The segment's reliance on thermo-mechanically treated (TMT) processes improves ductility, a critical factor for structural integrity in high-rise construction. This focus on performance ensures the segment's dominance in applications where tensile strength testing and load-bearing capacity are non-negotiable.

Request Free Sample

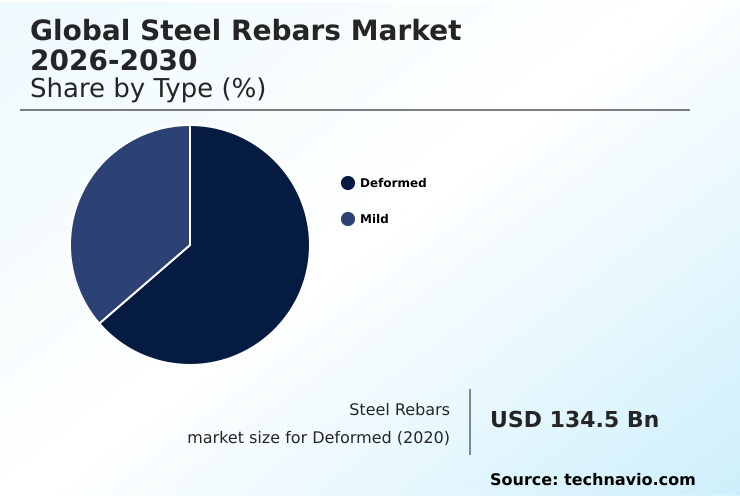
The Deformed segment was valued at USD 158.7 billion in 2024 and showed a gradual increase during the forecast period.

Request Free Sample

How demand for the Steel Rebars market is rising in the leading region?

APAC is estimated to contribute 53% to the growth of the global market during the forecast period.Technavio’s analysts have elaborately explained the regional trends and drivers that shape the market during the forecast period.

See How Steel Rebars Market demand is rising in APAC Request Free Sample

The geographic landscape of the steel rebars market is dominated by APAC, which accounts for approximately 53% of the incremental growth, a figure more than double that of Europe at 19%.

This disparity is driven by massive public infrastructure investment and urban development projects in countries like China and India, with China alone representing nearly 45% of APAC's market value.

In contrast, the European market is characterized by a focus on sustainable building materials and retrofitting existing structures, leading to a higher demand for green steel production.

North America is experiencing a resurgence fueled by federal infrastructure spending, prioritizing durable infrastructure and domestic supply chains.

This regional divergence in demand drivers—new builds in APAC versus modernization and low-carbon steelmaking in Europe—necessitates distinct supply chain logistics and product strategies for global manufacturers.

What are the key Drivers, Trends, and Challenges in the Steel Rebars Market?

Our researchers analyzed the data with 2025 as the base year, along with the key drivers, trends, and challenges. A holistic analysis of drivers will help companies refine their marketing strategies to gain a competitive advantage.

  • Strategic procurement in the construction industry increasingly involves a detailed analysis of steel rebar price per ton vs quality, moving beyond simple cost metrics. For projects in aggressive environments, the specification of corrosion resistant rebar for coastal construction is now standard practice, extending the structural lifespan by over 30% compared to unprotected steel.
  • The decision-making process is further complicated by the debate over using fiber reinforced polymer rebar, which, while having a higher initial cost, offers lifecycle savings in maintenance. Engineers must also consider the benefits of thermo-mechanically treated tmt bars benefits, such as superior weldability and ductility, which are critical in seismically active regions.
  • The selection between high strength steel rebar grades is a crucial design choice, as using a higher grade can reduce steel tonnage by up to 15%, easing rebar congestion and improving concrete consolidation.
  • This choice directly impacts the fundamental production method, influencing the electric arc furnace vs blast furnace steel debate, where sustainability goals and scrap availability play a pivotal role. As regulations tighten, understanding these trade-offs is essential for delivering resilient and cost-effective infrastructure, shaping both project execution and long-term asset performance.

What are the key market drivers leading to the rise in the adoption of Steel Rebars Industry?

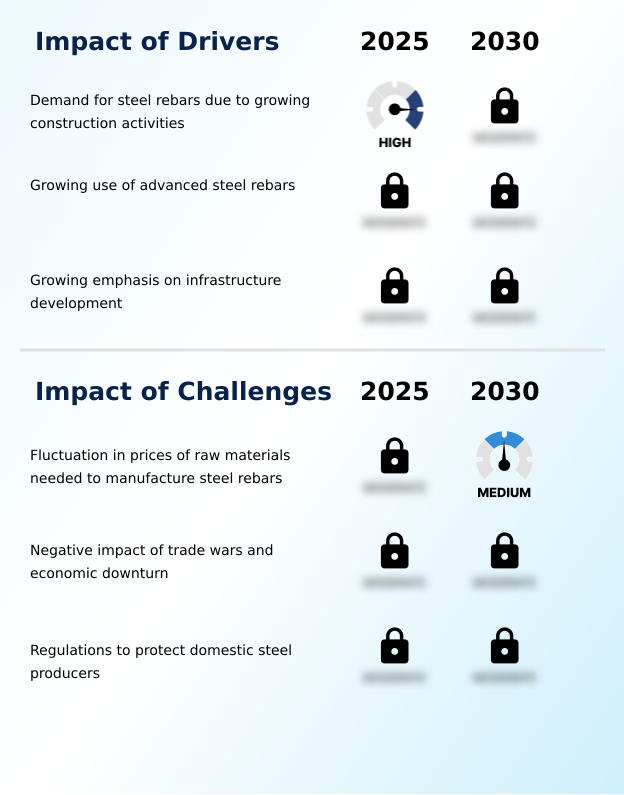
  • The key market driver is the escalating demand for steel rebars, fueled by a global surge in construction and infrastructure development activities.

  • Massive government spending on durable infrastructure is the foremost driver for the steel rebars market, with public infrastructure investment in some emerging economies increasing by over 20% in the last fiscal period.
  • This surge in funding for projects like high-speed railways, bridges, and energy grids creates a direct and sustained demand for high-yield strength steel.
  • Furthermore, the growing adoption of advanced rebar, such as thermo-mechanically treated bars, is driven by stricter structural engineering specifications. These advanced products offer a 15% improvement in seismic performance compared to conventional rebars, enabling the construction of more resilient structures.
  • The use of advanced metallurgical control during production ensures consistent quality, which is critical for meeting these stringent new standards.

What are the market trends shaping the Steel Rebars Industry?

  • An upcoming market trend is the continuous development of product innovations in steel rebars. This is driven by the industry's need for enhanced structural performance and material efficiency.

  • A primary trend reshaping the steel rebars market is the accelerated shift toward sustainable manufacturing, specifically the adoption of electric arc furnace (EAF) steelmaking. This method, which uses over 90% recycled scrap as a feedstock, reduces carbon emissions by up to 75% compared to traditional blast furnace routes, aligning with global carbon neutrality goals and circular economy principles.
  • This transition enables greater production flexibility and is a key factor in lifecycle cost analysis. Concurrently, the increasing use of alternatives like fiber-reinforced polymer (FRP) rebars for specialized applications is gaining momentum. Although a niche segment, FRP offers superior corrosion resistance and is 25% lighter than steel, making it ideal for durable infrastructure in harsh environments.

What challenges does the Steel Rebars Industry face during its growth?

  • A key challenge affecting industry growth is the significant fluctuation in prices for essential raw materials required in the manufacturing of steel rebars.

  • The most significant challenge for the steel rebars market is the extreme raw material price volatility, with key inputs like iron ore experiencing price swings of over 40% in a single year. This instability creates substantial uncertainty in production costing and can inflate final project costs for end-users by as much as 15%.
  • Such fluctuations are compounded by geopolitical supply risks, which can disrupt established supply chain logistics with little warning. In addition, manufacturers face rising environmental compliance costs associated with emissions reduction mandates, further pressuring profit margins. This forces companies to balance long-term procurement strategies against short-term market dynamics, making financial planning and operational stability difficult to achieve.

Exclusive Technavio Analysis on Customer Landscape

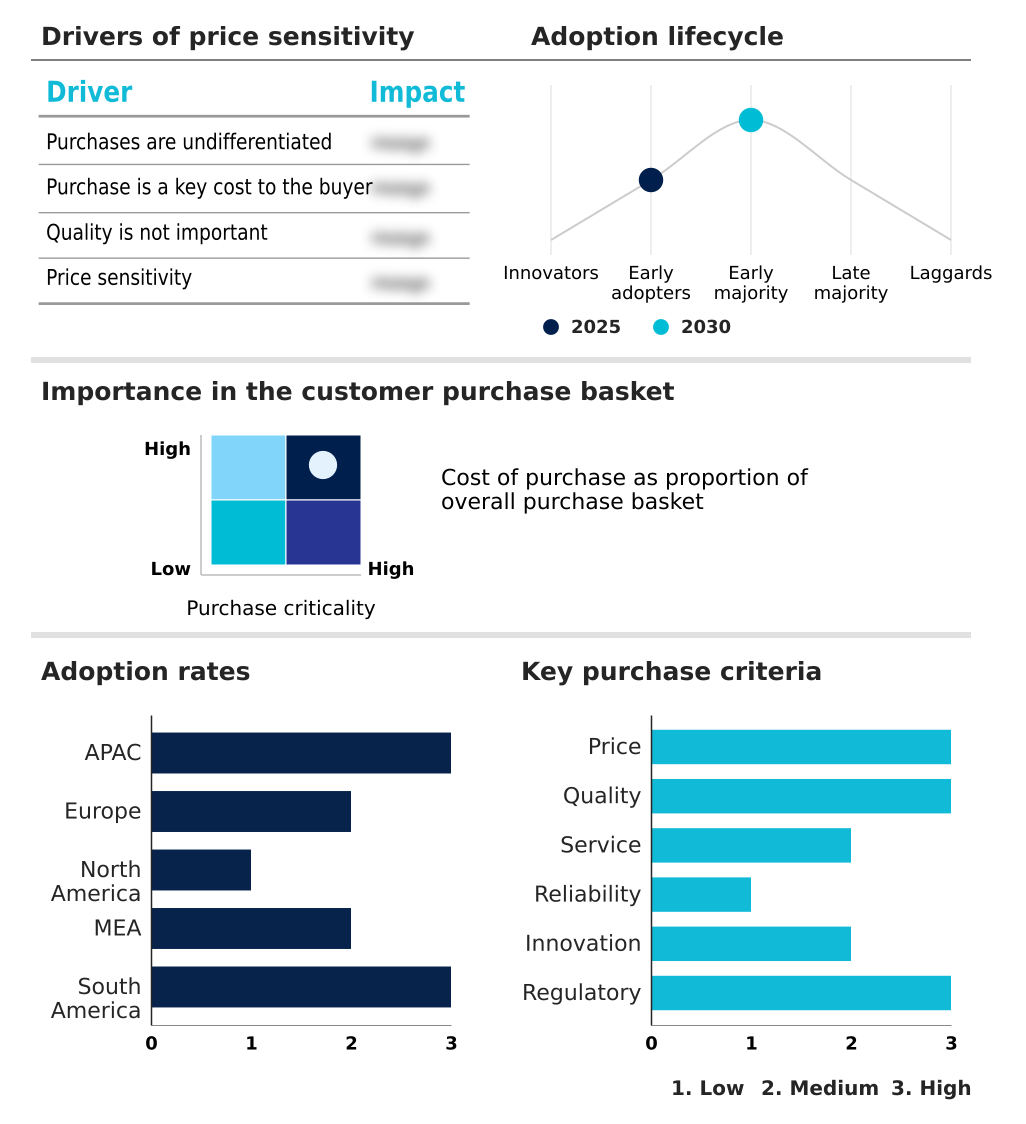
The steel rebars market forecasting report includes the adoption lifecycle of the market, covering from the innovator’s stage to the laggard’s stage. It focuses on adoption rates in different regions based on penetration. Furthermore, the steel rebars market report also includes key purchase criteria and drivers of price sensitivity to help companies evaluate and develop their market growth analysis strategies.

Customer Landscape of Steel Rebars Industry

Competitive Landscape

Companies are implementing various strategies, such as strategic alliances, steel rebars market forecast, partnerships, mergers and acquisitions, geographical expansion, and product/service launches, to enhance their presence in the industry.

Agni Steels Private Ltd. - Offerings include specialized thermo-mechanically treated and high-yield strength steel rebars for demanding construction applications, enhancing structural integrity.

The industry research and growth report includes detailed analyses of the competitive landscape of the market and information about key companies, including:

  • Agni Steels Private Ltd.
  • ArcelorMittal SA
  • Commercial Metals Co.
  • Gerdau SA
  • Hyundai Motor Co.
  • JSW Holdings Ltd.
  • Kamdhenu Ltd.
  • MMD Steel
  • MSP Steel and Power Ltd.
  • Nucor Corp.
  • Primegold International Ltd.
  • Radha Smelters Pvt. Ltd.
  • Rashtriya Ispat Nigam Ltd.
  • Sage Metals Pvt. Ltd.
  • Shagang Group Inc.
  • Spark Electrodes Pvt. Ltd.
  • Super Shakti Metalics Ltd.
  • Tata Steel Ltd.

Qualitative and quantitative analysis of companies has been conducted to help clients understand the wider business environment as well as the strengths and weaknesses of key industry players. Data is qualitatively analyzed to categorize companies as pure play, category-focused, industry-focused, and diversified; it is quantitatively analyzed to categorize companies as dominant, leading, strong, tentative, and weak.

Market Intelligence Radar: High-Impact Developments & Growth Signals

  • In the Steel industry, the increasing adoption of high-strength steel alloys, driven by demand for lighter and more durable end-products, directly boosts the market for advanced steel rebars that offer enhanced structural performance.
  • A global emphasis on infrastructure and construction activities, with many governments launching stimulus programs, has significantly increased the foundational demand for steel long products, including the steel rebars used in nearly all public works.
  • Heightened volatility in the prices of key raw materials like iron ore and coking coal, a persistent issue for steel producers, creates significant cost-management and pricing challenges for steel rebar manufacturers.
  • Mounting environmental concerns and regulations are compelling steel producers to shift production methods, accelerating investment in technologies like electric arc furnaces for steel rebar manufacturing to reduce carbon emissions and meet sustainability mandates.

Dive into Technavio’s robust research methodology, blending expert interviews, extensive data synthesis, and validated models for unparalleled Steel Rebars Market insights. See full methodology.

Market Scope
Page number 302
Base year 2025
Historic period 2020-2024
Forecast period 2026-2030
Growth momentum & CAGR Accelerate at a CAGR of 4.7%
Market growth 2026-2030 USD 66.2 billion
Market structure Fragmented
YoY growth 2025-2026(%) 4.5%
Key countries China, Japan, India, South Korea, Indonesia, Australia, Germany, UK, France, Italy, Spain, The Netherlands, US, Canada, Mexico, Saudi Arabia, UAE, Turkey, South Africa, Israel, Brazil, Argentina and Chile
Competitive landscape Leading Companies, Market Positioning of Companies, Competitive Strategies, and Industry Risks

Request Free Sample

Research Analyst Overview

  • The steel rebars market ecosystem operates on a value chain starting with suppliers of raw materials, primarily iron ore for blast furnace production and scrap steel for electric arc furnaces (EAFs), which now account for a significant share of production. Manufacturers, including integrated mills and mini-mills, transform these inputs into various grades of rebar.
  • Their operations are heavily influenced by high capital expenditure and energy costs, which can represent over 20% of the total production expense. Distribution channels then move the finished products through wholesalers and service centers to end-users in the construction sector, including residential, commercial, and public infrastructure projects.
  • Regulatory bodies enforce building code standards and environmental compliance, steering the industry towards high-yield strength steel and sustainable building materials. This intricate network is supported by logistics providers and R&D entities focused on developing advanced metallurgical controls and more efficient manufacturing processes.

What are the Key Data Covered in this Steel Rebars Market Research and Growth Report?

  • What is the expected growth of the Steel Rebars Market between 2026 and 2030?

    • The Steel Rebars Market is expected to grow by USD 66.2 billion during 2026-2030, registering a CAGR of 4.7%. Year-over-year growth in 2026 is estimated at 4.5%%. This acceleration is shaped by demand for steel rebars due to growing construction activities, which is intensifying demand across multiple end-use verticals covered in the report.

  • What segmentation does the market report cover?

    • The report is segmented by Type (Deformed, and Mild), Application (Residential, Commercial, and Public infrastructure), Grade Type (Grade 60, Grade 40, Grade 75, Grade 80, and Others) and Geography (APAC, Europe, North America, Middle East and Africa, South America). Among these, the Deformed segment is estimated to witness significant growth during the forecast period, driven by rising adoption across key application areas. Each segment includes detailed qualitative and quantitative analysis, along with historical data from 2020-2024 and forecasts through 2030 with year-over-year growth rates.

  • Which regions are analyzed in the report?

    • The report covers APAC, Europe, North America, Middle East and Africa and South America. APAC is estimated to contribute 53% to market growth during the forecast period. Country-level analysis includes China, Japan, India, South Korea, Indonesia, Australia, Germany, UK, France, Italy, Spain, The Netherlands, US, Canada, Mexico, Saudi Arabia, UAE, Turkey, South Africa, Israel, Brazil, Argentina and Chile, with dedicated market size tables and year-over-year growth for each.

  • What are the key growth drivers and market challenges?

    • The primary driver is demand for steel rebars due to growing construction activities, which is accelerating investment and industry demand. The main challenge is fluctuation in prices of raw materials needed to manufacture steel rebars, creating operational barriers for key market participants. The report quantifies the impact of each driver and challenge across 2026 and 2030 with comparative analysis.

  • Who are the major players in the Steel Rebars Market?

    • Key vendors include Agni Steels Private Ltd., ArcelorMittal SA, Commercial Metals Co., Gerdau SA, Hyundai Motor Co., JSW Holdings Ltd., Kamdhenu Ltd., MMD Steel, MSP Steel and Power Ltd., Nucor Corp., Primegold International Ltd., Radha Smelters Pvt. Ltd., Rashtriya Ispat Nigam Ltd., Sage Metals Pvt. Ltd., Shagang Group Inc., Spark Electrodes Pvt. Ltd., Super Shakti Metalics Ltd. and Tata Steel Ltd.. The report provides qualitative and quantitative analysis categorizing companies as dominant, leading, strong, tentative, and weak based on their market positioning. Company profiles include business segment analysis, SWOT assessment, key offerings, and recent strategic developments.

Market Research Insights

  • The global steel rebars market landscape includes more than 15 major producers, with the top five commanding approximately 35% of the market share. Recent developments show a clear focus on regional production and sustainability. Leading North American manufacturers like Nucor Corp. and Commercial Metals Co.
  • are investing in new rebar micro-mills, which are projected to increase regional capacity by over 10%. These mills utilize electric arc furnace technology to serve escalating demand from infrastructure projects. In Asia, players such as Tata Steel Ltd. are expanding capacity for long products to meet domestic needs.
  • This strategic shift addresses supply chain vulnerabilities and aligns with the growing adoption of green steel production methods. The primary challenge remains managing the high capital expenditure required for such upgrades while navigating volatile energy and scrap steel prices.

We can help! Our analysts can customize this steel rebars market research report to meet your requirements.

Get in touch

1. Executive Summary

1.1 Market overview

Executive Summary - Chart on Market Overview
Executive Summary - Data Table on Market Overview
Executive Summary - Chart on Global Market Characteristics
Executive Summary - Chart on Market by Geography
Executive Summary - Chart on Market Segmentation by Type
Executive Summary - Chart on Market Segmentation by Application
Executive Summary - Chart on Market Segmentation by Grade Type
Executive Summary - Chart on Incremental Growth
Executive Summary - Data Table on Incremental Growth
Executive Summary - Chart on Company Market Positioning

2. Technavio Analysis

2.1 Analysis of price sensitivity, lifecycle, customer purchase basket, adoption rates, and purchase criteria

2.2 Criticality of inputs and Factors of differentiation

Chart on Overview on criticality of inputs and factors of differentiation

2.3 Factors of disruption

Chart on Overview on factors of disruption

2.4 Impact of drivers and challenges

Chart on Impact of drivers and challenges in 2025 and 2030

3. Market Landscape

3.1 Market ecosystem

Chart on Parent Market
Data Table on - Parent Market

3.2 Market characteristics

Chart on Market characteristics analysis

3.3 Value chain analysis

Chart on Value chain analysis

4. Market Sizing

4.1 Market definition

Data Table on Offerings of companies included in the market definition

4.2 Market segment analysis

Market segments

4.3 Market size 2025

4.4 Market outlook: Forecast for 2025-2030

Chart on Global - Market size and forecast 2025-2030 ($ billion)
Data Table on Global - Market size and forecast 2025-2030 ($ billion)
Chart on Global Market: Year-over-year growth 2025-2030 (%)
Data Table on Global Market: Year-over-year growth 2025-2030 (%)

5. Historic Market Size

5.1 Global Steel Rebars Market 2020 - 2024

Historic Market Size - Data Table on Global Steel Rebars Market 2020 - 2024 ($ billion)

5.2 Type segment analysis 2020 - 2024

Historic Market Size - Type Segment 2020 - 2024 ($ billion)

5.3 Application segment analysis 2020 - 2024

Historic Market Size - Application Segment 2020 - 2024 ($ billion)

5.4 Grade Type segment analysis 2020 - 2024

Historic Market Size - Grade Type Segment 2020 - 2024 ($ billion)

5.5 Geography segment analysis 2020 - 2024

Historic Market Size - Geography Segment 2020 - 2024 ($ billion)

5.6 Country segment analysis 2020 - 2024

Historic Market Size - Country Segment 2020 - 2024 ($ billion)

6. Qualitative Analysis

6.1 Impact of AI in the Global Steel Rebars Market

7. Five Forces Analysis

7.1 Five forces summary

Five forces analysis - Comparison between 2025 and 2030

7.2 Bargaining power of buyers

Bargaining power of buyers - Impact of key factors 2025 and 2030

7.3 Bargaining power of suppliers

Bargaining power of suppliers - Impact of key factors in 2025 and 2030

7.4 Threat of new entrants

Threat of new entrants - Impact of key factors in 2025 and 2030

7.5 Threat of substitutes

Threat of substitutes - Impact of key factors in 2025 and 2030

7.6 Threat of rivalry

Threat of rivalry - Impact of key factors in 2025 and 2030

7.7 Market condition

Chart on Market condition - Five forces 2025 and 2030

8. Market Segmentation by Type

8.1 Market segments

Chart on Type - Market share 2025-2030 (%)
Data Table on Type - Market share 2025-2030 (%)

8.2 Comparison by Type

Chart on Comparison by Type
Data Table on Comparison by Type

8.3 Deformed - Market size and forecast 2025-2030

Chart on Deformed - Market size and forecast 2025-2030 ($ billion)
Data Table on Deformed - Market size and forecast 2025-2030 ($ billion)
Chart on Deformed - Year-over-year growth 2025-2030 (%)
Data Table on Deformed - Year-over-year growth 2025-2030 (%)

8.4 Mild - Market size and forecast 2025-2030

Chart on Mild - Market size and forecast 2025-2030 ($ billion)
Data Table on Mild - Market size and forecast 2025-2030 ($ billion)
Chart on Mild - Year-over-year growth 2025-2030 (%)
Data Table on Mild - Year-over-year growth 2025-2030 (%)

8.5 Market opportunity by Type

Market opportunity by Type ($ billion)
Data Table on Market opportunity by Type ($ billion)

9. Market Segmentation by Application

9.1 Market segments

Chart on Application - Market share 2025-2030 (%)
Data Table on Application - Market share 2025-2030 (%)

9.2 Comparison by Application

Chart on Comparison by Application
Data Table on Comparison by Application

9.3 Residential - Market size and forecast 2025-2030

Chart on Residential - Market size and forecast 2025-2030 ($ billion)
Data Table on Residential - Market size and forecast 2025-2030 ($ billion)
Chart on Residential - Year-over-year growth 2025-2030 (%)
Data Table on Residential - Year-over-year growth 2025-2030 (%)

9.4 Commercial - Market size and forecast 2025-2030

Chart on Commercial - Market size and forecast 2025-2030 ($ billion)
Data Table on Commercial - Market size and forecast 2025-2030 ($ billion)
Chart on Commercial - Year-over-year growth 2025-2030 (%)
Data Table on Commercial - Year-over-year growth 2025-2030 (%)

9.5 Public infrastructure - Market size and forecast 2025-2030

Chart on Public infrastructure - Market size and forecast 2025-2030 ($ billion)
Data Table on Public infrastructure - Market size and forecast 2025-2030 ($ billion)
Chart on Public infrastructure - Year-over-year growth 2025-2030 (%)
Data Table on Public infrastructure - Year-over-year growth 2025-2030 (%)

9.6 Market opportunity by Application

Market opportunity by Application ($ billion)
Data Table on Market opportunity by Application ($ billion)

10. Market Segmentation by Grade Type

10.1 Market segments

Chart on Grade Type - Market share 2025-2030 (%)
Data Table on Grade Type - Market share 2025-2030 (%)

10.2 Comparison by Grade Type

Chart on Comparison by Grade Type
Data Table on Comparison by Grade Type

10.3 Grade 60 - Market size and forecast 2025-2030

Chart on Grade 60 - Market size and forecast 2025-2030 ($ billion)
Data Table on Grade 60 - Market size and forecast 2025-2030 ($ billion)
Chart on Grade 60 - Year-over-year growth 2025-2030 (%)
Data Table on Grade 60 - Year-over-year growth 2025-2030 (%)

10.4 Grade 40 - Market size and forecast 2025-2030

Chart on Grade 40 - Market size and forecast 2025-2030 ($ billion)
Data Table on Grade 40 - Market size and forecast 2025-2030 ($ billion)
Chart on Grade 40 - Year-over-year growth 2025-2030 (%)
Data Table on Grade 40 - Year-over-year growth 2025-2030 (%)

10.5 Grade 75 - Market size and forecast 2025-2030

Chart on Grade 75 - Market size and forecast 2025-2030 ($ billion)
Data Table on Grade 75 - Market size and forecast 2025-2030 ($ billion)
Chart on Grade 75 - Year-over-year growth 2025-2030 (%)
Data Table on Grade 75 - Year-over-year growth 2025-2030 (%)

10.6 Grade 80 - Market size and forecast 2025-2030

Chart on Grade 80 - Market size and forecast 2025-2030 ($ billion)
Data Table on Grade 80 - Market size and forecast 2025-2030 ($ billion)
Chart on Grade 80 - Year-over-year growth 2025-2030 (%)
Data Table on Grade 80 - Year-over-year growth 2025-2030 (%)

10.7 Others - Market size and forecast 2025-2030

Chart on Others - Market size and forecast 2025-2030 ($ billion)
Data Table on Others - Market size and forecast 2025-2030 ($ billion)
Chart on Others - Year-over-year growth 2025-2030 (%)
Data Table on Others - Year-over-year growth 2025-2030 (%)

10.8 Market opportunity by Grade Type

Market opportunity by Grade Type ($ billion)
Data Table on Market opportunity by Grade Type ($ billion)

11. Customer Landscape

11.1 Customer landscape overview

Analysis of price sensitivity, lifecycle, customer purchase basket, adoption rates, and purchase criteria

12. Geographic Landscape

12.1 Geographic segmentation

Chart on Market share by geography 2025-2030 (%)
Data Table on Market share by geography 2025-2030 (%)

12.2 Geographic comparison

Chart on Geographic comparison
Data Table on Geographic comparison

12.3 APAC - Market size and forecast 2025-2030

Chart on APAC - Market size and forecast 2025-2030 ($ billion)
Data Table on APAC - Market size and forecast 2025-2030 ($ billion)
Chart on APAC - Year-over-year growth 2025-2030 (%)
Data Table on APAC - Year-over-year growth 2025-2030 (%)
Chart on Regional Comparison - APAC
Data Table on Regional Comparison - APAC

12.3.1 China - Market size and forecast 2025-2030

Chart on China - Market size and forecast 2025-2030 ($ billion)
Data Table on China - Market size and forecast 2025-2030 ($ billion)
Chart on China - Year-over-year growth 2025-2030 (%)
Data Table on China - Year-over-year growth 2025-2030 (%)

12.3.2 Japan - Market size and forecast 2025-2030

Chart on Japan - Market size and forecast 2025-2030 ($ billion)
Data Table on Japan - Market size and forecast 2025-2030 ($ billion)
Chart on Japan - Year-over-year growth 2025-2030 (%)
Data Table on Japan - Year-over-year growth 2025-2030 (%)

12.3.3 India - Market size and forecast 2025-2030

Chart on India - Market size and forecast 2025-2030 ($ billion)
Data Table on India - Market size and forecast 2025-2030 ($ billion)
Chart on India - Year-over-year growth 2025-2030 (%)
Data Table on India - Year-over-year growth 2025-2030 (%)

12.3.4 South Korea - Market size and forecast 2025-2030

Chart on South Korea - Market size and forecast 2025-2030 ($ billion)
Data Table on South Korea - Market size and forecast 2025-2030 ($ billion)
Chart on South Korea - Year-over-year growth 2025-2030 (%)
Data Table on South Korea - Year-over-year growth 2025-2030 (%)

12.3.5 Indonesia - Market size and forecast 2025-2030

Chart on Indonesia - Market size and forecast 2025-2030 ($ billion)
Data Table on Indonesia - Market size and forecast 2025-2030 ($ billion)
Chart on Indonesia - Year-over-year growth 2025-2030 (%)
Data Table on Indonesia - Year-over-year growth 2025-2030 (%)

12.3.6 Australia - Market size and forecast 2025-2030

Chart on Australia - Market size and forecast 2025-2030 ($ billion)
Data Table on Australia - Market size and forecast 2025-2030 ($ billion)
Chart on Australia - Year-over-year growth 2025-2030 (%)
Data Table on Australia - Year-over-year growth 2025-2030 (%)

12.4 Europe - Market size and forecast 2025-2030

Chart on Europe - Market size and forecast 2025-2030 ($ billion)
Data Table on Europe - Market size and forecast 2025-2030 ($ billion)
Chart on Europe - Year-over-year growth 2025-2030 (%)
Data Table on Europe - Year-over-year growth 2025-2030 (%)
Chart on Regional Comparison - Europe
Data Table on Regional Comparison - Europe

12.4.1 Germany - Market size and forecast 2025-2030

Chart on Germany - Market size and forecast 2025-2030 ($ billion)
Data Table on Germany - Market size and forecast 2025-2030 ($ billion)
Chart on Germany - Year-over-year growth 2025-2030 (%)
Data Table on Germany - Year-over-year growth 2025-2030 (%)

12.4.2 UK - Market size and forecast 2025-2030

Chart on UK - Market size and forecast 2025-2030 ($ billion)
Data Table on UK - Market size and forecast 2025-2030 ($ billion)
Chart on UK - Year-over-year growth 2025-2030 (%)
Data Table on UK - Year-over-year growth 2025-2030 (%)

12.4.3 France - Market size and forecast 2025-2030

Chart on France - Market size and forecast 2025-2030 ($ billion)
Data Table on France - Market size and forecast 2025-2030 ($ billion)
Chart on France - Year-over-year growth 2025-2030 (%)
Data Table on France - Year-over-year growth 2025-2030 (%)

12.4.4 Italy - Market size and forecast 2025-2030

Chart on Italy - Market size and forecast 2025-2030 ($ billion)
Data Table on Italy - Market size and forecast 2025-2030 ($ billion)
Chart on Italy - Year-over-year growth 2025-2030 (%)
Data Table on Italy - Year-over-year growth 2025-2030 (%)

12.4.5 Spain - Market size and forecast 2025-2030

Chart on Spain - Market size and forecast 2025-2030 ($ billion)
Data Table on Spain - Market size and forecast 2025-2030 ($ billion)
Chart on Spain - Year-over-year growth 2025-2030 (%)
Data Table on Spain - Year-over-year growth 2025-2030 (%)

12.4.6 The Netherlands - Market size and forecast 2025-2030

Chart on The Netherlands - Market size and forecast 2025-2030 ($ billion)
Data Table on The Netherlands - Market size and forecast 2025-2030 ($ billion)
Chart on The Netherlands - Year-over-year growth 2025-2030 (%)
Data Table on The Netherlands - Year-over-year growth 2025-2030 (%)

12.5 North America - Market size and forecast 2025-2030

Chart on North America - Market size and forecast 2025-2030 ($ billion)
Data Table on North America - Market size and forecast 2025-2030 ($ billion)
Chart on North America - Year-over-year growth 2025-2030 (%)
Data Table on North America - Year-over-year growth 2025-2030 (%)
Chart on Regional Comparison - North America
Data Table on Regional Comparison - North America

12.5.1 US - Market size and forecast 2025-2030

Chart on US - Market size and forecast 2025-2030 ($ billion)
Data Table on US - Market size and forecast 2025-2030 ($ billion)
Chart on US - Year-over-year growth 2025-2030 (%)
Data Table on US - Year-over-year growth 2025-2030 (%)

12.5.2 Canada - Market size and forecast 2025-2030

Chart on Canada - Market size and forecast 2025-2030 ($ billion)
Data Table on Canada - Market size and forecast 2025-2030 ($ billion)
Chart on Canada - Year-over-year growth 2025-2030 (%)
Data Table on Canada - Year-over-year growth 2025-2030 (%)

12.5.3 Mexico - Market size and forecast 2025-2030

Chart on Mexico - Market size and forecast 2025-2030 ($ billion)
Data Table on Mexico - Market size and forecast 2025-2030 ($ billion)
Chart on Mexico - Year-over-year growth 2025-2030 (%)
Data Table on Mexico - Year-over-year growth 2025-2030 (%)

12.6 Middle East and Africa - Market size and forecast 2025-2030

Chart on Middle East and Africa - Market size and forecast 2025-2030 ($ billion)
Data Table on Middle East and Africa - Market size and forecast 2025-2030 ($ billion)
Chart on Middle East and Africa - Year-over-year growth 2025-2030 (%)
Data Table on Middle East and Africa - Year-over-year growth 2025-2030 (%)
Chart on Regional Comparison - Middle East and Africa
Data Table on Regional Comparison - Middle East and Africa

12.6.1 Saudi Arabia - Market size and forecast 2025-2030

Chart on Saudi Arabia - Market size and forecast 2025-2030 ($ billion)
Data Table on Saudi Arabia - Market size and forecast 2025-2030 ($ billion)
Chart on Saudi Arabia - Year-over-year growth 2025-2030 (%)
Data Table on Saudi Arabia - Year-over-year growth 2025-2030 (%)

12.6.2 UAE - Market size and forecast 2025-2030

Chart on UAE - Market size and forecast 2025-2030 ($ billion)
Data Table on UAE - Market size and forecast 2025-2030 ($ billion)
Chart on UAE - Year-over-year growth 2025-2030 (%)
Data Table on UAE - Year-over-year growth 2025-2030 (%)

12.6.3 Turkey - Market size and forecast 2025-2030

Chart on Turkey - Market size and forecast 2025-2030 ($ billion)
Data Table on Turkey - Market size and forecast 2025-2030 ($ billion)
Chart on Turkey - Year-over-year growth 2025-2030 (%)
Data Table on Turkey - Year-over-year growth 2025-2030 (%)

12.6.4 South Africa - Market size and forecast 2025-2030

Chart on South Africa - Market size and forecast 2025-2030 ($ billion)
Data Table on South Africa - Market size and forecast 2025-2030 ($ billion)
Chart on South Africa - Year-over-year growth 2025-2030 (%)
Data Table on South Africa - Year-over-year growth 2025-2030 (%)

12.6.5 Israel - Market size and forecast 2025-2030

Chart on Israel - Market size and forecast 2025-2030 ($ billion)
Data Table on Israel - Market size and forecast 2025-2030 ($ billion)
Chart on Israel - Year-over-year growth 2025-2030 (%)
Data Table on Israel - Year-over-year growth 2025-2030 (%)

12.7 South America - Market size and forecast 2025-2030

Chart on South America - Market size and forecast 2025-2030 ($ billion)
Data Table on South America - Market size and forecast 2025-2030 ($ billion)
Chart on South America - Year-over-year growth 2025-2030 (%)
Data Table on South America - Year-over-year growth 2025-2030 (%)
Chart on Regional Comparison - South America
Data Table on Regional Comparison - South America

12.7.1 Brazil - Market size and forecast 2025-2030

Chart on Brazil - Market size and forecast 2025-2030 ($ billion)
Data Table on Brazil - Market size and forecast 2025-2030 ($ billion)
Chart on Brazil - Year-over-year growth 2025-2030 (%)
Data Table on Brazil - Year-over-year growth 2025-2030 (%)

12.7.2 Argentina - Market size and forecast 2025-2030

Chart on Argentina - Market size and forecast 2025-2030 ($ billion)
Data Table on Argentina - Market size and forecast 2025-2030 ($ billion)
Chart on Argentina - Year-over-year growth 2025-2030 (%)
Data Table on Argentina - Year-over-year growth 2025-2030 (%)

12.7.3 Chile - Market size and forecast 2025-2030

Chart on Chile - Market size and forecast 2025-2030 ($ billion)
Data Table on Chile - Market size and forecast 2025-2030 ($ billion)
Chart on Chile - Year-over-year growth 2025-2030 (%)
Data Table on Chile - Year-over-year growth 2025-2030 (%)

12.8 Market opportunity by geography

Market opportunity by geography ($ billion)
Data Tables on Market opportunity by geography ($ billion)

13. Drivers, Challenges, and Opportunity

13.1 Market drivers

Demand for steel rebars due to growing construction activities
Growing use of advanced steel rebars
Growing emphasis on infrastructure development

13.2 Market challenges

Fluctuation in prices of raw materials needed to manufacture steel rebars
Negative impact of trade wars and economic downturn
Regulations to protect domestic steel producers

13.3 Impact of drivers and challenges

Impact of drivers and challenges in 2025 and 2030

13.4 Market opportunities

Growing product innovations in steel rebars
Increasing use of electric arc furnaces in steel production
Increasing use of FRP rebars and hollow FRP rebars

14. Competitive Landscape

14.1 Overview

14.2

Overview on criticality of inputs and factors of differentiation

14.3 Landscape disruption

Overview on factors of disruption

14.4 Industry risks

Impact of key risks on business

15. Competitive Analysis

15.1 Companies profiled

Companies covered

15.2 Company ranking index

15.3 Market positioning of companies

Matrix on companies position and classification

15.4 Agni Steels Private Ltd.

Agni Steels Private Ltd. - Overview
Agni Steels Private Ltd. - Product / Service
Agni Steels Private Ltd. - Key offerings
SWOT

15.5 ArcelorMittal SA

ArcelorMittal SA - Overview
ArcelorMittal SA - Business segments
ArcelorMittal SA - Key news
ArcelorMittal SA - Key offerings
ArcelorMittal SA - Segment focus
SWOT

15.6 Commercial Metals Co.

Commercial Metals Co. - Overview
Commercial Metals Co. - Business segments
Commercial Metals Co. - Key offerings
Commercial Metals Co. - Segment focus
SWOT

15.7 Gerdau SA

Gerdau SA - Overview
Gerdau SA - Business segments
Gerdau SA - Key offerings
Gerdau SA - Segment focus
SWOT

15.8 Hyundai Motor Co.

Hyundai Motor Co. - Overview
Hyundai Motor Co. - Business segments
Hyundai Motor Co. - Key news
Hyundai Motor Co. - Key offerings
Hyundai Motor Co. - Segment focus
SWOT

15.9 JSW Holdings Ltd.

JSW Holdings Ltd. - Overview
JSW Holdings Ltd. - Business segments
JSW Holdings Ltd. - Key offerings
JSW Holdings Ltd. - Segment focus
SWOT

15.10 Kamdhenu Ltd.

Kamdhenu Ltd. - Overview
Kamdhenu Ltd. - Business segments
Kamdhenu Ltd. - Key offerings
Kamdhenu Ltd. - Segment focus
SWOT

15.11 MSP Steel and Power Ltd.

MSP Steel and Power Ltd. - Overview
MSP Steel and Power Ltd. - Business segments
MSP Steel and Power Ltd. - Key offerings
MSP Steel and Power Ltd. - Segment focus
SWOT

15.12 Nucor Corp.

Nucor Corp. - Overview
Nucor Corp. - Business segments
Nucor Corp. - Key offerings
Nucor Corp. - Segment focus
SWOT

15.13 Primegold International Ltd.

Primegold International Ltd. - Overview
Primegold International Ltd. - Product / Service
Primegold International Ltd. - Key offerings
SWOT

15.14 Radha Smelters Pvt. Ltd.

Radha Smelters Pvt. Ltd. - Overview
Radha Smelters Pvt. Ltd. - Product / Service
Radha Smelters Pvt. Ltd. - Key offerings
SWOT

15.15 Rashtriya Ispat Nigam Ltd.

Rashtriya Ispat Nigam Ltd. - Overview
Rashtriya Ispat Nigam Ltd. - Business segments
Rashtriya Ispat Nigam Ltd. - Key offerings
Rashtriya Ispat Nigam Ltd. - Segment focus
SWOT

15.16 Shagang Group Inc.

Shagang Group Inc. - Overview
Shagang Group Inc. - Product / Service
Shagang Group Inc. - Key offerings
SWOT

15.17 Spark Electrodes Pvt. Ltd.

Spark Electrodes Pvt. Ltd. - Overview
Spark Electrodes Pvt. Ltd. - Product / Service
Spark Electrodes Pvt. Ltd. - Key offerings
SWOT

15.18 Tata Steel Ltd.

Tata Steel Ltd. - Overview
Tata Steel Ltd. - Business segments
Tata Steel Ltd. - Key offerings
Tata Steel Ltd. - Segment focus
SWOT

16. Appendix

16.1 Scope of the report

Market definition
Objectives
Notes and caveats

16.2 Inclusions and exclusions checklist

Inclusions checklist
Exclusions checklist

16.3 Currency conversion rates for US$

16.4 Research methodology

16.5 Data procurement

Information sources

16.6 Data validation

16.7 Validation techniques employed for market sizing

16.8 Data synthesis

16.9 360 degree market analysis

16.10 List of abbreviations

Research Methodology

Technavio presents a detailed picture of the market by way of study, synthesis, and summation of data from multiple sources. The analysts have presented the various facets of the market with a particular focus on identifying the key industry influencers. The data thus presented is comprehensive, reliable, and the result of extensive research, both primary and secondary.

INFORMATION SOURCES

Primary sources

  • Manufacturers and suppliers
  • Channel partners
  • Industry experts
  • Strategic decision makers

Secondary sources

  • Industry journals and periodicals
  • Government data
  • Financial reports of key industry players
  • Historical data
  • Press releases

DATA ANALYSIS

Data Synthesis

  • Collation of data
  • Estimation of key figures
  • Analysis of derived insights

Data Validation

  • Triangulation with data models
  • Reference against proprietary databases
  • Corroboration with industry experts

REPORT WRITING

Qualitative

  • Market drivers
  • Market challenges
  • Market trends
  • Five forces analysis

Quantitative

  • Market size and forecast
  • Market segmentation
  • Geographical insights
  • Competitive landscape

Interested in this report?

Get your sample now to see our research methodology and insights!

Download Now

Frequently Asked Questions

Steel Rebars market growth will increase by USD 66.2 billion during 2026-2030.

The Steel Rebars market is expected to grow at a CAGR of 4.7% during 2026-2030.

Steel Rebars market is segmented by Type (Deformed, Mild) Application (Residential, Commercial, Public infrastructure) Grade type (Grade 60, Grade 40, Grade 75, Grade 80, Others)

Agni Steels Private Ltd., ArcelorMittal SA, Commercial Metals Co., Gerdau SA, Hyundai Motor Co., JSW Holdings Ltd., Kamdhenu Ltd., MMD Steel, MSP Steel and Power Ltd., Nucor Corp., Primegold International Ltd., Radha Smelters Pvt. Ltd., Rashtriya Ispat Nigam Ltd., Sage Metals Pvt. Ltd., Shagang Group Inc., Spark Electrodes Pvt. Ltd., Super Shakti Metalics Ltd., Tata Steel Ltd. are a few of the key vendors in the Steel Rebars market.

APAC will register the highest growth rate of 53% among the other regions. Therefore, the Steel Rebars market in APAC is expected to garner significant business opportunities for the vendors during the forecast period.

China, Japan, India, South Korea, Indonesia, Australia, Germany, UK, France, Italy, Spain, The Netherlands, US, Canada, Mexico, Saudi Arabia, UAE, Turkey, South Africa, Israel, Brazil, Argentina, Chile

  • Demand for steel rebars due to growing construction activities is the driving factor this market.

The Steel Rebars market vendors should focus on grabbing business opportunities from the Type segment as it accounted for the largest market share in the base year.
RIA - Research AI Assistant
Ask RIA