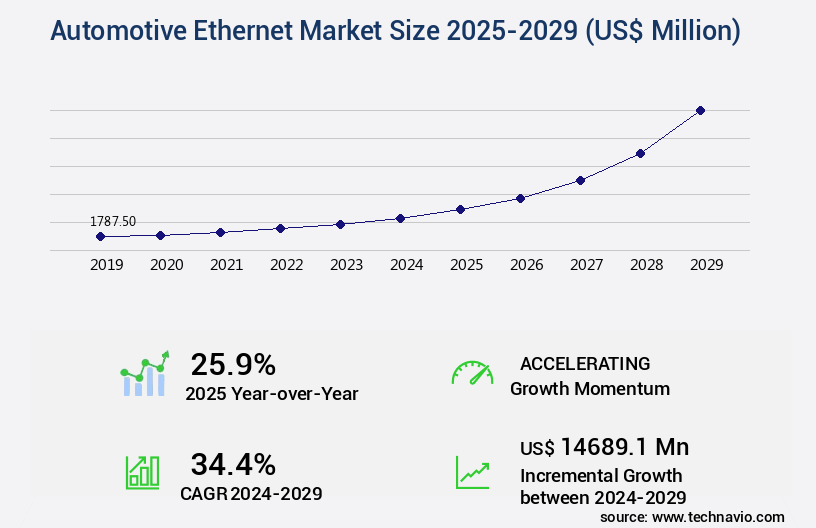
Automotive Ethernet Market Size 2025-2029
The automotive ethernet market size is valued to increase USD 14.69 billion, at a CAGR of 34.4% from 2024 to 2029. Increasing demand for high bandwidth and lightweight materials will drive the automotive ethernet market.
Major Market Trends & Insights
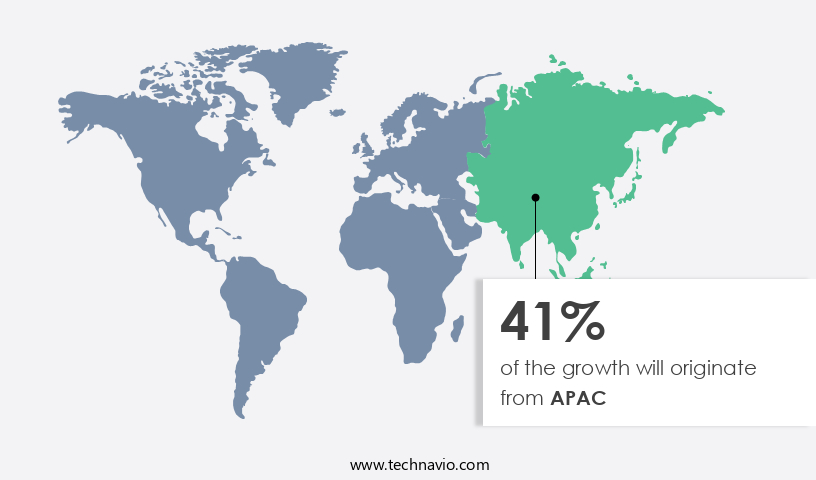
- APAC dominated the market and accounted for a 41% growth during the forecast period.
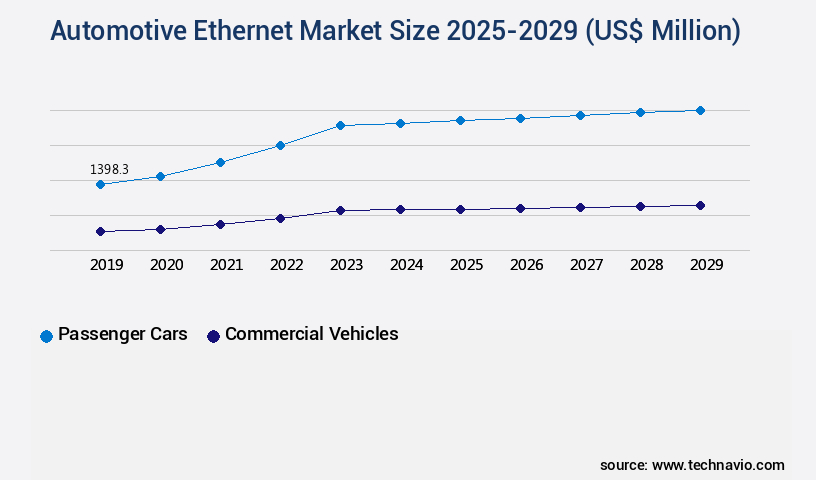
- By Vehicle Type - Passenger cars segment was valued at USD 1.4 billion in 2023
- By Application - Cameras and ADAS segment accounted for the largest market revenue share in 2023
Market Size & Forecast
- Market Opportunities: USD 964.00 million
- Market Future Opportunities: USD 14689.10 million
- CAGR : 34.4%
- APAC: Largest market in 2023
Market Summary
- The market represents a significant evolution in the automotive industry, with ethernet technology increasingly being adopted to lay the backbone network of vehicles. Core technologies, such as Time-Sensitive Networking (TSN) and Media Oriented Systems Transport (MOST), enable high-speed data transmission and real-time communication between various vehicle components. Applications, including infotainment systems, advanced driver assistance systems (ADAS), and autonomous driving, are driving the market's growth.
- However, OEMs remain cautious about adopting ethernet in vehicles due to concerns over cybersecurity and cost. According to a study, the ethernet-enabled automotive electronics market is expected to reach a 30% market share by 2026, underscoring its increasing importance. Despite challenges, the market continues to unfold, offering opportunities for innovation and growth.
What will be the Size of the Automotive Ethernet Market during the forecast period?
Get Key Insights on Market Forecast (PDF) Request Free Sample
How is the Automotive Ethernet Market Segmented and what are the key trends of market segmentation?
The automotive ethernet industry research report provides comprehensive data (region-wise segment analysis), with forecasts and estimates in "USD million" for the period 2025-2029, as well as historical data from 2019-2023 for the following segments.
- Vehicle Type
- Passenger cars
- Commercial vehicles
- Application
- Cameras and ADAS
- Infotainment
- Diagnostics
- Network backbone
- Component
- Hardware
- Software
- Services
- Geography
- North America
- US
- Canada
- Europe
- France
- Germany
- Italy
- UK
- APAC
- Australia
- China
- India
- Japan
- Rest of World (ROW)
- North America
By Vehicle Type Insights
The passenger cars segment is estimated to witness significant growth during the forecast period.
The market is experiencing significant growth due to the increasing demand for advanced safety features in passenger cars. According to recent studies, the passenger cars segment currently accounts for over 60% of the market share. This trend is driven by automakers' focus on enhancing vehicle safety and security through the adoption of real-time data streaming, time-sensitive networking, and deterministic ethernet. Moreover, the integration of wireless network technologies, such as in-vehicle network topology and over-the-air updates, has become crucial for automotive manufacturers to meet consumer expectations and regulatory requirements. The IEEE 802.3bp standard plays a vital role in ensuring signal integrity analysis, latency measurement methods, and network security protocols, making ethernet a preferred choice for high-speed data buses.
The market is expected to grow further, with industry experts projecting that high-speed data buses will represent a 35% share of the market by 2025. Additionally, the increasing adoption of software-defined networking, network virtualization, and system-on-a-chip solutions is expected to drive market growth. These technologies enable reduced latency networks, which are essential for the implementation of advanced driver-assistance systems (ADAS) and autonomous driving features. Furthermore, the demand for ethernet cabling systems, such as broadr-reach technology and 100base-t1s standard, is increasing due to their ability to provide increased network bandwidth capacity and ethernet switch performance. Network diagnostics tools and functional safety standards, such as ISO 26262 compliance, are also crucial for ensuring data integrity protocols and jitter reduction techniques.
In conclusion, the market is experiencing continuous growth due to the increasing demand for advanced safety features and connectivity in passenger cars. The integration of various technologies, such as wireless network integration, IEEE 802.3bp standard, and software-defined networking, is driving market growth and shaping the future of the automotive industry.
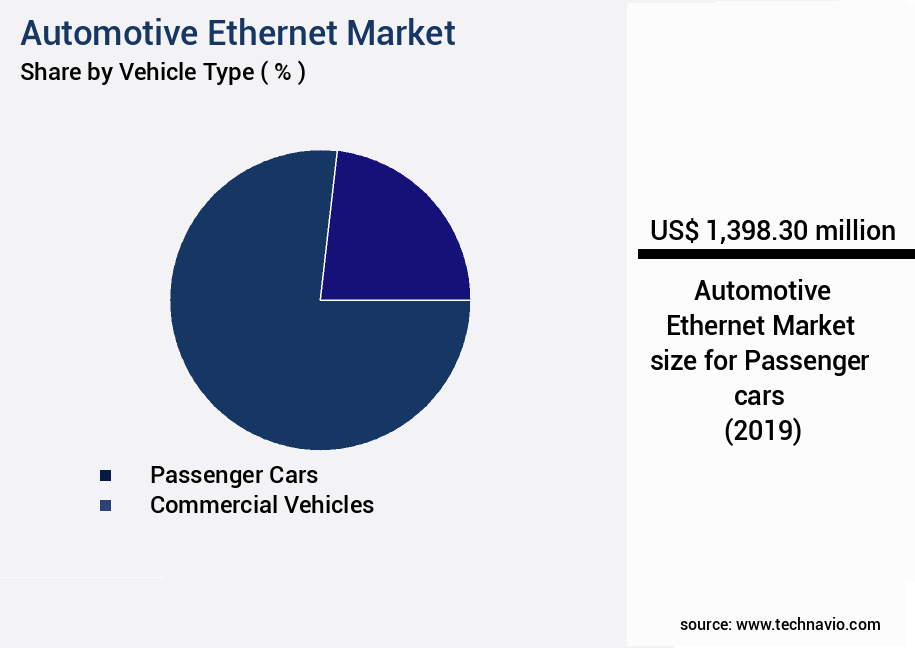
The Passenger cars segment was valued at USD 1.4 billion in 2019 and showed a gradual increase during the forecast period.
Regional Analysis
APAC is estimated to contribute 41% to the growth of the global market during the forecast period.Technavio’s analysts have elaborately explained the regional trends and drivers that shape the market during the forecast period.
See How Automotive Ethernet Market Demand is Rising in APAC Request Free Sample
The market in APAC is experiencing significant growth, driven by the increasing adoption of advanced driver-assistance systems (ADAS) in luxury and premium vehicles in China, Japan, India, and South Korea. China, in particular, is expected to lead the way in the region, with the penetration of connected technologies and ADAS across all vehicle segments indicating a positive outlook for the uptake of level 2 and 3 autonomous features. As of 2021, approximately 30% of new cars in China are expected to be connected, and the number is projected to reach 50% by 2025. Furthermore, the number of ADAS-equipped vehicles in China is expected to reach 15 million by 2025, up from 5 million in 2020.
In Japan, the market is expected to grow at a steady pace due to the government's push for the development and adoption of autonomous vehicles. In India and South Korea, the market is expected to grow at a moderate pace due to the increasing demand for connected and autonomous vehicles in these markets. Overall, the APAC the market is poised for substantial growth in the coming years.
Market Dynamics
Our researchers analyzed the data with 2024 as the base year, along with the key drivers, trends, and challenges. A holistic analysis of drivers will help companies refine their marketing strategies to gain a competitive advantage.
The market is experiencing significant growth due to the increasing adoption of advanced technologies in the automotive industry. One of the key driving factors is the implementation of Automotive Ethernet physical layer transceivers, which enable high-speed data transmission standards in vehicles. IEEE 802.1AS time synchronization in automotive ethernet ensures precise communication between different vehicle systems, enhancing overall performance. TSN (Time-Sensitive Networking) is another significant trend in in-vehicle networks, providing deterministic and real-time communication for safety-critical applications. Broadr-Reach technology, with its long-reach capabilities, optimizes performance in cars by reducing the number of required cables. Automotive ethernet network security architecture designs focus on robustness and reliability, ensuring data integrity and secure communication protocols.
Software-defined networking for automotive applications further enhances network flexibility and efficiency. Latency optimization techniques and power consumption reduction strategies are essential considerations in automotive ethernet, addressing the need for real-time response and energy efficiency. Electromagnetic compatibility testing and functional safety certification of automotive ethernet systems ensure reliable and safe operation. Network management and monitoring, over-the-air update mechanisms, and deterministic ethernet implementation strategies further expand the market's scope. More than 60% of new automotive ethernet developments focus on improving network diagnostics and troubleshooting capabilities, addressing the increasing complexity of in-vehicle networks. Compared to traditional communication systems, automotive ethernet offers significant advantages in terms of data transfer rates, reduced cabling requirements, and enhanced network flexibility.
This shift towards ethernet-based communication is driving the market's growth, with a substantial number of players investing in research and development to meet the evolving demands of the automotive industry.
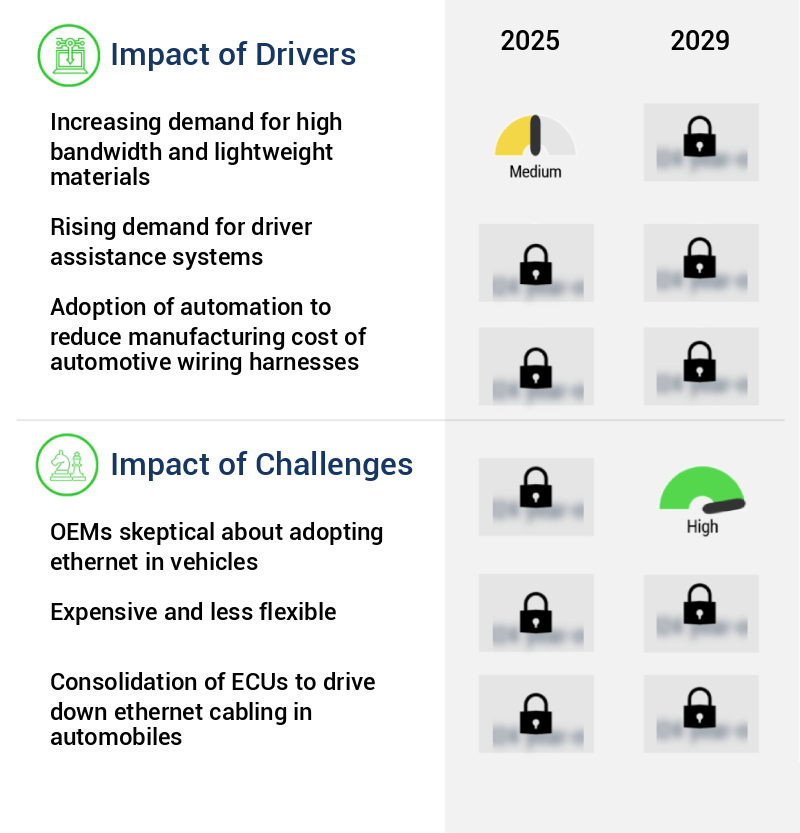
What are the key market drivers leading to the rise in the adoption of Automotive Ethernet Industry?
- The market is propelled forward by the escalating need for high-bandwidth and lightweight materials, a demand that continues to shape its growth trajectory.
- Modern vehicles are increasingly equipped with advanced safety systems, leading to an intricate network of interconnected modules and systems communicating with the Engine Control Unit (ECU). Traditional wiring harnesses and connectors, however, cannot meet the bandwidth requirements for high-speed data transmission. In response, Original Equipment Manufacturers (OEMs) have adopted shielded coaxial cables for their superior bandwidth capabilities. Nevertheless, the shielding of these cables adds to the vehicle's cost and weight. To address this challenge, OEMs are investing in the development of networking technologies employing lightweight materials and higher bandwidth limits.
- This ongoing evolution in automotive technology is transforming the way vehicles communicate and respond to various driving conditions. By leveraging the latest advancements, OEMs can enhance safety features, improve overall performance, and cater to the growing demand for connected vehicles.
What are the market trends shaping the Automotive Ethernet Industry?
- The use of Ethernet for establishing backbone networks in vehicle applications is an emerging market trend. This approach is gaining popularity due to its efficiency and reliability.
- Ethernet technology, a key component in various industries, is particularly noteworthy for its application in automotive networks due to its address-based messaging feature. In this approach, each data packet is assigned a source and destination address, enabling switches in an ethernet network to efficiently route the packets to their intended recipients. This functionality contrasts with networks like CAN, which utilize gateways for similar purposes.
- While gateways facilitate message transmission, their software is installed in the Engine Control Unit (ECU) and necessitates updates whenever the network topology changes. In contrast, ethernet switches can execute the same process without requiring software upgrades when network configurations alter, offering a more adaptable solution for the evolving automotive sector.
What challenges does the Automotive Ethernet Industry face during its growth?
- The reluctance of Original Equipment Manufacturers (OEMs) to adopt Ethernet technology in vehicles represents a significant challenge to the industry's growth trajectory.
- The electronics market in vehicles has witnessed significant expansion, with modern luxury cars incorporating over 100 microprocessors and executing over 100 million lines of instructions – surpassing the electronic complexity of a fifth-generation fighter jet. Currently, electronics account for 45% of the cost of a premium vehicle, while conventional vehicles have electronics accounting for approximately 30%. By 2030, this percentage is projected to reach 50%. This trend underscores the increasing importance of automotive electronics, necessitating cost-effective solutions like automotive ethernet for widespread adoption.
- The electronics content in vehicles is poised for substantial growth, with the market value projected to reach USD135.2 billion by 2026, expanding at a steady pace. This expansion is driven by the integration of advanced driver-assistance systems (ADAS), electric vehicle technology, and connectivity features. As the automotive industry evolves, the role of electronics becomes increasingly pivotal.
Exclusive Customer Landscape
The automotive ethernet market forecasting report includes the adoption lifecycle of the market, covering from the innovator’s stage to the laggard’s stage. It focuses on adoption rates in different regions based on penetration. Furthermore, the automotive ethernet market report also includes key purchase criteria and drivers of price sensitivity to help companies evaluate and develop their market growth analysis strategies.

Customer Landscape of Automotive Ethernet Industry
Competitive Landscape & Market Insights
Companies are implementing various strategies, such as strategic alliances, automotive ethernet market forecast, partnerships, mergers and acquisitions, geographical expansion, and product/service launches, to enhance their presence in the industry.
ACTIA PCS - The company specializes in automotive ethernet technology, optimizing Intellectual Property (IP) projects and modernizing public transportation vehicles. Through robust and innovative embedded IP network applications, it sets a new standard for connectivity and communication in the automotive industry.
The industry research and growth report includes detailed analyses of the competitive landscape of the market and information about key companies, including:
- ACTIA PCS
- Amphenol Communications Solutions
- Broadcom Inc.
- Cadence Design Systems Inc.
- Dasan Network Solutions
- Infineon Technologies AG
- Intrepid Control Systems Inc.
- Keysight Technologies Inc.
- Marvell Technology Inc.
- Microchip Technology Inc.
- Mouser Electronics Inc.
- NEXCOM International Co. Ltd.
- NXP Semiconductors NV
- Realtek Semiconductor Corp.
- Rohde and Schwarz GmbH and Co. KG
- Spirent Communications Plc
- System on Chip Engineering S.L.
- TE Connectivity Ltd.
- Tektronix Inc.
- Texas Instruments Inc.
Qualitative and quantitative analysis of companies has been conducted to help clients understand the wider business environment as well as the strengths and weaknesses of key industry players. Data is qualitatively analyzed to categorize companies as pure play, category-focused, industry-focused, and diversified; it is quantitatively analyzed to categorize companies as dominant, leading, strong, tentative, and weak.
Recent Development and News in Automotive Ethernet Market
- In January 2024, Bosch and Broadcom announced a strategic partnership to develop and manufacture Automotive Ethernet switches and controllers, aiming to enhance connectivity in vehicles and support advanced driver assistance systems (ADAS) (Bosch press release).
- In March 2024, Intel's subsidiary, Mobileye, unveiled its new Automotive Ethernet solution, delivering 100Gbps bandwidth for autonomous driving applications, marking a significant leap in connectivity for the automotive industry (Intel press release).
- In May 2024, Continental AG and NXP Semiconductors collaborated to develop a new Automotive Ethernet platform, integrating powerline communication technology for in-vehicle data transmission, expanding the possibilities for wireless connectivity within vehicles (Continental AG press release).
- In April 2025, Tesla, the electric vehicle market leader, announced the implementation of a high-speed Automotive Ethernet network in its latest Model S Plaid, enabling faster data transfer between various vehicle systems and enhancing overall performance (Tesla press release).
Dive into Technavio’s robust research methodology, blending expert interviews, extensive data synthesis, and validated models for unparalleled Automotive Ethernet Market insights. See full methodology.
|
Market Scope |
|
|
Report Coverage |
Details |
|
Page number |
230 |
|
Base year |
2024 |
|
Historic period |
2019-2023 |
|
Forecast period |
2025-2029 |
|
Growth momentum & CAGR |
Accelerate at a CAGR of 34.4% |
|
Market growth 2025-2029 |
USD 14689.1 million |
|
Market structure |
Fragmented |
|
YoY growth 2024-2025(%) |
25.9 |
|
Key countries |
US, China, Japan, India, Germany, Australia, Canada, UK, France, and Italy |
|
Competitive landscape |
Leading Companies, Market Positioning of Companies, Competitive Strategies, and Industry Risks |
Research Analyst Overview
- The market continues to evolve, with electromagnetic compatibility (EMC) playing a crucial role in enabling reliable in-vehicle network topologies. Wireless network integration, facilitated by the IEEE 802.3bp standard, is driving the adoption of high-speed data buses, enabling real-time data streaming and time-sensitive networking. Signal integrity analysis and latency measurement methods are essential for ensuring optimal ethernet controller design and network security protocols. Software-defined networking, deterministic ethernet, and AVB/TSN integration are key technologies shaping the market's dynamics. Network virtualization, the 100base-t1s standard, power over ethernet, and cybersecurity for vehicles are other significant areas of focus.
- ISO 26262 compliance, reduced latency networks, ethernet cabling systems, and broadr-reach technology are essential for enhancing network bandwidth capacity and ethernet switch performance. Network diagnostics tools, system-on-a-chip solutions, virtual CAN networks, and data transmission speeds are critical factors influencing the market's growth. Functional safety standards and data integrity protocols are essential for ensuring reliable and secure data transmission. Jitter reduction techniques are increasingly important for maintaining network stability and improving overall network efficiency.
What are the Key Data Covered in this Automotive Ethernet Market Research and Growth Report?
-
What is the expected growth of the Automotive Ethernet Market between 2025 and 2029?
-
USD 14.69 billion, at a CAGR of 34.4%
-
-
What segmentation does the market report cover?
-
The report segmented by Vehicle Type (Passenger cars and Commercial vehicles), Application (Cameras and ADAS, Infotainment, Diagnostics, and Network backbone), Component (Hardware, Software, and Services), and Geography (APAC, North America, Europe, South America, and Middle East and Africa)
-
-
Which regions are analyzed in the report?
-
APAC, North America, Europe, South America, and Middle East and Africa
-
-
What are the key growth drivers and market challenges?
-
Increasing demand for high bandwidth and lightweight materials, OEMs skeptical about adopting ethernet in vehicles
-
-
Who are the major players in the Automotive Ethernet Market?
-
Key Companies ACTIA PCS, Amphenol Communications Solutions, Broadcom Inc., Cadence Design Systems Inc., Dasan Network Solutions, Infineon Technologies AG, Intrepid Control Systems Inc., Keysight Technologies Inc., Marvell Technology Inc., Microchip Technology Inc., Mouser Electronics Inc., NEXCOM International Co. Ltd., NXP Semiconductors NV, Realtek Semiconductor Corp., Rohde and Schwarz GmbH and Co. KG, Spirent Communications Plc, System on Chip Engineering S.L., TE Connectivity Ltd., Tektronix Inc., and Texas Instruments Inc.
-
Market Research Insights
- The market continues to evolve, driven by the increasing demand for advanced driver assistance systems (ADAS) and connected vehicles. According to industry estimates, the market is projected to reach USD12.5 billion by 2026, growing at a compound annual growth rate (CAGR) of 23.5%. Network reliability metrics, such as TCP/IP performance and signal-to-noise ratio, are critical considerations in the market. For instance, a leading automaker implements MAC layer protocols and hardware acceleration units to ensure reliable data transfer, achieving a network latency of 10 milliseconds. In contrast, a competitor utilizes error detection methods, such as forward error correction and intrusion detection systems, to minimize packet loss and network congestion, resulting in a latency of 15 milliseconds.
- Automotive Ethernet networks employ various thermal management strategies, message queuing systems, and network monitoring tools to maintain optimal performance. Additionally, secure boot processes, data encryption algorithms, and authentication protocols ensure data security. Power consumption metrics and network resilience strategies are essential for extending battery life and ensuring network reliability in electric vehicles. Data packet sizes and IP protocol version also impact network performance and require careful consideration.
We can help! Our analysts can customize this automotive ethernet market research report to meet your requirements.
 RIA -
RIA - 
