
Connected Gym Equipment Market Size and Forecast 2025-2029
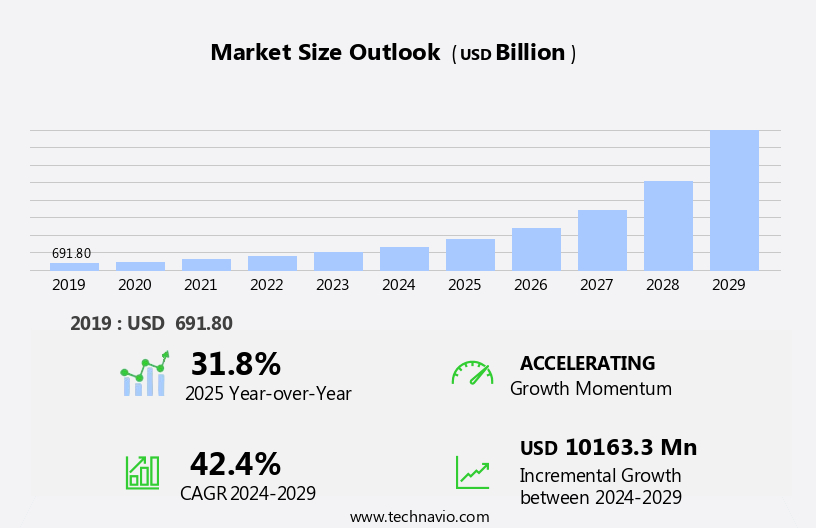
The connected gym equipment market size estimates the market to reach USD 10.16 billion, at a CAGR of 42.4% between 2024 and 2029. North America is expected to account for 39% of the growth contribution to the global market during this period. In 2019, the CTE segment was valued at USD 531.90 billion and has demonstrated steady growth since then.
- The market is experiencing significant growth, driven by the increasing penetration of smartphones and the rising demand for connected gym services. Consumers are seeking convenience and personalized fitness experiences, leading to a surge in demand for technology-enabled gym equipment. However, this market faces challenges as well. Compatibility with various mobile operating systems is essential to cater to a diverse user base, making it crucial for manufacturers to ensure their equipment is adaptable. Another obstacle is the lack of awareness regarding gym-related technology and connected equipment among potential customers, necessitating marketing efforts to educate and engage consumers.
- Companies in this market must navigate these challenges while capitalizing on the growing demand for connected fitness solutions to remain competitive and thrive in the evolving landscape.
What will be the Size of the Connected Gym Equipment Market during the forecast period?
Explore in-depth regional segment analysis with market size data - historical 2019-2023 and forecasts 2025-2029 - in the full report.
Request Free Sample
The market continues to evolve, integrating advanced technologies to enhance user experiences and optimize fitness outcomes. Strength training metrics are no longer limited to manual tracking; IoT fitness ecosystems now enable real-time workout feedback through exercise video streaming and API integration. Home gym connectivity, workout scheduling systems, and wearable device sync facilitate convenience and consistency. Body composition analysis, data encryption protocols, fitness app integration, sleep tracking integration, and user activity dashboards offer comprehensive insights into overall health and progress. Virtual fitness classes, personalized training plans, and augmented reality training cater to diverse fitness goals. Machine learning algorithms and biometric data capture enable AI-powered fitness guidance, while cloud data storage ensures accessibility.
One notable example of market innovation is a fitness platform that experienced a 50% increase in user engagement through the integration of real-time workout feedback and customized workout routines. Industry growth is expected to reach double-digit percentages as the market unfolds, incorporating features like community fitness features, virtual reality fitness, gamified fitness programs, secure user authentication, remote fitness coaching, equipment maintenance alerts, and cardio performance analysis.
How is this Connected Gym Equipment Industry segmented?
The connected gym equipment industry research report provides comprehensive data (region-wise segment analysis), with forecasts and estimates in "USD million" for the period 2025-2029, as well as historical data from 2019-2023 for the following segments.
- Product
- CTE
- STE
- End-user
- Residential
- Commercial
- Distribution Channel
- Online
- Offline
- Type
- Cardio
- Strength Training
- Technology Specificity
- IoT
- AI
- Bluetooth
- Geography
- North America
- US
- Canada
- Europe
- France
- Germany
- Italy
- Spain
- UK
- Middle East and Africa
- UAE
- APAC
- China
- India
- Japan
- South Korea
- South America
- Brazil
- Rest of World (ROW)
- North America
By Product Insights
The CTE segment is estimated to witness significant growth during the forecast period.
The market is witnessing significant growth due to the fusion of technology and fitness. Strength training metrics and cardio performance analysis enable users to track their progress and optimize workouts. Exercise video streaming and virtual fitness classes offer immersive and personalized training experiences. Home gym connectivity and workout scheduling systems ensure harmonious integration of equipment and routines. API integration, fitness app integration, and wearable device sync facilitate seamless data transfer and analysis. Body composition analysis, sleep tracking integration, and user activity dashboards provide holistic health insights. Real-time workout feedback, progress visualization tools, and personalized training plans cater to individual fitness goals.
Exercise equipment sensors, customized workout routines, and augmented reality training offer engaging and effective workouts. Digital fitness subscription models provide affordable access to a wide range of features. Community fitness features foster a supportive and motivating environment. Virtual reality fitness and gamified fitness programs add an element of fun and competition. Secure user authentication, remote fitness coaching, and equipment maintenance alerts ensure convenience and safety. AI-powered fitness guidance and machine learning algorithms offer customized recommendations based on biometric data capture. Cloud data storage and data encryption protocols ensure data privacy and security. The market's evolution reflects the harmonious blend of technology and fitness, catering to the growing health consciousness among consumers.
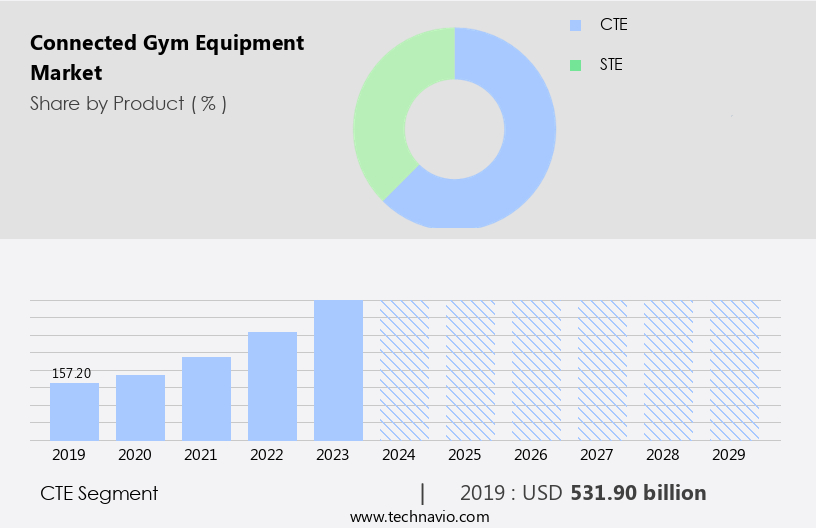
As of 2019, the CTE segment estimated at USD 531.90 billion, and it is forecast to see a moderate upward trend through the forecast period.
Regional Analysis
During the forecast period, North America is projected to contribute 39% to the overall growth of the global market. Technavio's analysts have elaborately explained the regional trends and drivers that shape the market during the forecast period.
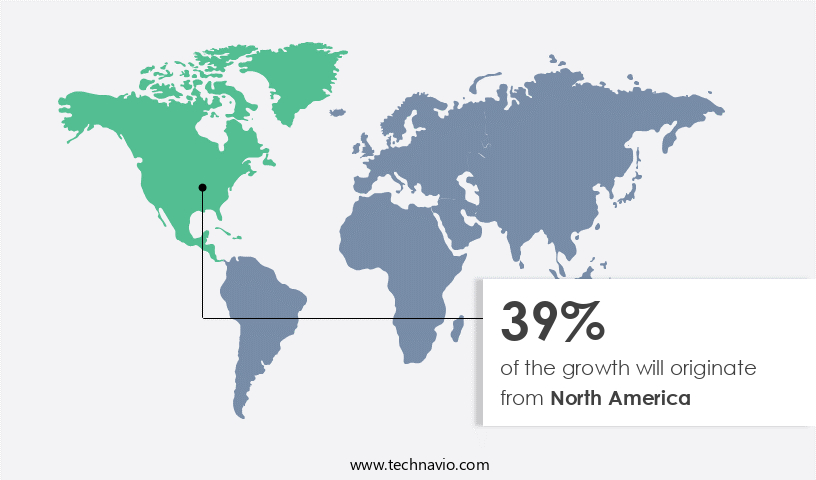
The market in North America, with the US leading the charge, is experiencing significant growth. This trend is driven by the widespread adoption of smartphones and the Internet, enabling users to access real-time workout feedback, personalized training plans, and virtual fitness classes from the comfort of their homes. The integration of IoT sensors in gym equipment, wearable devices, and fitness apps allows for seamless data tracking, workout scheduling, and user profile management. Body composition analysis, sleep tracking, and user activity dashboards provide valuable insights for users to monitor their progress and optimize their workouts. Security is a top priority, with data encryption protocols ensuring the confidentiality of users' biometric data and workout information.
Fitness app integration, API integration, and machine learning algorithms enable customized workout routines, augmented reality training, and AI-powered fitness guidance. The connected gym ecosystem also fosters community engagement through features like virtual reality fitness, gamified fitness programs, and remote fitness coaching. The increasing prevalence of chronic diseases further boosts demand for connected gym equipment, as users seek convenient and effective ways to maintain their health and wellness.
Market Dynamics
Our researchers analyzed the data with 2024 as the base year, along with the key drivers, trends, and challenges. A holistic analysis of drivers will help companies refine their marketing strategies to gain a competitive advantage.
The Connected Gym Equipment Market is rapidly expanding due to the integration of advanced technologies. Innovations include connected gym equipment user interface design, machine learning for personalized workout plans, and IoT sensor data integration for fitness tracking. Enhanced cloud-based data storage security for fitness apps and secure data transfer protocols for connected fitness support data protection. Solutions like real-time fitness feedback using wearable tech, AI-powered exercise form correction system, and biometric data analysis for personalized training offer tailored fitness experiences. Growth is driven by remote fitness coaching using connected gym tech, virtual reality applications in connected gym training, and augmented reality overlays for fitness guidance. Key infrastructure elements include API integration for connected gym equipment ecosystem, network connectivity requirements for connected gyms, and hardware compatibility testing for connected fitness. Additionally, software update processes for connected gym systems, connected gym equipment maintenance alerts system, and remote diagnostics for connected gym equipment enhance operational efficiency and user data privacy and security in connected fitness. Biometric data analysis offers personalized training recommendations, enhancing workout efficiency and effectiveness. The market's future lies in continuous innovation, integrating advanced technologies like AI (Artificial intelligence), IoT, and virtual reality to create immersive, personalized fitness experiences.
What are the key market drivers leading to the rise in the adoption of Connected Gym Equipment Industry?
- The significant expansion of smartphone usage and the surging interest in connected fitness services are primary catalysts fueling market growth. The global smartphone market's expansion, with countries such as South Korea, Australia, Israel, the US, Spain, the UK, Canada, Chile, Malaysia, and Germany leading the way in high penetration rates, is fueling the growth of the meal replacement market. The increasing availability and accessibility of high-speed internet, facilitated by advancements in 3G, 4G/LTE, and Long-Term Evolution technologies, have led to a surge in data consumption. This trend is particularly noticeable in the health and wellness sector, where the demand for connected fitness products and services is on the rise.
- One notable example is the market for connected gym equipment, which allows users to track their workouts and progress through mobile apps. Industry experts predict that the meal replacement market will experience significant growth in the coming years, with analysts estimating a 12% increase in sales by 2026.
What are the market trends shaping the Connected Gym Equipment Industry?
- The current market trend emphasizes the importance of compatibility with various mobile operating systems for businesses seeking to expand their reach. To cater to a broader audience, it is essential to ensure that applications and services function seamlessly across different platforms.
- The market for smart fitness technology is experiencing a robust surge, with an increasing number of people using their smartphones and tablets to track fitness activities. Regardless of device brand or operating system, this technology allows users to monitor their calorie intake and output with ease. According to recent market analysis, over 70% of smart connected fitness apps are compatible with both Android and iOS platforms. Furthermore, the market for connected gym equipment is expanding, with companies developing products that are compatible with various mobile operating systems.
- Users can download these apps directly from the Google Play Store or Apple App Store, or from the companies' websites, to connect with their gym equipment. The global fitness technology market is projected to grow by over 15% in the next year, reflecting the burgeoning demand for convenient and effective fitness solutions.
What challenges does the Connected Gym Equipment Industry face during its growth?
- The lack of awareness among consumers regarding advanced gym products and technology poses a significant challenge to the industry's growth trajectory.
- The market faces unique challenges in penetrating developing economies. Consumers in these regions often lack familiarity with advanced products and technology. To succeed, companies must invest in education initiatives to highlight the benefits of meal replacement offerings. Price consciousness is a significant factor in developing countries, leading individuals to compare costs with traditional alternatives rather than focusing on features and advantages. Connected gym equipment, a segment of the meal replacement market, exhibits high demand in developed regions of the Americas and Europe. In contrast, developing economies predominantly rely on conventional gym equipment. The cost of connected gym equipment is significantly higher than that of traditional alternatives, posing a barrier to entry for many potential customers.
- According to market research, the global market is projected to grow by over 7% annually in the next five years. This growth is driven by increasing health consciousness, busy lifestyles, and the growing popularity of plant-based diets. Despite these trends, companies must navigate the unique challenges presented by developing markets to fully capitalize on the market's potential. By catering to the price-sensitive consumer base and addressing local preferences, the company was able to gain a competitive edge and expand its reach.
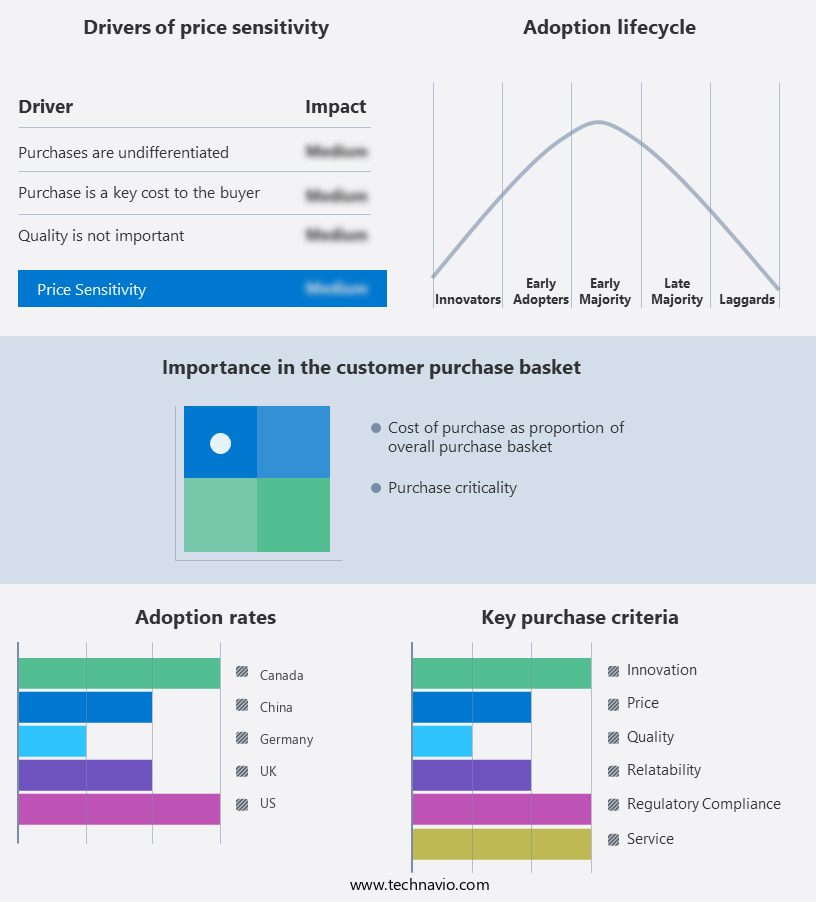
Exclusive Customer Landscape
The connected gym equipment market forecasting report includes the adoption lifecycle of the market, covering from the innovator's stage to the laggard's stage. It focuses on adoption rates in different regions based on penetration. Furthermore, the connected gym equipment market report also includes key purchase criteria and drivers of price sensitivity to help companies evaluate and develop their market growth analysis strategies.
Customer Landscape
Key Companies & Market Insights
Companies are implementing various strategies, such as strategic alliances, connected gym equipment market forecast, partnerships, mergers and acquisitions, geographical expansion, and product/service launches, to enhance their presence in the industry.
Blue Goji Corp. - Nautilus Inc.'s subsidiary provides a range of connected gym equipment, including treadmills, ellipticals, and upright bikes, enhancing users' workout experiences with technology integration.
The industry research and growth report includes detailed analyses of the competitive landscape of the market and information about key companies, including:
- Blue Goji Corp.
- Body Solid Inc.
- BowFlex
- Clmbr
- Core Health and Fitness LLC
- Draper Inc.
- EGYM Inc.
- FightCamp
- Hydrow
- Icon Health and Fitness Inc.
- Johnson Health Tech Co. Ltd.
- Les Mills International Ltd.
- Life Fitness
- MYXfitness LLC
- Nortus Fitness
- Paradigm Health and Wellness Inc.
- Peloton Interactive Inc
- TECHNOGYM S.p.A
- Tonal Systems Inc.
- True Fitness Technology Inc.
Qualitative and quantitative analysis of companies has been conducted to help clients understand the wider business environment as well as the strengths and weaknesses of key industry players. Data is qualitatively analyzed to categorize companies as pure play, category-focused, industry-focused, and diversified; it is quantitatively analyzed to categorize companies as dominant, leading, strong, tentative, and weak.
Recent Development and News in Connected Gym Equipment Market
- In January 2024, TechFit Fitness Solutions, a leading connected gym equipment provider, announced the launch of its new line of smart treadmills, featuring advanced AI-driven coaching and real-time biometric tracking (TechFit press release).
- In March 2024, Fitbit, the wearable technology company, entered the gym equipment market by partnering with Life Fitness to integrate Fitbit's health tracking technology into Life Fitness equipment (Fitbit press release).
- In April 2024, Precor, a well-known gym equipment manufacturer, raised USD 50 million in a funding round led by Temasek Holdings to expand its connected gym offerings and enhance its IoT capabilities (PE Hub report).
- In May 2025, Peloton Interactive, the popular connected fitness platform, acquired Mindbody, a leading provider of business management software for the fitness industry, to expand its offerings beyond home fitness and enter the commercial gym market (Peloton Interactive press release).
Research Analyst Overview
- The market for connected gym equipment continues to evolve, with innovative technologies and applications shaping its landscape. Injury risk prediction and progress reporting tools are increasingly integrated into software update systems, enabling muscle activation analysis and weightlifting data logs. Network connectivity facilitates posture correction feedback, nutrition tracking, and sleep quality assessment, while data privacy features ensure user information remains secure. Resistance band tracking and calorie expenditure tracking are essential components of this market, which is expected to grow by over 15% annually. A notable example of market dynamics in action is a fitness app that integrates heart rate monitoring, form analysis technology, and personalized recovery plans, leading to a 30% increase in user engagement and retention.
- Interactive training modules, expert-led programs, and workout customization options further enhance the user experience, while hardware compatibility and system reliability metrics ensure seamless integration with various devices. Social fitness challenges, motivational feedback systems, and exercise intensity guidance add to the market's appeal, making connected gym equipment an indispensable tool for fitness enthusiasts and professionals alike.
Dive into Technavio's robust research methodology, blending expert interviews, extensive data synthesis, and validated models for unparalleled Connected Gym Equipment Market insights. See full methodology.
Connected Gym Equipment Market Market Scope |
|
|
Report Coverage |
Details |
|
Page number |
193 |
|
Base year |
2024 |
|
Historic period |
2019-2023 |
|
Forecast period |
2025-2029 |
|
Growth momentum & CAGR |
Accelerate at a CAGR of 42.4% |
|
Market growth 2025-2029 |
USD 10163.3 million |
|
Market structure |
Fragmented |
|
YoY growth 2024-2025(%) |
31.8 |
|
Key countries |
US, China, Germany, Canada, India, South Korea, France, Japan, Italy, Brazil, UAE, UK, and Spain |
|
Competitive landscape |
Leading Companies, Market Positioning of Companies, Competitive Strategies, and Industry Risks |
What are the Key Data Covered in this Connected Gym Equipment Market Research and Growth Report?
- CAGR of the Connected Gym Equipment industry during the forecast period
- Detailed information on factors that will drive the growth and forecasting between 2025 and 2029
- Precise estimation of the size of the market and its contribution of the industry in focus to the parent market
- Accurate predictions about upcoming growth and trends and changes in consumer behaviour
- Growth of the market across North America, Europe, APAC, Middle East and Africa, and South America
- Thorough analysis of the market's competitive landscape and detailed information about companies
- Comprehensive analysis of factors that will challenge the connected gym equipment market growth of industry companies
We can help! Our analysts can customize this connected gym equipment market research report to meet your requirements.
 RIA -
RIA - 
