Construction Safety Helmets Market Analysis, Size, and Forecast 2026-2030: APAC (China, Japan, and India), North America (US, Canada, and Mexico), Europe (Germany, UK, and France), Middle East and Africa (South Africa, Saudi Arabia, and UAE), South America (Brazil, Argentina, and Colombia), and Rest of World (ROW)

Construction Safety Helmets Market Analysis, Size, and Forecast 2026-2030:
APAC (China, Japan, and India), North America (US, Canada, and Mexico), Europe (Germany, UK, and France), Middle East and Africa (South Africa, Saudi Arabia, and UAE), South America (Brazil, Argentina, and Colombia), and Rest of World (ROW)

Published: Dec 2025 302 Pages SKU: IRTNTR44391

Market Overview at a Glance

$744.6 Mn
Market Opportunity
6.6%
CAGR 2025 - 2030
50.6%
APAC Growth
$500.8 Mn
HDPE segment 2024

Construction Safety Helmets Market Size 2026-2030

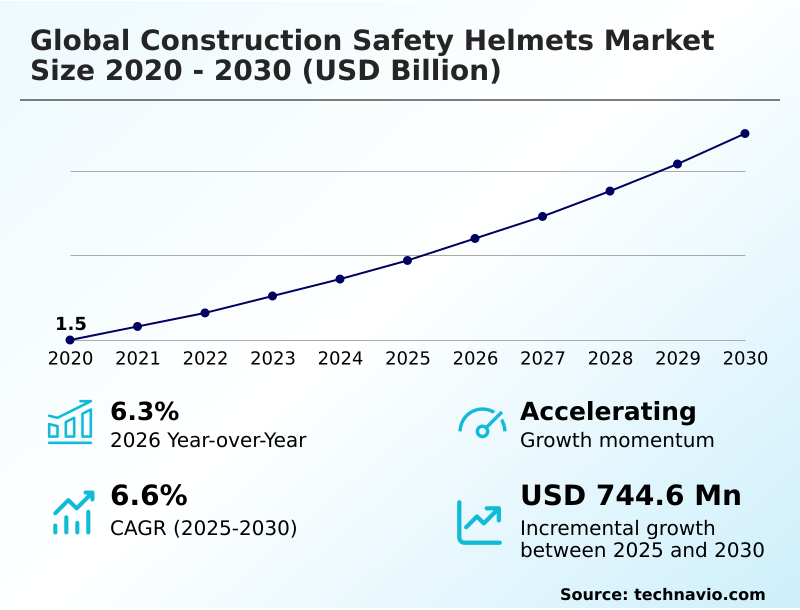
The construction safety helmets market size is valued to increase by USD 744.6 million, at a CAGR of 6.6% from 2025 to 2030. Growth in construction industry and infrastructure development will drive the construction safety helmets market.

Major Market Trends & Insights

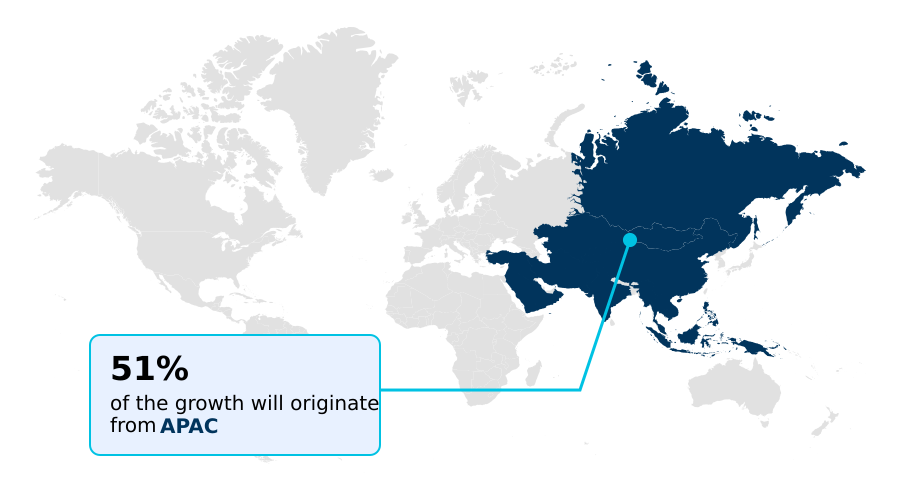
  • APAC dominated the market and accounted for a 50.6% growth during the forecast period.
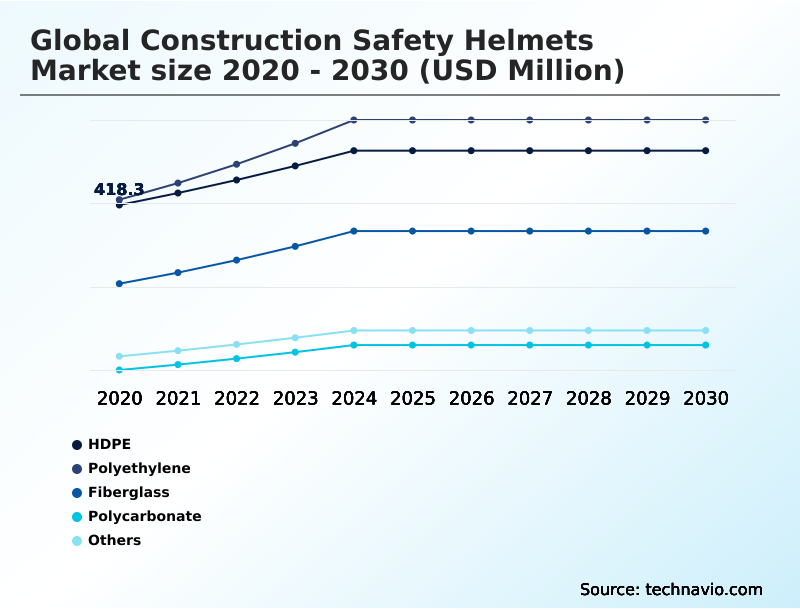
  • By Material - HDPE segment was valued at USD 500.8 million in 2024
  • By Product Type - Hard hats segment accounted for the largest market revenue share in 2024

Market Size & Forecast

  • Market Opportunities: USD 1.22 billion
  • Market Future Opportunities: USD 744.6 million
  • CAGR from 2025 to 2030 : 6.6%

Market Summary

  • The construction safety helmets market is characterized by a persistent focus on enhancing occupational head injury prevention through material innovation and technological integration. The demand is driven by stringent construction site safety protocols and a growing awareness of worker well-being, which has shifted purchasing criteria beyond basic compliance.
  • Innovations in advanced polymer composites and fiberglass composite helmets are producing industrial safety headgear that is both lighter and stronger, improving user-centric helmet design and wearability. A significant trend is the evolution from passive protection to proactive hazard mitigation via connected PPE technology.
  • For instance, a complex urban infrastructure project might deploy smart helmets equipped with environmental condition monitoring and real-time incident alerts, allowing site managers to perform data-driven safety management and dynamically re-route personnel away from detected hazards, thereby optimizing operational safety and minimizing downtime.
  • This shift toward integrated safety solutions is reshaping product development, with a focus on modularity and advanced shock absorption to meet the demands of an increasingly complex and safety-conscious industry.

What will be the Size of the Construction Safety Helmets Market during the forecast period?

Get Key Insights on Market Forecast (PDF) Request Free Sample

How is the Construction Safety Helmets Market Segmented?

The construction safety helmets industry research report provides comprehensive data (region-wise segment analysis), with forecasts and estimates in "USD million" for the period 2026-2030, as well as historical data from 2020-2024 for the following segments.

  • Material
    • Polyethylene
    • HDPE
    • Fiberglass
    • Polycarbonate
    • Others
  • Product type
    • Hard hats
    • Bump caps
  • End-user
    • Oil and gas
    • Energy and power
    • Automotive
    • Others
  • Geography
    • APAC
      • China
      • Japan
      • India
    • North America
      • US
      • Canada
      • Mexico
    • Europe
      • Germany
      • UK
      • France
    • Middle East and Africa
      • South Africa
      • Saudi Arabia
      • UAE
    • South America
      • Brazil
      • Argentina
      • Colombia
    • Rest of World (ROW)

By Material Insights

The polyethylene segment is estimated to witness significant growth during the forecast period.

The polyethylene segment is foundational to the construction safety helmets market, valued for its cost-effectiveness and reliable performance in general construction applications.

Helmets made from high-density polyethylene (hdpe) provide a strong balance of mechanical strength and impact resistance, meeting core construction site safety protocols.

Manufacturers leverage efficient production processes for this personal protective equipment (ppe), making it accessible for projects of all scales.

These helmets offer robust construction worker head protection and are designed with features like an adjustable suspension system design and options for chin strap integration. The material's adaptability also allows for high-visibility color coding.

Innovations are focused on improving the strength-to-weight ratio and uv degradation resistance, with firms reporting that enhanced ergonomic helmet fit systems can improve worker compliance by over 15%.

Request Free Sample

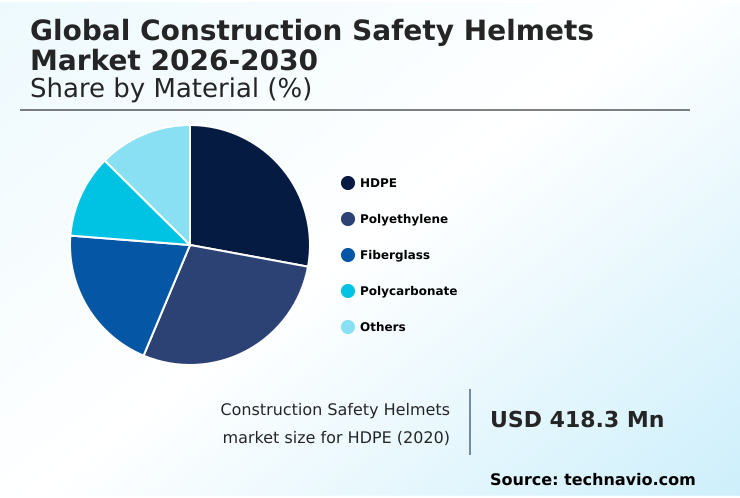
The Polyethylene segment was valued at USD 500.8 million in 2024 and showed a gradual increase during the forecast period.

Request Free Sample

Regional Analysis

APAC is estimated to contribute 50.6% to the growth of the global market during the forecast period.Technavio’s analysts have elaborately explained the regional trends and drivers that shape the market during the forecast period.

See How Construction Safety Helmets Market Demand is Rising in APAC Request Free Sample

The geographic landscape of the market is characterized by distinct regional dynamics. The APAC region is the most significant contributor to incremental growth, accounting for over 50% of the market opportunity, driven by massive infrastructure projects.

In contrast, North America and Europe, which together represent over 33% of the opportunity, are mature regions where demand is driven by technology upgrades and adherence to strict personal protective equipment (ppe) standards.

These regions show a high adoption rate for specialized equipment like electrical hazard rated helmets and products featuring advanced shock absorption. There's a strong focus on lightweight safety helmet design to improve worker comfort.

The adoption of energy-absorbing foam liners in these mature markets has been linked to a reduction in the severity of reported head impacts by a notable margin.

Market Dynamics

Our researchers analyzed the data with 2025 as the base year, along with the key drivers, trends, and challenges. A holistic analysis of drivers will help companies refine their marketing strategies to gain a competitive advantage.

  • The strategic decision-making process for procuring head protection involves a complex evaluation beyond simple compliance. A critical aspect is comparing hdpe vs fiberglass helmets, where durability and heat resistance are weighed against cost and weight. Simultaneously, the benefits of smart helmets in construction are becoming undeniable, with smart helmet data for site safety analysis enabling proactive risk management.
  • Organizations are performing a detailed cost-benefit analysis of advanced safety helmets to justify investment in features that enhance worker safety and efficiency. This includes choosing the best hard hats for high-heat environments and ensuring rotational impact protection for construction workers, which is crucial for mitigating severe injury.
  • The challenges of smart helmet adoption are being addressed through comprehensive training programs for proper helmet use, which have proven to reduce non-compliance incidents by more than 40% compared to sites without such programs. Key considerations include selecting helmets based on safety helmet standards for electrical work and understanding the differences between ansi type ii vs type i helmets.
  • The push for improving worker compliance with comfortable ppe is driving innovation in advanced suspension systems for hard hats and addressing the impact of helmet weight on worker fatigue. These efforts are pivotal in reducing head injuries on construction sites and demonstrate a commitment to worker well-being and operational excellence.
  • The focus on sustainable materials in safety helmet production is also a growing factor in procurement decisions.

What are the key market drivers leading to the rise in the adoption of Construction Safety Helmets Industry?

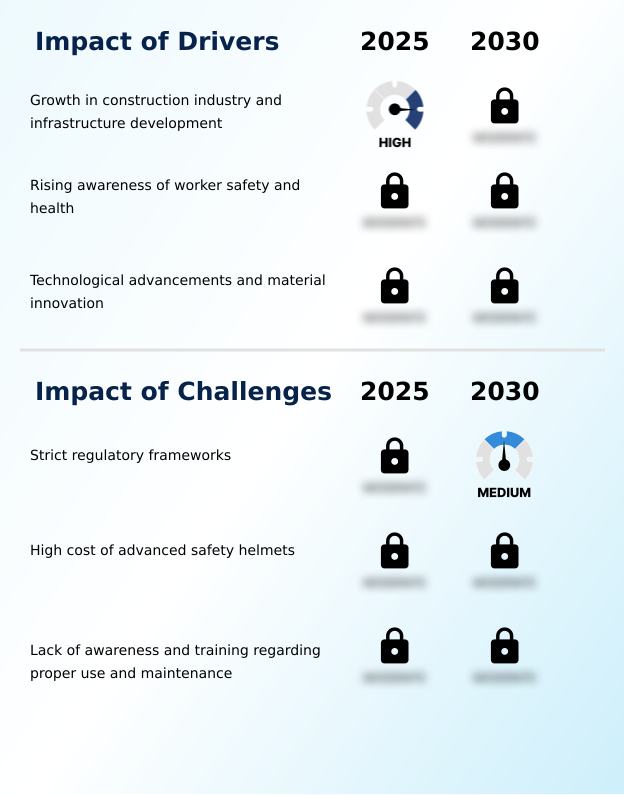
  • The primary market driver is the continuous growth in the global construction industry, fueled by significant investments in large-scale infrastructure development projects worldwide.

  • The market is primarily propelled by the need for enhanced construction worker head protection and stringent regulatory standards such as ansi/isea z89.1 compliance.
  • Growth in global construction is creating sustained demand for industrial safety headgear, with a focus on occupational head injury prevention.
  • Technological advancements in lightweight safety helmet design, featuring improved ratcheting mechanisms and ventilated hard hat comfort, are driving adoption as they directly address worker fatigue.
  • Companies that upgrade to helmets with superior suspension system design have noted a decrease in worker complaints related to discomfort by over 30%.
  • Furthermore, the demand for high-performance fiber shells and task-specific head protection for specialized roles, such as those requiring an electrical insulation class rating, expands the market.
  • The availability of helmets with full-brim coverage is another key factor, improving adoption rates by 10% in sun-exposed regions.

What are the market trends shaping the Construction Safety Helmets Industry?

  • The integration of smart technology is a transformative trend, evolving traditional safety helmets into sophisticated devices for real-time monitoring and proactive hazard mitigation on worksites.

  • Market evolution is heavily influenced by the push for sustainable PPE manufacturing and the adoption of connected ppe technology. Innovations in advanced hard hat materials now include recycled content helmets and experiments with bio-based polymer materials, aligning with corporate circular economy principles.
  • This user-centric design approach is complemented by the integration of smart helmet sensors and impact detection accelerometers, which enable proactive hazard mitigation. Firms deploying these technologies report a 25% improvement in incident response times. Concurrently, the development of helmets with integrated eye protection and anti-fog visor technology enhances functionality.
  • These trends are moving the industry toward integrated safety solutions, where a helmet serves as a central hub for worker safety monitoring, with some systems demonstrating a 15% reduction in minor on-site incidents.

What challenges does the Construction Safety Helmets Industry face during its growth?

  • Strict and fragmented regulatory frameworks present a key challenge, potentially slowing innovation and market entry for new product designs and technologies.

  • A significant challenge stems from complex regulatory pathways, where achieving en 397 certification or csa z94.1 standard for new products, like those with advanced polymer composites or a unique brimless helmet design, can be a lengthy process. The high cost of specialized industrial helmets incorporating mips technology or carbon fiber reinforced polymers presents another barrier, particularly for smaller firms.
  • While these offer superior rotational impact protection, their adoption is slower, impacting the broad implementation of advanced safety measures. For example, the development cycle for helmets with integrated hands-free communication modules can be extended by up to 18 months due to electronic component certification.
  • This delay can impede the rollout of technologies aimed at improving enhanced situational awareness and proactive safety management on job sites.

Exclusive Technavio Analysis on Customer Landscape

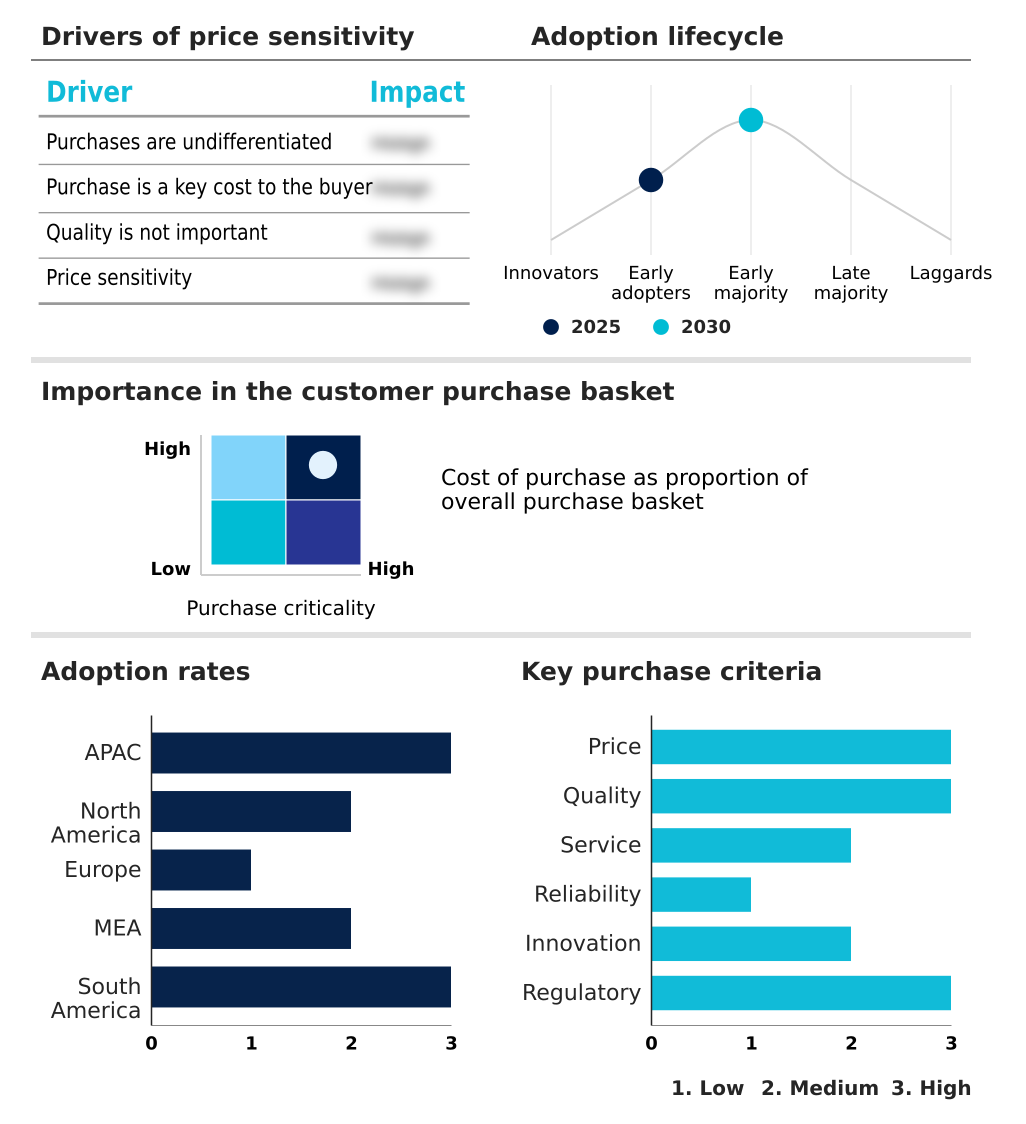
The construction safety helmets market forecasting report includes the adoption lifecycle of the market, covering from the innovator’s stage to the laggard’s stage. It focuses on adoption rates in different regions based on penetration. Furthermore, the construction safety helmets market report also includes key purchase criteria and drivers of price sensitivity to help companies evaluate and develop their market growth analysis strategies.

Customer Landscape of Construction Safety Helmets Industry

Competitive Landscape

Companies are implementing various strategies, such as strategic alliances, construction safety helmets market forecast, partnerships, mergers and acquisitions, geographical expansion, and product/service launches, to enhance their presence in the industry.

3M Co. - Key offerings include certified construction safety helmets, from standard HDPE models to advanced composites with integrated smart technology and modular helmet accessories for enhanced protection.

The industry research and growth report includes detailed analyses of the competitive landscape of the market and information about key companies, including:

  • 3M Co.
  • Anbu Safety Industrial Co. Ltd.
  • Bullard
  • Centurion Safety Products Ltd.
  • Concord Safety Products LLC
  • Delta Plus Group SA
  • Dragerwerk AG and Co. KGaA
  • Durasafety Materials Co. Ltd.
  • Ergodyne
  • Globus Shetland Ltd.
  • Honeywell International Inc.
  • KARAM Group
  • KASK Spa
  • MSA Safety Inc.
  • OccuNomix International
  • PETZL Distribution
  • Polison Corp.
  • Pyramex Safety Products LLC
  • Schuberth GmbH
  • UVEX GmbH and Co. KG

Qualitative and quantitative analysis of companies has been conducted to help clients understand the wider business environment as well as the strengths and weaknesses of key industry players. Data is qualitatively analyzed to categorize companies as pure play, category-focused, industry-focused, and diversified; it is quantitatively analyzed to categorize companies as dominant, leading, strong, tentative, and weak.

Recent Development and News in Construction safety helmets market

  • In September, 2024, Honeywell International Inc. launched a new line of connected safety helmets featuring integrated real-time gas detection sensors and fall detection accelerometers, targeting high-risk industrial construction environments.
  • In November, 2024, 3M Co. announced a strategic partnership with a leading polymer recycling firm to develop and scale production of construction safety helmets made from 100% certified post-consumer recycled HDPE, aiming to establish a circular economy model for PPE.
  • In February, 2025, MSA Safety Inc. acquired a prominent software startup specializing in AI-powered worksite safety analytics, planning to integrate the platform with its V-Gard series of smart helmets to offer predictive hazard alerts.
  • In April, 2025, Bullard, in collaboration with several major construction industry associations, launched a global virtual reality (VR) training module designed to educate workers on the proper fit, inspection, and maintenance of safety helmets.

Dive into Technavio’s robust research methodology, blending expert interviews, extensive data synthesis, and validated models for unparalleled Construction Safety Helmets Market insights. See full methodology.

Market Scope
Page number 302
Base year 2025
Historic period 2020-2024
Forecast period 2026-2030
Growth momentum & CAGR Accelerate at a CAGR of 6.6%
Market growth 2026-2030 USD 744.6 million
Market structure Fragmented
YoY growth 2025-2026(%) 6.3%
Key countries China, Japan, India, South Korea, Australia, Indonesia, US, Canada, Mexico, Germany, UK, France, Spain, Italy, The Netherlands, South Africa, Saudi Arabia, UAE, Nigeria, Turkey, Brazil, Argentina and Colombia
Competitive landscape Leading Companies, Market Positioning of Companies, Competitive Strategies, and Industry Risks

Request Free Sample

Research Analyst Overview

  • The construction safety helmets market is evolving beyond basic impact resistance standards, with a decisive shift toward holistic protection and data integration. Boardroom decisions are now heavily influenced by the capabilities of advanced head protection, particularly smart helmets.
  • The integration of a smart helmet sensor, impact detection accelerometer, and gps and rfid tracking transforms a passive piece of equipment into an active node for site management. For instance, incorporating hands-free communication modules and mesh network integration directly enhances operational efficiency, with some projects achieving a 15% reduction in coordination-related delays.
  • Material science is also critical, with a move from standard high-density polyethylene (hdpe) to polycarbonate shells, fiberglass composite helmets, and even carbon fiber reinforced polymers. These advanced polymer composites offer superior rotational impact protection, often incorporating mips technology and an expanded polystyrene (eps) liner.
  • Key features now include dielectric properties, flame-retardant properties, uv degradation resistance, and compliance with multiple standards like ansi/isea z89.1, en 397, and csa z94.1, covering both type i and type ii protection.

What are the Key Data Covered in this Construction Safety Helmets Market Research and Growth Report?

  • What is the expected growth of the Construction Safety Helmets Market between 2026 and 2030?

    • USD 744.6 million, at a CAGR of 6.6%

  • What segmentation does the market report cover?

    • The report is segmented by Material (HDPE, Polyethylene, Fiberglass, Polycarbonate, and Others), Product Type (Hard hats, and Bump caps), End-user (Oil and gas, Energy and power, Automotive, and Others) and Geography (APAC, North America, Europe, Middle East and Africa, South America)

  • Which regions are analyzed in the report?

    • APAC, North America, Europe, Middle East and Africa and South America

  • What are the key growth drivers and market challenges?

    • Growth in construction industry and infrastructure development, Strict regulatory frameworks

  • Who are the major players in the Construction Safety Helmets Market?

    • 3M Co., Anbu Safety Industrial Co. Ltd., Bullard, Centurion Safety Products Ltd., Concord Safety Products LLC, Delta Plus Group SA, Dragerwerk AG and Co. KGaA, Durasafety Materials Co. Ltd., Ergodyne, Globus Shetland Ltd., Honeywell International Inc., KARAM Group, KASK Spa, MSA Safety Inc., OccuNomix International, PETZL Distribution, Polison Corp., Pyramex Safety Products LLC, Schuberth GmbH and UVEX GmbH and Co. KG

Market Research Insights

  • The market's dynamism is fueled by a push for integrated safety solutions and enhanced construction worker head protection. The emphasis on an ergonomic helmet fit system has been shown to boost worker compliance by over 20%, directly improving construction site safety protocols.
  • Furthermore, the adoption of connected ppe technology for worker safety monitoring allows for real-time incident alerts and proactive hazard mitigation, with pilot programs reporting up to a 15% reduction in response times for on-site incidents.
  • As the industry moves toward data-driven safety management, manufacturers are focusing on advanced hard hat materials and lightweight safety helmet design to enhance both protection and user acceptance, meeting the evolving demands for both compliance and operational efficiency.

We can help! Our analysts can customize this construction safety helmets market research report to meet your requirements.

Get in touch

1. Executive Summary

1.1 Market overview

Executive Summary - Chart on Market Overview
Executive Summary - Data Table on Market Overview
Executive Summary - Chart on Global Market Characteristics
Executive Summary - Chart on Market by Geography
Executive Summary - Chart on Market Segmentation by Material
Executive Summary - Chart on Market Segmentation by Product Type
Executive Summary - Chart on Market Segmentation by End-user
Executive Summary - Chart on Incremental Growth
Executive Summary - Data Table on Incremental Growth
Executive Summary - Chart on Company Market Positioning

2. Technavio Analysis

2.1 Analysis of price sensitivity, lifecycle, customer purchase basket, adoption rates, and purchase criteria

2.2 Criticality of inputs and Factors of differentiation

Chart on Overview on criticality of inputs and factors of differentiation

2.3 Factors of disruption

Chart on Overview on factors of disruption

2.4 Impact of drivers and challenges

Chart on Impact of drivers and challenges in 2025 and 2030

3. Market Landscape

3.1 Market ecosystem

Chart on Parent Market
Data Table on - Parent Market

3.2 Market characteristics

Chart on Market characteristics analysis

3.3 Value chain analysis

Chart on Value chain analysis

4. Market Sizing

4.1 Market definition

Data Table on Offerings of companies included in the market definition

4.2 Market segment analysis

Market segments

4.3 Market size 2025

4.4 Market outlook: Forecast for 2025-2030

Chart on Global - Market size and forecast 2025-2030 ($ million)
Data Table on Global - Market size and forecast 2025-2030 ($ million)
Chart on Global Market: Year-over-year growth 2025-2030 (%)
Data Table on Global Market: Year-over-year growth 2025-2030 (%)

5. Historic Market Size

5.1 Global Construction Safety Helmets Market 2020 - 2024

Historic Market Size - Data Table on Global Construction Safety Helmets Market 2020 - 2024 ($ million)

5.2 Material segment analysis 2020 - 2024

Historic Market Size - Material Segment 2020 - 2024 ($ million)

5.3 Product Type segment analysis 2020 - 2024

Historic Market Size - Product Type Segment 2020 - 2024 ($ million)

5.4 End-user segment analysis 2020 - 2024

Historic Market Size - End-user Segment 2020 - 2024 ($ million)

5.5 Geography segment analysis 2020 - 2024

Historic Market Size - Geography Segment 2020 - 2024 ($ million)

5.6 Country segment analysis 2020 - 2024

Historic Market Size - Country Segment 2020 - 2024 ($ million)

6. Qualitative Analysis

6.1

7. Five Forces Analysis

7.1 Five forces summary

Five forces analysis - Comparison between 2025 and 2030

7.2 Bargaining power of buyers

Bargaining power of buyers - Impact of key factors 2025 and 2030

7.3 Bargaining power of suppliers

Bargaining power of suppliers - Impact of key factors in 2025 and 2030

7.4 Threat of new entrants

Threat of new entrants - Impact of key factors in 2025 and 2030

7.5 Threat of substitutes

Threat of substitutes - Impact of key factors in 2025 and 2030

7.6 Threat of rivalry

Threat of rivalry - Impact of key factors in 2025 and 2030

7.7 Market condition

Chart on Market condition - Five forces 2025 and 2030

8. Market Segmentation by Material

8.1 Market segments

Chart on Material - Market share 2025-2030 (%)
Data Table on Material - Market share 2025-2030 (%)

8.2 Comparison by Material

Chart on Comparison by Material
Data Table on Comparison by Material

8.3 Polyethylene - Market size and forecast 2025-2030

Chart on Polyethylene - Market size and forecast 2025-2030 ($ million)
Data Table on Polyethylene - Market size and forecast 2025-2030 ($ million)
Chart on Polyethylene - Year-over-year growth 2025-2030 (%)
Data Table on Polyethylene - Year-over-year growth 2025-2030 (%)

8.4 HDPE - Market size and forecast 2025-2030

Chart on HDPE - Market size and forecast 2025-2030 ($ million)
Data Table on HDPE - Market size and forecast 2025-2030 ($ million)
Chart on HDPE - Year-over-year growth 2025-2030 (%)
Data Table on HDPE - Year-over-year growth 2025-2030 (%)

8.5 Fiberglass - Market size and forecast 2025-2030

Chart on Fiberglass - Market size and forecast 2025-2030 ($ million)
Data Table on Fiberglass - Market size and forecast 2025-2030 ($ million)
Chart on Fiberglass - Year-over-year growth 2025-2030 (%)
Data Table on Fiberglass - Year-over-year growth 2025-2030 (%)

8.6 Polycarbonate - Market size and forecast 2025-2030

Chart on Polycarbonate - Market size and forecast 2025-2030 ($ million)
Data Table on Polycarbonate - Market size and forecast 2025-2030 ($ million)
Chart on Polycarbonate - Year-over-year growth 2025-2030 (%)
Data Table on Polycarbonate - Year-over-year growth 2025-2030 (%)

8.7 Others - Market size and forecast 2025-2030

Chart on Others - Market size and forecast 2025-2030 ($ million)
Data Table on Others - Market size and forecast 2025-2030 ($ million)
Chart on Others - Year-over-year growth 2025-2030 (%)
Data Table on Others - Year-over-year growth 2025-2030 (%)

8.8 Market opportunity by Material

Market opportunity by Material ($ million)
Data Table on Market opportunity by Material ($ million)

9. Market Segmentation by Product Type

9.1 Market segments

Chart on Product Type - Market share 2025-2030 (%)
Data Table on Product Type - Market share 2025-2030 (%)

9.2 Comparison by Product Type

Chart on Comparison by Product Type
Data Table on Comparison by Product Type

9.3 Hard hats - Market size and forecast 2025-2030

Chart on Hard hats - Market size and forecast 2025-2030 ($ million)
Data Table on Hard hats - Market size and forecast 2025-2030 ($ million)
Chart on Hard hats - Year-over-year growth 2025-2030 (%)
Data Table on Hard hats - Year-over-year growth 2025-2030 (%)

9.4 Bump caps - Market size and forecast 2025-2030

Chart on Bump caps - Market size and forecast 2025-2030 ($ million)
Data Table on Bump caps - Market size and forecast 2025-2030 ($ million)
Chart on Bump caps - Year-over-year growth 2025-2030 (%)
Data Table on Bump caps - Year-over-year growth 2025-2030 (%)

9.5 Market opportunity by Product Type

Market opportunity by Product Type ($ million)
Data Table on Market opportunity by Product Type ($ million)

10. Market Segmentation by End-user

10.1 Market segments

Chart on End-user - Market share 2025-2030 (%)
Data Table on End-user - Market share 2025-2030 (%)

10.2 Comparison by End-user

Chart on Comparison by End-user
Data Table on Comparison by End-user

10.3 Oil and gas - Market size and forecast 2025-2030

Chart on Oil and gas - Market size and forecast 2025-2030 ($ million)
Data Table on Oil and gas - Market size and forecast 2025-2030 ($ million)
Chart on Oil and gas - Year-over-year growth 2025-2030 (%)
Data Table on Oil and gas - Year-over-year growth 2025-2030 (%)

10.4 Energy and power - Market size and forecast 2025-2030

Chart on Energy and power - Market size and forecast 2025-2030 ($ million)
Data Table on Energy and power - Market size and forecast 2025-2030 ($ million)
Chart on Energy and power - Year-over-year growth 2025-2030 (%)
Data Table on Energy and power - Year-over-year growth 2025-2030 (%)

10.5 Automotive - Market size and forecast 2025-2030

Chart on Automotive - Market size and forecast 2025-2030 ($ million)
Data Table on Automotive - Market size and forecast 2025-2030 ($ million)
Chart on Automotive - Year-over-year growth 2025-2030 (%)
Data Table on Automotive - Year-over-year growth 2025-2030 (%)

10.6 Others - Market size and forecast 2025-2030

Chart on Others - Market size and forecast 2025-2030 ($ million)
Data Table on Others - Market size and forecast 2025-2030 ($ million)
Chart on Others - Year-over-year growth 2025-2030 (%)
Data Table on Others - Year-over-year growth 2025-2030 (%)

10.7 Market opportunity by End-user

Market opportunity by End-user ($ million)
Data Table on Market opportunity by End-user ($ million)

11. Customer Landscape

11.1 Customer landscape overview

Analysis of price sensitivity, lifecycle, customer purchase basket, adoption rates, and purchase criteria

12. Geographic Landscape

12.1 Geographic segmentation

Chart on Market share by geography 2025-2030 (%)
Data Table on Market share by geography 2025-2030 (%)

12.2 Geographic comparison

Chart on Geographic comparison
Data Table on Geographic comparison

12.3 APAC - Market size and forecast 2025-2030

Chart on APAC - Market size and forecast 2025-2030 ($ million)
Data Table on APAC - Market size and forecast 2025-2030 ($ million)
Chart on APAC - Year-over-year growth 2025-2030 (%)
Data Table on APAC - Year-over-year growth 2025-2030 (%)
Chart on Regional Comparison - APAC
Data Table on Regional Comparison - APAC

12.3.1 China - Market size and forecast 2025-2030

Chart on China - Market size and forecast 2025-2030 ($ million)
Data Table on China - Market size and forecast 2025-2030 ($ million)
Chart on China - Year-over-year growth 2025-2030 (%)
Data Table on China - Year-over-year growth 2025-2030 (%)

12.3.2 Japan - Market size and forecast 2025-2030

Chart on Japan - Market size and forecast 2025-2030 ($ million)
Data Table on Japan - Market size and forecast 2025-2030 ($ million)
Chart on Japan - Year-over-year growth 2025-2030 (%)
Data Table on Japan - Year-over-year growth 2025-2030 (%)

12.3.3 India - Market size and forecast 2025-2030

Chart on India - Market size and forecast 2025-2030 ($ million)
Data Table on India - Market size and forecast 2025-2030 ($ million)
Chart on India - Year-over-year growth 2025-2030 (%)
Data Table on India - Year-over-year growth 2025-2030 (%)

12.3.4 South Korea - Market size and forecast 2025-2030

Chart on South Korea - Market size and forecast 2025-2030 ($ million)
Data Table on South Korea - Market size and forecast 2025-2030 ($ million)
Chart on South Korea - Year-over-year growth 2025-2030 (%)
Data Table on South Korea - Year-over-year growth 2025-2030 (%)

12.3.5 Australia - Market size and forecast 2025-2030

Chart on Australia - Market size and forecast 2025-2030 ($ million)
Data Table on Australia - Market size and forecast 2025-2030 ($ million)
Chart on Australia - Year-over-year growth 2025-2030 (%)
Data Table on Australia - Year-over-year growth 2025-2030 (%)

12.3.6 Indonesia - Market size and forecast 2025-2030

Chart on Indonesia - Market size and forecast 2025-2030 ($ million)
Data Table on Indonesia - Market size and forecast 2025-2030 ($ million)
Chart on Indonesia - Year-over-year growth 2025-2030 (%)
Data Table on Indonesia - Year-over-year growth 2025-2030 (%)

12.4 North America - Market size and forecast 2025-2030

Chart on North America - Market size and forecast 2025-2030 ($ million)
Data Table on North America - Market size and forecast 2025-2030 ($ million)
Chart on North America - Year-over-year growth 2025-2030 (%)
Data Table on North America - Year-over-year growth 2025-2030 (%)
Chart on Regional Comparison - North America
Data Table on Regional Comparison - North America

12.4.1 US - Market size and forecast 2025-2030

Chart on US - Market size and forecast 2025-2030 ($ million)
Data Table on US - Market size and forecast 2025-2030 ($ million)
Chart on US - Year-over-year growth 2025-2030 (%)
Data Table on US - Year-over-year growth 2025-2030 (%)

12.4.2 Canada - Market size and forecast 2025-2030

Chart on Canada - Market size and forecast 2025-2030 ($ million)
Data Table on Canada - Market size and forecast 2025-2030 ($ million)
Chart on Canada - Year-over-year growth 2025-2030 (%)
Data Table on Canada - Year-over-year growth 2025-2030 (%)

12.4.3 Mexico - Market size and forecast 2025-2030

Chart on Mexico - Market size and forecast 2025-2030 ($ million)
Data Table on Mexico - Market size and forecast 2025-2030 ($ million)
Chart on Mexico - Year-over-year growth 2025-2030 (%)
Data Table on Mexico - Year-over-year growth 2025-2030 (%)

12.5 Europe - Market size and forecast 2025-2030

Chart on Europe - Market size and forecast 2025-2030 ($ million)
Data Table on Europe - Market size and forecast 2025-2030 ($ million)
Chart on Europe - Year-over-year growth 2025-2030 (%)
Data Table on Europe - Year-over-year growth 2025-2030 (%)
Chart on Regional Comparison - Europe
Data Table on Regional Comparison - Europe

12.5.1 Germany - Market size and forecast 2025-2030

Chart on Germany - Market size and forecast 2025-2030 ($ million)
Data Table on Germany - Market size and forecast 2025-2030 ($ million)
Chart on Germany - Year-over-year growth 2025-2030 (%)
Data Table on Germany - Year-over-year growth 2025-2030 (%)

12.5.2 UK - Market size and forecast 2025-2030

Chart on UK - Market size and forecast 2025-2030 ($ million)
Data Table on UK - Market size and forecast 2025-2030 ($ million)
Chart on UK - Year-over-year growth 2025-2030 (%)
Data Table on UK - Year-over-year growth 2025-2030 (%)

12.5.3 France - Market size and forecast 2025-2030

Chart on France - Market size and forecast 2025-2030 ($ million)
Data Table on France - Market size and forecast 2025-2030 ($ million)
Chart on France - Year-over-year growth 2025-2030 (%)
Data Table on France - Year-over-year growth 2025-2030 (%)

12.5.4 Spain - Market size and forecast 2025-2030

Chart on Spain - Market size and forecast 2025-2030 ($ million)
Data Table on Spain - Market size and forecast 2025-2030 ($ million)
Chart on Spain - Year-over-year growth 2025-2030 (%)
Data Table on Spain - Year-over-year growth 2025-2030 (%)

12.5.5 Italy - Market size and forecast 2025-2030

Chart on Italy - Market size and forecast 2025-2030 ($ million)
Data Table on Italy - Market size and forecast 2025-2030 ($ million)
Chart on Italy - Year-over-year growth 2025-2030 (%)
Data Table on Italy - Year-over-year growth 2025-2030 (%)

12.5.6 The Netherlands - Market size and forecast 2025-2030

Chart on The Netherlands - Market size and forecast 2025-2030 ($ million)
Data Table on The Netherlands - Market size and forecast 2025-2030 ($ million)
Chart on The Netherlands - Year-over-year growth 2025-2030 (%)
Data Table on The Netherlands - Year-over-year growth 2025-2030 (%)

12.6 Middle East and Africa - Market size and forecast 2025-2030

Chart on Middle East and Africa - Market size and forecast 2025-2030 ($ million)
Data Table on Middle East and Africa - Market size and forecast 2025-2030 ($ million)
Chart on Middle East and Africa - Year-over-year growth 2025-2030 (%)
Data Table on Middle East and Africa - Year-over-year growth 2025-2030 (%)
Chart on Regional Comparison - Middle East and Africa
Data Table on Regional Comparison - Middle East and Africa

12.6.1 South Africa - Market size and forecast 2025-2030

Chart on South Africa - Market size and forecast 2025-2030 ($ million)
Data Table on South Africa - Market size and forecast 2025-2030 ($ million)
Chart on South Africa - Year-over-year growth 2025-2030 (%)
Data Table on South Africa - Year-over-year growth 2025-2030 (%)

12.6.2 Saudi Arabia - Market size and forecast 2025-2030

Chart on Saudi Arabia - Market size and forecast 2025-2030 ($ million)
Data Table on Saudi Arabia - Market size and forecast 2025-2030 ($ million)
Chart on Saudi Arabia - Year-over-year growth 2025-2030 (%)
Data Table on Saudi Arabia - Year-over-year growth 2025-2030 (%)

12.6.3 UAE - Market size and forecast 2025-2030

Chart on UAE - Market size and forecast 2025-2030 ($ million)
Data Table on UAE - Market size and forecast 2025-2030 ($ million)
Chart on UAE - Year-over-year growth 2025-2030 (%)
Data Table on UAE - Year-over-year growth 2025-2030 (%)

12.6.4 Nigeria - Market size and forecast 2025-2030

Chart on Nigeria - Market size and forecast 2025-2030 ($ million)
Data Table on Nigeria - Market size and forecast 2025-2030 ($ million)
Chart on Nigeria - Year-over-year growth 2025-2030 (%)
Data Table on Nigeria - Year-over-year growth 2025-2030 (%)

12.6.5 Turkey - Market size and forecast 2025-2030

Chart on Turkey - Market size and forecast 2025-2030 ($ million)
Data Table on Turkey - Market size and forecast 2025-2030 ($ million)
Chart on Turkey - Year-over-year growth 2025-2030 (%)
Data Table on Turkey - Year-over-year growth 2025-2030 (%)

12.7 South America - Market size and forecast 2025-2030

Chart on South America - Market size and forecast 2025-2030 ($ million)
Data Table on South America - Market size and forecast 2025-2030 ($ million)
Chart on South America - Year-over-year growth 2025-2030 (%)
Data Table on South America - Year-over-year growth 2025-2030 (%)
Chart on Regional Comparison - South America
Data Table on Regional Comparison - South America

12.7.1 Brazil - Market size and forecast 2025-2030

Chart on Brazil - Market size and forecast 2025-2030 ($ million)
Data Table on Brazil - Market size and forecast 2025-2030 ($ million)
Chart on Brazil - Year-over-year growth 2025-2030 (%)
Data Table on Brazil - Year-over-year growth 2025-2030 (%)

12.7.2 Argentina - Market size and forecast 2025-2030

Chart on Argentina - Market size and forecast 2025-2030 ($ million)
Data Table on Argentina - Market size and forecast 2025-2030 ($ million)
Chart on Argentina - Year-over-year growth 2025-2030 (%)
Data Table on Argentina - Year-over-year growth 2025-2030 (%)

12.7.3 Colombia - Market size and forecast 2025-2030

Chart on Colombia - Market size and forecast 2025-2030 ($ million)
Data Table on Colombia - Market size and forecast 2025-2030 ($ million)
Chart on Colombia - Year-over-year growth 2025-2030 (%)
Data Table on Colombia - Year-over-year growth 2025-2030 (%)

12.8 Market opportunity by geography

Market opportunity by geography ($ million)
Data Tables on Market opportunity by geography ($ million)

13. Drivers, Challenges, and Opportunity

13.1 Market drivers

Growth in construction industry and infrastructure development
Rising awareness of worker safety and health
Technological advancements and material innovation

13.2 Market challenges

Strict regulatory frameworks
High cost of advanced safety helmets
Lack of awareness and training regarding proper use and maintenance

13.3 Impact of drivers and challenges

Impact of drivers and challenges in 2025 and 2030

13.4 Market opportunities

Integration of smart technology
Enhanced comfort and ergonomic design
Sustainability and eco-friendly materials

14. Competitive Landscape

14.1 Overview

14.2

Overview on criticality of inputs and factors of differentiation

14.3 Landscape disruption

Overview on factors of disruption

14.4 Industry risks

Impact of key risks on business

15. Competitive Analysis

15.1 Companies profiled

Companies covered

15.2 Company ranking index

15.3 Market positioning of companies

Matrix on companies position and classification

15.4 3M Co.

3M Co. - Overview
3M Co. - Business segments
3M Co. - Key news
3M Co. - Key offerings
3M Co. - Segment focus
SWOT

15.5 Bullard

Bullard - Overview
Bullard - Product / Service
Bullard - Key offerings
SWOT

15.6 Centurion Safety Products Ltd.

Centurion Safety Products Ltd. - Overview
Centurion Safety Products Ltd. - Product / Service
Centurion Safety Products Ltd. - Key offerings
SWOT

15.7 Delta Plus Group SA

Delta Plus Group SA - Overview
Delta Plus Group SA - Product / Service
Delta Plus Group SA - Key offerings
SWOT

15.8 Dragerwerk AG and Co. KGaA

Dragerwerk AG and Co. KGaA - Overview
Dragerwerk AG and Co. KGaA - Business segments
Dragerwerk AG and Co. KGaA - Key offerings
Dragerwerk AG and Co. KGaA - Segment focus
SWOT

15.9 Ergodyne

Ergodyne - Overview
Ergodyne - Product / Service
Ergodyne - Key offerings
SWOT

15.10 Honeywell International Inc.

Honeywell International Inc. - Overview
Honeywell International Inc. - Business segments
Honeywell International Inc. - Key news
Honeywell International Inc. - Key offerings
Honeywell International Inc. - Segment focus
SWOT

15.11 KARAM Group

KARAM Group - Overview
KARAM Group - Product / Service
KARAM Group - Key offerings
SWOT

15.12 KASK Spa

KASK Spa - Overview
KASK Spa - Product / Service
KASK Spa - Key offerings
SWOT

15.13 MSA Safety Inc.

MSA Safety Inc. - Overview
MSA Safety Inc. - Business segments
MSA Safety Inc. - Key news
MSA Safety Inc. - Key offerings
MSA Safety Inc. - Segment focus
SWOT

15.14 OccuNomix International

OccuNomix International - Overview
OccuNomix International - Product / Service
OccuNomix International - Key offerings
SWOT

15.15 PETZL Distribution

PETZL Distribution - Overview
PETZL Distribution - Product / Service
PETZL Distribution - Key offerings
SWOT

15.16 Pyramex Safety Products LLC

Pyramex Safety Products LLC - Overview
Pyramex Safety Products LLC - Product / Service
Pyramex Safety Products LLC - Key offerings
SWOT

15.17 Schuberth GmbH

Schuberth GmbH - Overview
Schuberth GmbH - Product / Service
Schuberth GmbH - Key offerings
SWOT

15.18 UVEX GmbH and Co. KG

UVEX GmbH and Co. KG - Overview
UVEX GmbH and Co. KG - Product / Service
UVEX GmbH and Co. KG - Key offerings
SWOT

16. Appendix

16.1 Scope of the report

Market definition
Objectives
Notes and caveats

16.2 Inclusions and exclusions checklist

Inclusions checklist
Exclusions checklist

16.3 Currency conversion rates for US$

16.4 Research methodology

16.5 Data procurement

Information sources

16.6 Data validation

16.7 Validation techniques employed for market sizing

16.8 Data synthesis

16.9 360 degree market analysis

16.10 List of abbreviations

Research Methodology

Technavio presents a detailed picture of the market by way of study, synthesis, and summation of data from multiple sources. The analysts have presented the various facets of the market with a particular focus on identifying the key industry influencers. The data thus presented is comprehensive, reliable, and the result of extensive research, both primary and secondary.

INFORMATION SOURCES

Primary sources

  • Manufacturers and suppliers
  • Channel partners
  • Industry experts
  • Strategic decision makers

Secondary sources

  • Industry journals and periodicals
  • Government data
  • Financial reports of key industry players
  • Historical data
  • Press releases

DATA ANALYSIS

Data Synthesis

  • Collation of data
  • Estimation of key figures
  • Analysis of derived insights

Data Validation

  • Triangulation with data models
  • Reference against proprietary databases
  • Corroboration with industry experts

REPORT WRITING

Qualitative

  • Market drivers
  • Market challenges
  • Market trends
  • Five forces analysis

Quantitative

  • Market size and forecast
  • Market segmentation
  • Geographical insights
  • Competitive landscape

Interested in this report?

Get your sample now to see our research methodology and insights!

Download Now

Frequently Asked Questions

Construction Safety Helmets market growth will increase by USD 744.6 million during 2026-2030 .

The Construction Safety Helmets market is expected to grow at a CAGR of 6.6% during 2026-2030 .

Construction Safety Helmets market is segmented by Material (Polyethylene, HDPE, Fiberglass, Polycarbonate, Others) Product type (Hard hats, Bump caps) End-user (Oil and gas, Energy and power, Automotive, Others)

3M Co., Anbu Safety Industrial Co. Ltd., Bullard, Centurion Safety Products Ltd., Concord Safety Products LLC, Delta Plus Group SA, Dragerwerk AG and Co. KGaA, Durasafety Materials Co. Ltd., Ergodyne, Globus Shetland Ltd., Honeywell International Inc., KARAM Group, KASK Spa, MSA Safety Inc., OccuNomix International, PETZL Distribution, Polison Corp., Pyramex Safety Products LLC, Schuberth GmbH, UVEX GmbH and Co. KG are a few of the key vendors in the Construction Safety Helmets market.

APAC will register the highest growth rate of 50.6% among the other regions. Therefore, the Construction Safety Helmets market in APAC is expected to garner significant business opportunities for the vendors during the forecast period.

China, Japan, India, South Korea, Australia, Indonesia, US, Canada, Mexico, Germany, UK, France, Spain, Italy, The Netherlands, South Africa, Saudi Arabia, UAE, Nigeria, Turkey, Brazil, Argentina, Colombia

  • Growth in construction industry and infrastructure development is the driving factor this market.

The Construction Safety Helmets market vendors should focus on grabbing business opportunities from the Material segment as it accounted for the largest market share in the base year.