
Customer Experience Management (CEM) Market Size 2025-2029
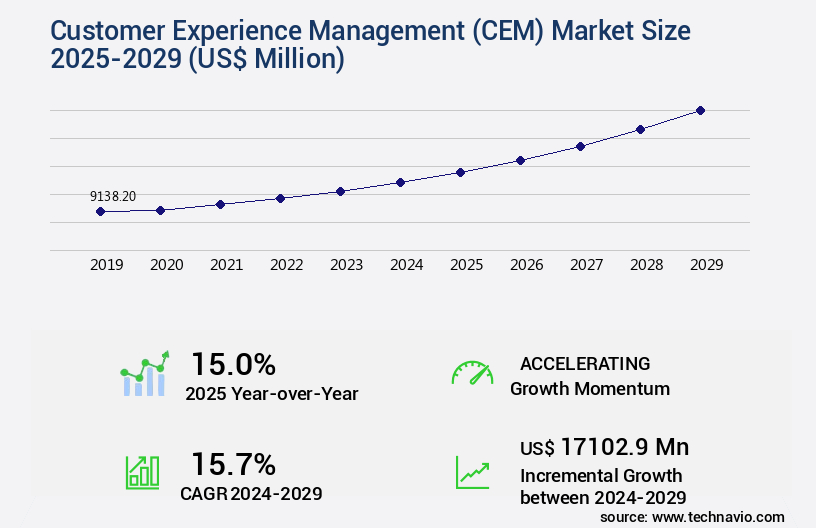
The customer experience management (cem) market size is valued to increase USD 17.1 billion, at a CAGR of 15.7% from 2024 to 2029. Increasing focus on customer-centricity among organizations will drive the customer experience management (cem) market.
Major Market Trends & Insights
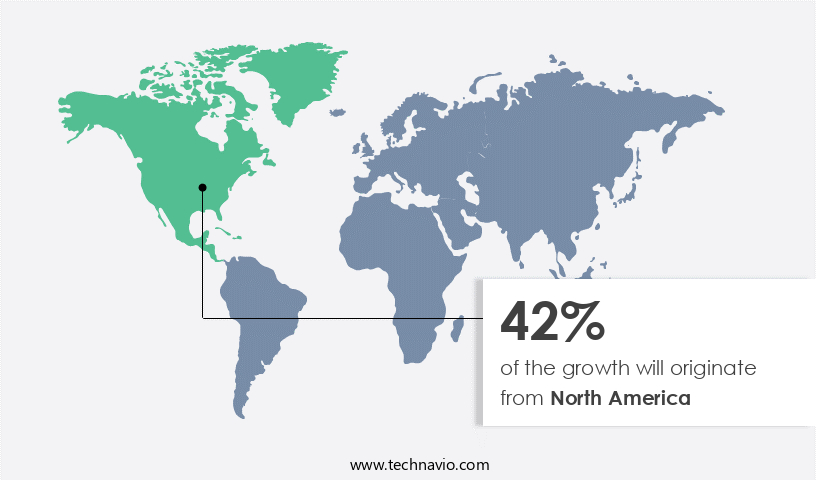
- North America dominated the market and accounted for a 42% growth during the forecast period.
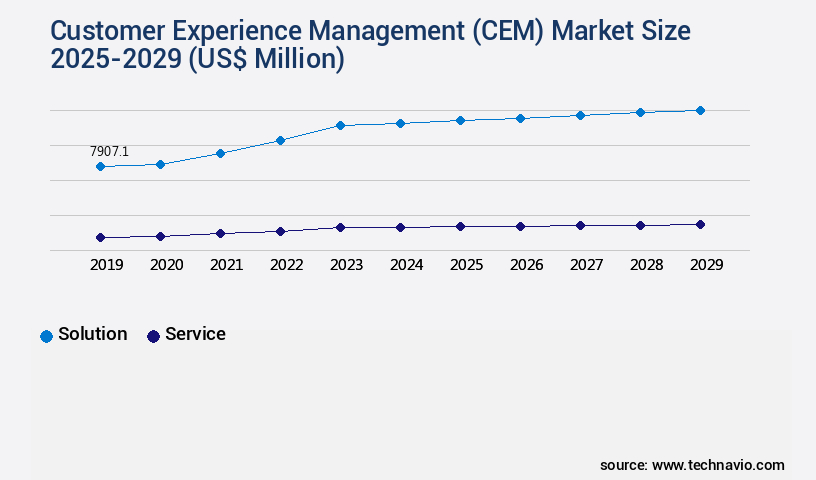
- By Component - Solution segment was valued at USD 7.91 billion in 2023
- By Deployment - On-premises segment accounted for the largest market revenue share in 2023
Market Size & Forecast
- Market Opportunities: USD 261.75 million
- Market Future Opportunities: USD 17102.90 million
- CAGR from 2024 to 2029 : 15.7%
Market Summary
- In the business world, Customer Experience Management (CEM) has emerged as a critical differentiator, with companies recognizing the importance of delivering exceptional customer experiences to gain a competitive edge. According to recent market research, the global CEM market is projected to reach a value of USD32.3 billion by 2025, underpinned by increasing customer expectations and the availability of advanced technologies. CEM solutions enable organizations to collect, analyze, and act on customer data in real-time, creating personalized experiences that foster loyalty and advocacy. Technological advancements, such as artificial intelligence and machine learning, are driving innovation in CEM, allowing businesses to anticipate customer needs and deliver contextually relevant interactions.
- However, the implementation of CEM solutions also presents challenges, particularly around privacy and security concerns. As customer data becomes more valuable, ensuring its protection is essential. Balancing the need for personalized experiences with data privacy regulations and customer consent is a complex issue that requires a strategic approach. In summary, the CEM market is experiencing significant growth, driven by the increasing importance of customer-centricity and technological advancements. However, privacy and security concerns present challenges that organizations must address to fully realize the benefits of CEM solutions.
What will be the Size of the Customer Experience Management (CEM) Market during the forecast period?
Get Key Insights on Market Forecast (PDF) Request Free Sample
How is the Customer Experience Management (CEM) Market Segmented ?
The customer experience management (cem) industry research report provides comprehensive data (region-wise segment analysis), with forecasts and estimates in "USD million" for the period 2025-2029, as well as historical data from 2019-2023 for the following segments.
- Component
- Solution
- Service
- Deployment
- On-premises
- Cloud
- End-user
- BFSI
- IT and telecom
- Retail
- Healthcare
- Others
- Geography
- North America
- US
- Canada
- Mexico
- Europe
- France
- Germany
- UK
- APAC
- China
- India
- Japan
- South America
- Brazil
- Rest of World (ROW)
- North America
By Component Insights
The solution segment is estimated to witness significant growth during the forecast period.
The market encompasses a range of technologies and solutions that help businesses optimize and enhance customer interactions. This dynamic sector continues to evolve, with a focus on customer service automation, web analytics platforms, and data visualization dashboards. For instance, application performance monitoring, AI-powered customer support, and chatbot implementation are increasingly common features in CEM solutions. Customer journey mapping, experience management software, and personalization technologies also play crucial roles in shaping customer experiences. Furthermore, customer lifetime value, voice of customer, and customer success management are key performance indicators that businesses prioritize. Qualitative data analysis, knowledge base management, and sentiment analysis tools are essential for gaining valuable customer insights.
Predictive analytics models, customer segmentation strategies, and customer feedback management enable businesses to anticipate and address customer needs effectively. Digital experience monitoring and feedback collection methods, such as customer effort score and survey design methodology, provide quantitative data for continuous improvement. Overall, the CEM market is a vibrant and ever-evolving landscape, with a growing emphasis on delivering personalized, omnichannel experiences to meet the evolving needs of today's customers. According to recent market research, the global CEM market is projected to reach a value of USD12.6 billion by 2027, underscoring its growing importance in the business world.
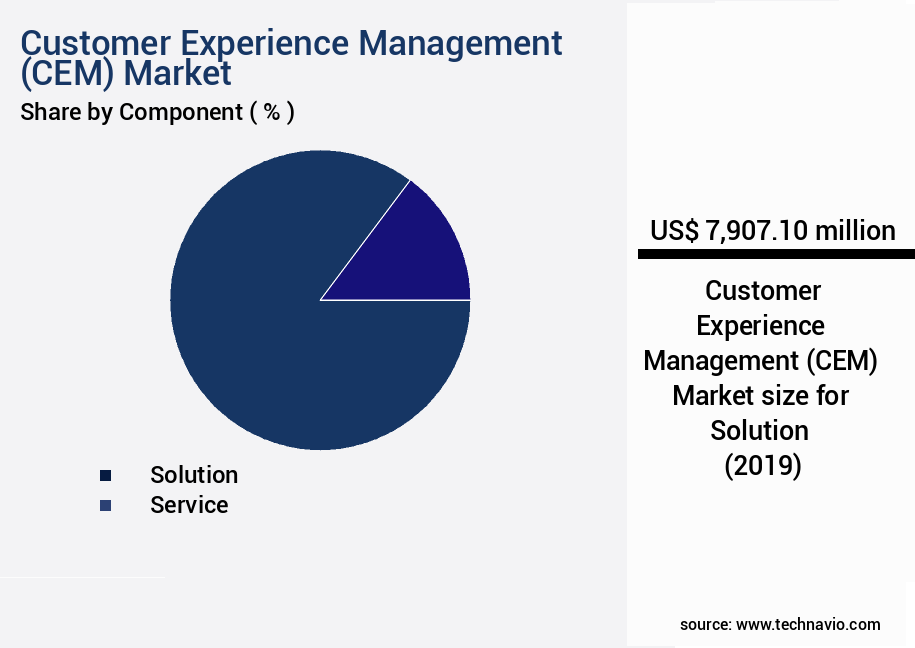
The Solution segment was valued at USD 7.91 billion in 2019 and showed a gradual increase during the forecast period.
Regional Analysis
North America is estimated to contribute 42% to the growth of the global market during the forecast period.Technavio’s analysts have elaborately explained the regional trends and drivers that shape the market during the forecast period.
See How Customer Experience Management (CEM) Market Demand is Rising in North America Request Free Sample
The market is experiencing significant growth, with North America anticipated to hold a substantial share due to the increasing adoption of CEM solutions by various industries in the region. Cloud services, a crucial resource for businesses in North America, are becoming increasingly relevant in expanding markets. These services offer advanced capabilities to local businesses, contributing to their technological advancement and cost savings. Companies in North America are enhancing customer experience through the implementation of AI-powered platforms.
For instance, in November 2024, Mitel introduced its AI-driven customer experience platform, Mitel CX. This solution underscores the growing importance of AI in delivering exceptional customer experiences.
Market Dynamics
Our researchers analyzed the data with 2024 as the base year, along with the key drivers, trends, and challenges. A holistic analysis of drivers will help companies refine their marketing strategies to gain a competitive advantage.
The market is experiencing significant growth as businesses recognize the importance of improving customer satisfaction metrics to drive loyalty and revenue. To achieve this, companies are implementing omnichannel customer experience strategies, allowing customers to engage with brands seamlessly across multiple channels. Effective measurement of customer lifetime value is also crucial, enabling businesses to optimize their customer service processes and leverage customer feedback for product development. Enhancing customer loyalty programs is another key focus area for CEM, as companies strive to build stronger relationships with their customers. Analyzing customer data for insights is essential for designing effective customer journeys and creating personalized experiences. Managing customer expectations effectively is also critical, as is using AI for improved customer support and measuring the effectiveness of customer service. Managing customer complaints effectively is a must in today's digital age, with social media monitoring a crucial aspect of CEM. Improving the customer onboarding experience is also important, as is tracking key customer experience metrics and ensuring customer data security and privacy. Moreover, using customer feedback to enhance employee experience is a growing trend in CEM, as businesses recognize the importance of a customer-centric culture. Automation is another area of focus in CEM, with businesses leveraging technology to streamline processes and improve efficiency. Effective use of AI and machine learning can help manage customer interactions, freeing up human agents to focus on more complex issues. Ultimately, the goal of CEM is to create a seamless, personalized experience for customers, driving loyalty and repeat business.
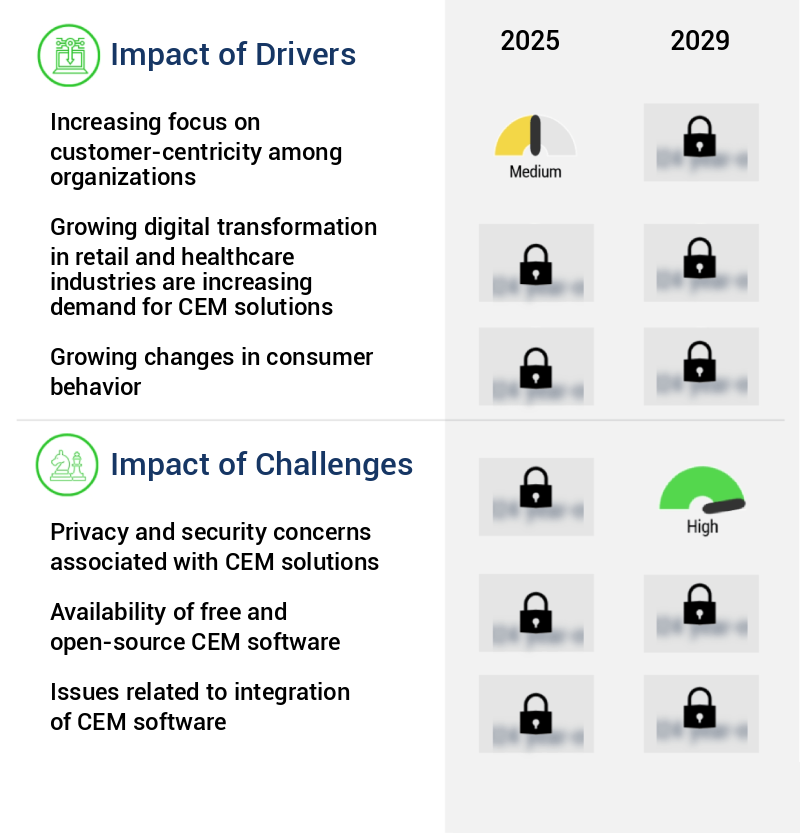
What are the key market drivers leading to the rise in the adoption of Customer Experience Management (CEM) Industry?
- The growing prioritization of customer-centricity within organizations serves as the primary catalyst for market advancement.
- In the dynamic and evolving global the market, businesses are increasingly prioritizing customer-centricity to secure long-term success. The importance of delivering exceptional customer experiences has grown significantly, as customers now hold more choices and heightened expectations. By investing in CEM solutions, organizations aim to gain a profound understanding of their customers' needs, preferences, and behaviors. This data-driven approach enables businesses to tailor their offerings, foster loyalty, and differentiate themselves from competitors. The CEM market reflects this trend, with numerous businesses adopting advanced technologies such as AI and machine learning to enhance their customer interactions and personalize experiences. This shift towards customer-centricity is not a fleeting trend but a continuous process, as businesses strive to meet and exceed evolving customer expectations.
What are the market trends shaping the Customer Experience Management (CEM) Industry?
- The upcoming market trend involves technological advancements and the implementation of innovative strategies.
- The market is experiencing significant growth and transformation, fueled by technological innovations and forward-thinking business strategies. Companies are prioritizing the enhancement of customer interactions and service delivery through integrated platforms and AI-driven solutions. In June 2024, Nextiva introduced its Unified Customer Experience Management (UCXM) solution at Customer Contact Week 2024. This platform distinguishes itself from conventional CCaaS offerings by providing a comprehensive solution for communication and customer engagement. UCXM offers personalized experiences, real-time interaction management, and data-driven decision-making capabilities.
- Its advanced features enable businesses to foster positive relationships with their customers, setting them apart from competitors. By integrating AI technologies and extensive toolsets, UCXM aims to cater to the evolving needs of modern customer service and support. This solution represents a pivotal step forward in the CEM market, reflecting its continuous growth and dynamic nature.
What challenges does the Customer Experience Management (CEM) Industry face during its growth?
- The integration of customer experience management (CEM) solutions into businesses comes with significant privacy and security concerns, posing a major challenge to the industry's growth. These issues, which include data protection, compliance with regulations, and potential vulnerabilities to cyber attacks, must be addressed to ensure the successful implementation and expansion of CEM solutions.
- In the dynamic and evolving the market, privacy and security concerns remain a significant challenge for organizations. With the escalating volume of customer data being amassed and processed, it is crucial for businesses to responsibly manage and safeguard this information to preserve customer trust and adhere to privacy regulations. A key concern in CEM is the acquisition and utilization of personal data. Transparency is paramount, necessitating clear communication regarding the data collected, its intended use, and obtaining proper consent from customers.
- Compliance with privacy laws, such as the California Consumer Privacy Act (CCPA) and the General Data Protection Regulation (GDPR), is essential. Organizations must continually adapt to the evolving privacy landscape and prioritize data protection to maintain a competitive edge in the CEM market.
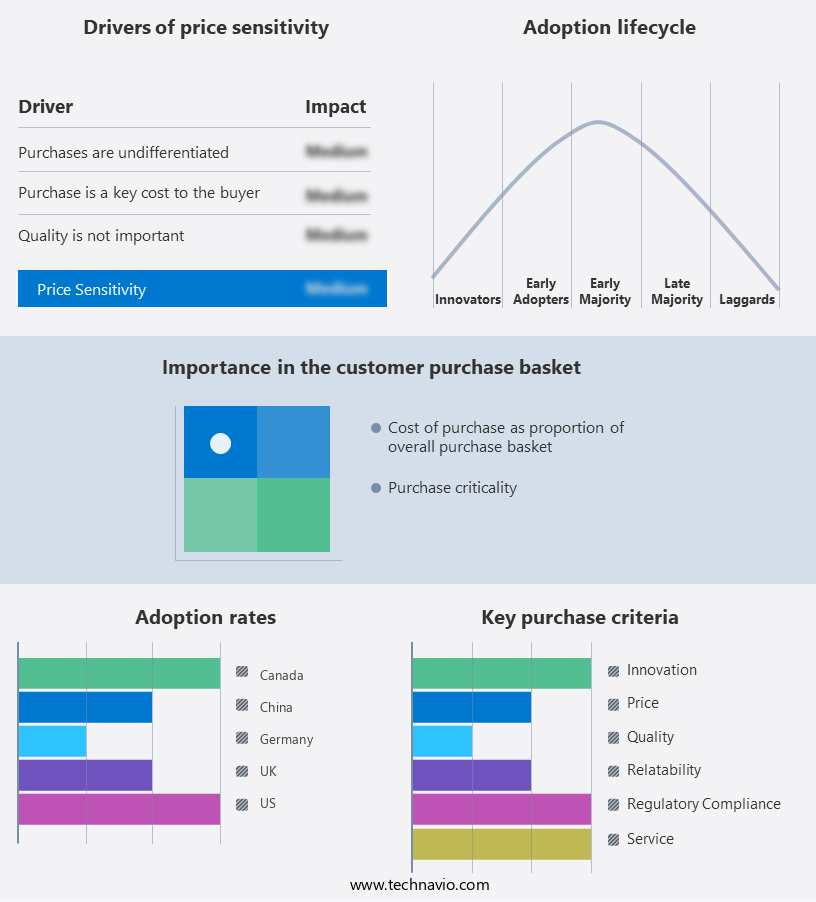
Exclusive Technavio Analysis on Customer Landscape
The customer experience management (cem) market forecasting report includes the adoption lifecycle of the market, covering from the innovator’s stage to the laggard’s stage. It focuses on adoption rates in different regions based on penetration. Furthermore, the customer experience management (cem) market report also includes key purchase criteria and drivers of price sensitivity to help companies evaluate and develop their market growth analysis strategies.
Customer Landscape of Customer Experience Management (CEM) Industry
Competitive Landscape
Companies are implementing various strategies, such as strategic alliances, customer experience management (cem) market forecast, partnerships, mergers and acquisitions, geographical expansion, and product/service launches, to enhance their presence in the industry.
Adobe Inc. - This cloud-based customer experience management solution accelerates digital maturity, leading to improved conversion rates, enhanced customer loyalty, and a stronger financial performance for businesses. By optimizing the customer journey, companies can effectively engage customers and drive long-term success.
The industry research and growth report includes detailed analyses of the competitive landscape of the market and information about key companies, including:
- Adobe Inc.
- Avaya LLC
- Freshworks Inc.
- Genesys Telecommunications Laboratories Inc.
- Ignite Enterprise Software Solutions Inc.
- International Business Machines Corp.
- Medallia Inc.
- Microsoft Corp.
- NICE Ltd.
- Nokia Corp.
- Open Text Corp.
- Oracle Corp.
- Qualtrics LLC
- SAP SE
- SAS Institute Inc.
- Service Management Group
- Sprinklr Inc.
- Tech Mahindra Ltd.
- Verint Systems Inc.
- Zendesk Inc.
Qualitative and quantitative analysis of companies has been conducted to help clients understand the wider business environment as well as the strengths and weaknesses of key industry players. Data is qualitatively analyzed to categorize companies as pure play, category-focused, industry-focused, and diversified; it is quantitatively analyzed to categorize companies as dominant, leading, strong, tentative, and weak.
Recent Development and News in Customer Experience Management (CEM) Market
- In January 2024, market leader Salesforce announced the acquisition of leading conversational AI platform, Beyond.Ai, for an undisclosed sum, aiming to enhance its CEM offerings with advanced AI capabilities (Salesforce Press Release, 2024). In March 2024, IBM and Cisco Systems formed a strategic partnership to integrate IBM's Watson AI with Cisco's contact center solutions, offering more personalized customer experiences (IBM Press Release, 2024).
- In April 2024, Accenture acquired German CEM firm, SinnerSchrader, expanding its European presence and enhancing its digital transformation capabilities (Accenture Press Release, 2024). In May 2025, Adobe unveiled its new Adobe Experience Platform, a comprehensive CEM solution, at the Adobe Summit conference, marking a significant technological advancement in the market (Adobe Press Release, 2025). These developments underscore the growing importance of AI, strategic partnerships, and acquisitions in the Customer Experience Management market.
Dive into Technavio’s robust research methodology, blending expert interviews, extensive data synthesis, and validated models for unparalleled Customer Experience Management (CEM) Market insights. See full methodology.
|
Market Scope |
|
|
Report Coverage |
Details |
|
Page number |
208 |
|
Base year |
2024 |
|
Historic period |
2019-2023 |
|
Forecast period |
2025-2029 |
|
Growth momentum & CAGR |
Accelerate at a CAGR of 15.7% |
|
Market growth 2025-2029 |
USD 17102.9 million |
|
Market structure |
Fragmented |
|
YoY growth 2024-2025(%) |
15.0 |
|
Key countries |
US, Canada, Germany, Mexico, China, Brazil, UK, Japan, France, and India |
|
Competitive landscape |
Leading Companies, Market Positioning of Companies, Competitive Strategies, and Industry Risks |
Research Analyst Overview
- The market continues to evolve, driven by advancements in technology and the growing importance of delivering exceptional customer experiences across various sectors. Customer experience technology, such as customer service automation and web analytics platforms, enable businesses to gather and analyze data, leading to improved customer satisfaction scores. Application performance monitoring and AI-powered customer support streamline interactions, while customer journey mapping and interaction management offer personalized experiences. Experience management software and voice of customer tools help organizations gain valuable insights into customer preferences and behaviors. Personalization technologies, customer lifetime value analysis, and customer success management are essential components of modern CEM strategies.
- Omnichannel customer experience, self-service portals, and digital experience monitoring ensure seamless interactions across channels. Feedback collection methods, including customer effort score surveys and sentiment analysis tools, provide real-time insights into customer sentiment. Predictive analytics models and customer segmentation strategies enable targeted marketing and proactive support. A recent study reveals that the CEM market is expected to grow by over 15% annually, underpinned by the increasing adoption of advanced technologies and the rising demand for personalized experiences. For instance, a leading retailer reported a 20% increase in sales due to the implementation of a chatbot, demonstrating the potential impact of these solutions.
What are the Key Data Covered in this Customer Experience Management (CEM) Market Research and Growth Report?
-
What is the expected growth of the Customer Experience Management (CEM) Market between 2025 and 2029?
-
USD 17.1 billion, at a CAGR of 15.7%
-
-
What segmentation does the market report cover?
-
The report is segmented by Component (Solution and Service), Deployment (On-premises and Cloud), End-user (BFSI, IT and telecom, Retail, Healthcare, and Others), and Geography (North America, Europe, APAC, South America, and Middle East and Africa)
-
-
Which regions are analyzed in the report?
-
North America, Europe, APAC, South America, and Middle East and Africa
-
-
What are the key growth drivers and market challenges?
-
Increasing focus on customer-centricity among organizations, Privacy and security concerns associated with CEM solutions
-
-
Who are the major players in the Customer Experience Management (CEM) Market?
-
Adobe Inc., Avaya LLC, Freshworks Inc., Genesys Telecommunications Laboratories Inc., Ignite Enterprise Software Solutions Inc., International Business Machines Corp., Medallia Inc., Microsoft Corp., NICE Ltd., Nokia Corp., Open Text Corp., Oracle Corp., Qualtrics LLC, SAP SE, SAS Institute Inc., Service Management Group, Sprinklr Inc., Tech Mahindra Ltd., Verint Systems Inc., and Zendesk Inc.
-
Market Research Insights
- The market for customer experience management (CEM) solutions continues to evolve, with organizations increasingly recognizing the importance of delivering exceptional customer experiences to drive business growth. Two key trends illustrate this: 1) the adoption of process automation tools to streamline customer interactions and improve response times, resulting in a 25% increase in customer satisfaction ratings; 2) the industry's expectation to grow by over 15% annually as companies invest in advanced technologies like real-time feedback analysis, customer loyalty programs, and contact center optimization.
- For instance, a leading retailer leveraged a complaint management system to reduce customer complaints by 30%, while ensuring data security through robust customer data integration practices. These initiatives are integral components of digital transformation strategies, enabling brands to enhance customer engagement and foster advocacy.
We can help! Our analysts can customize this customer experience management (cem) market research report to meet your requirements.
 RIA -
RIA - 
