Cylindrical Lithium-ion Battery Market Analysis, Size, and Forecast 2026-2030: APAC (China, Japan, and India), North America (US, Canada, and Mexico), Europe (Germany, France, and UK), South America (Brazil and Argentina), Middle East and Africa (Saudi Arabia, UAE, and South Africa), and Rest of World (ROW)

Cylindrical Lithium-ion Battery Market Analysis, Size, and Forecast 2026-2030:
APAC (China, Japan, and India), North America (US, Canada, and Mexico), Europe (Germany, France, and UK), South America (Brazil and Argentina), Middle East and Africa (Saudi Arabia, UAE, and South Africa), and Rest of World (ROW)

Published: Mar 2026 313 Pages SKU: IRTNTR44713

Market Overview at a Glance

$13.97 B
Market Opportunity
7%
CAGR 2025 - 2030
58%
APAC Growth
$16.33 B
Automotive segment 2024

Cylindrical Lithium-ion Battery Market Size 2026-2030

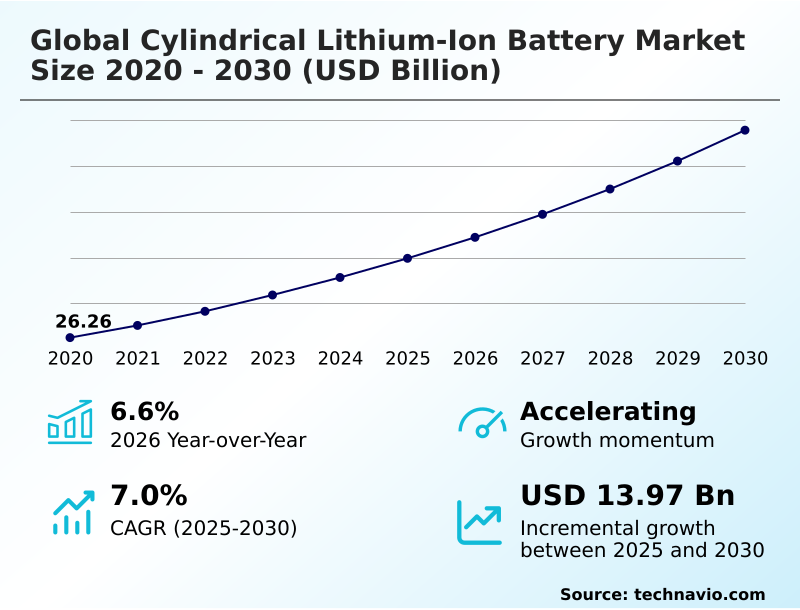
The cylindrical lithium-ion battery market size is valued to increase by USD 13.97 billion, at a CAGR of 7% from 2025 to 2030. Increasing demand for electric mobility will drive the cylindrical lithium-ion battery market.

Major Market Trends & Insights

  • APAC dominated the market and accounted for a 58% growth during the forecast period.
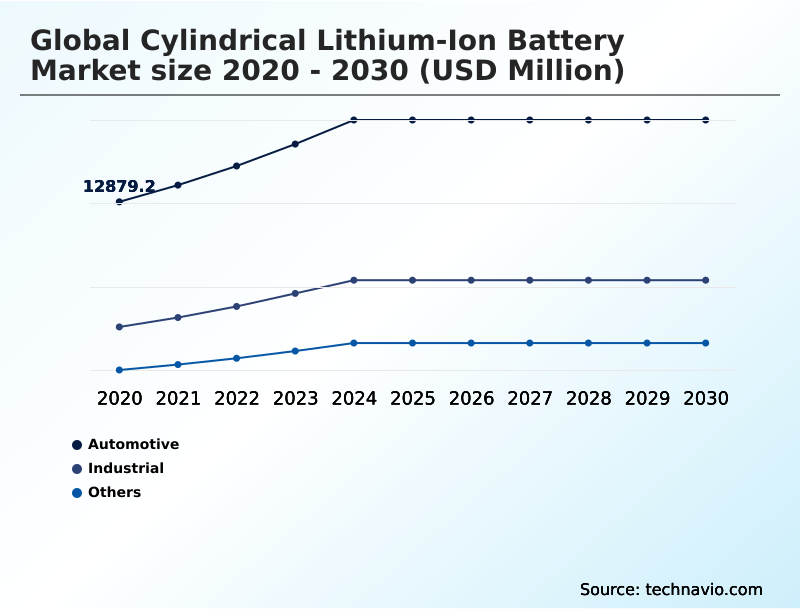
  • By Application - Automotive segment was valued at USD 16.33 billion in 2024
  • By Type - Lithium nickel manganese cobalt segment accounted for the largest market revenue share in 2024

Market Size & Forecast

  • Market Opportunities: USD 22.63 billion
  • Market Future Opportunities: USD 13.97 billion
  • CAGR from 2025 to 2030 : 7%

Market Summary

  • The cylindrical lithium-ion battery market is undergoing a significant transformation, driven by the dual needs of automotive electrification and scalable energy storage systems. The industry is moving beyond traditional formats, with innovations in high capacity cell architectures like 4680 cylindrical cells becoming central to achieving higher energy density and lower production costs.
  • This shift necessitates advancements in manufacturing, including dry electrode coating and high-precision equipment to ensure quality at scale. For instance, an automotive manufacturer can redesign its vehicle platform around a structural battery pack, which utilizes these larger cells to reduce component count and simplify assembly, leading to a more efficient and cost-effective production line.
  • Concurrently, the diversification into industrial applications, such as grid stabilization services and uninterruptible power supply, highlights the versatility of cylindrical cells. However, this expansion is tempered by challenges in raw material procurement and the complexity of scaling new technologies while maintaining stringent safety standards to prevent thermal runaway risk.
  • The focus on developing new cathode materials and refining battery management systems is therefore critical for sustained progress.

What will be the Size of the Cylindrical Lithium-ion Battery Market during the forecast period?

Get Key Insights on Market Forecast (PDF) Request Free Sample

How is the Cylindrical Lithium-ion Battery Market Segmented?

The cylindrical lithium-ion battery industry research report provides comprehensive data (region-wise segment analysis), with forecasts and estimates in "USD million" for the period 2026-2030, as well as historical data from 2020-2024 for the following segments.

  • Application
    • Automotive
    • Industrial
    • Others
  • Type
    • Lithium nickel manganese cobalt
    • Lithium titanate
    • Lithium iron phosphate
    • Lithium cobalt oxide
  • Capacity
    • Between 3000 to 10000 mAh
    • Below 3000 mAh
    • Above 10000 mAh
  • Geography
    • APAC
      • China
      • Japan
      • India
    • North America
      • US
      • Canada
      • Mexico
    • Europe
      • Germany
      • France
      • UK
    • South America
      • Brazil
      • Argentina
    • Middle East and Africa
      • Saudi Arabia
      • UAE
      • South Africa
    • Rest of World (ROW)

By Application Insights

The automotive segment is estimated to witness significant growth during the forecast period.

The automotive sector's adoption of cylindrical lithium-ion batteries is accelerating, driven by a strategic shift toward high capacity cell architectures. This transition focuses on optimizing vehicle performance and manufacturing efficiency through innovations like cell-to-pack technology.

Advanced engineering in the 4680 cylindrical cells and similar large formats enables the creation of a structural battery pack, which reduces vehicle weight and complexity.

Developments in lithium iron phosphate chemistry and advanced anode materials are crucial for meeting cost and range targets.

Manufacturers are leveraging laser welding techniques and automated inspection systems to scale production, with some achieving a reduction in internal resistance of over 20% through tabless electrode design, enhancing overall thermal management and fast charging capabilities.

Request Free Sample

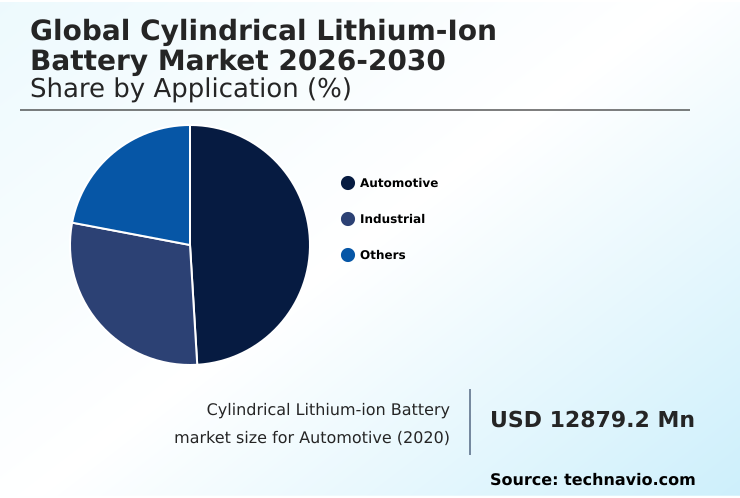
The Automotive segment was valued at USD 16.33 billion in 2024 and showed a gradual increase during the forecast period.

Request Free Sample

Regional Analysis

APAC is estimated to contribute 58% to the growth of the global market during the forecast period.Technavio’s analysts have elaborately explained the regional trends and drivers that shape the market during the forecast period.

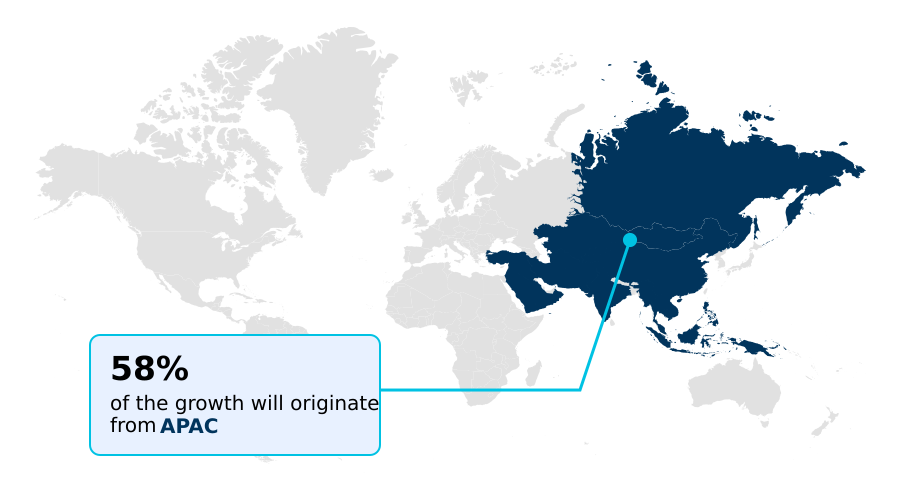
See How Cylindrical Lithium-ion Battery Market Demand is Rising in APAC Request Free Sample

The geographic landscape of the cylindrical lithium-ion battery market is dominated by the APAC region, which accounts for over 58% of the market's incremental growth, driven by its established manufacturing ecosystem.

Countries like China, Japan, and South Korea are epicenters for innovation in high-power lithium-ion batteries and mass production of rechargeable lithium-ion cells.

North America is rapidly scaling its domestic production capabilities, fueled by gigafactory investments aimed at supporting automotive electrification and reducing supply chain dependencies.

In Europe, a strong focus on circular economy principles and sustainable manufacturing is shaping the market, with an emphasis on end-of-life battery recycling and the development of cobalt-free chemistries.

The region's growth is supported by stringent environmental regulations and the need for renewable energy integration, which drives demand for stationary energy storage systems.

Market Dynamics

Our researchers analyzed the data with 2025 as the base year, along with the key drivers, trends, and challenges. A holistic analysis of drivers will help companies refine their marketing strategies to gain a competitive advantage.

  • Strategic decision-making in the cylindrical lithium-ion battery market requires a deep understanding of nuanced technical trade-offs and operational hurdles. A critical point of evaluation is the ongoing debate of cylindrical vs prismatic cell performance, where factors like energy density, thermal management, and mechanical robustness must be weighed for specific applications.
  • The 4680 cell manufacturing process challenges, particularly in achieving uniform dry electrode coating and consistent laser welding at scale, remain a focal point for R&D efforts. Concurrently, the exploration of silicon anode benefits in cylindrical batteries promises higher capacity but introduces complexities related to material expansion and cycle life.
  • Assessing lithium iron phosphate cylindrical cell safety is paramount, as this chemistry gains traction in automotive and grid storage due to its stability. This leads to further analysis of thermal management in high capacity cells and the impact of tabless design on performance to mitigate overheating risks.
  • A detailed cost analysis of large format cells is essential for business case validation. Moreover, understanding the role of bms in cell longevity and methods for reducing internal resistance in 21700 cells are key to optimizing system-level performance.
  • Innovations in cylindrical battery electrolytes and the future of cobalt free cylindrical cells are reshaping sourcing strategies, while scaling up 46 series cell production remains a capital-intensive challenge. The entire value chain is also impacted by supply chain risks for battery materials, where strategic sourcing can affect final costs more than twice as much as production automation.
  • As the industry evolves, advancements in solid state cylindrical cells and improved recycling processes for cylindrical li-ion cells will define the next wave of competition, especially as cylindrical battery use in industrial automation and grid storage grows.
  • Adherence to evolving safety standards for ev cylindrical batteries and a deeper look into the high nickel vs lfp cell comparison are now standard due to diligence for all stakeholders.

What are the key market drivers leading to the rise in the adoption of Cylindrical Lithium-ion Battery Industry?

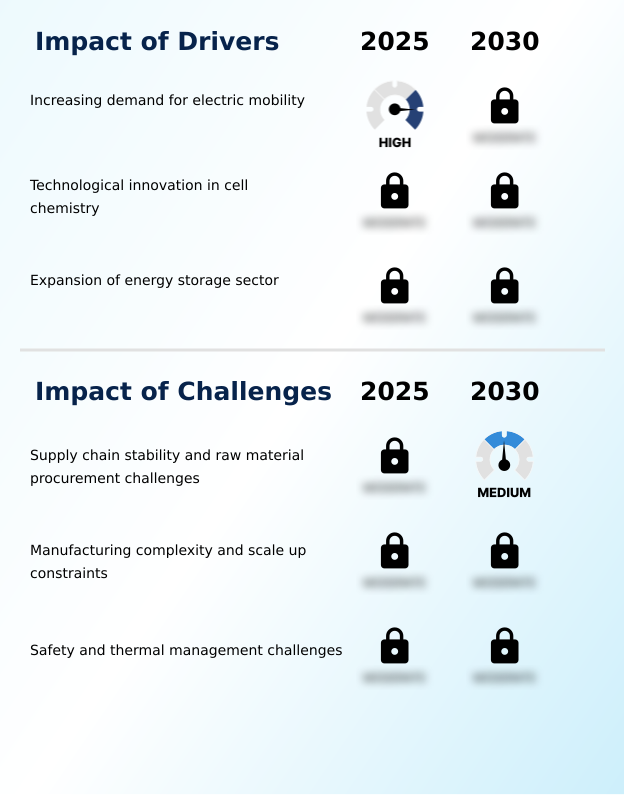
  • The increasing demand for electric mobility is a key driver propelling the growth of the cylindrical lithium-ion battery market.

  • The market's growth is fundamentally driven by the accelerating pace of automotive electrification and the expansion of renewable energy infrastructure.
  • The demand for electric vehicles is fueling massive gigafactory investments and the development of next-generation production equipment to scale manufacturing of high-performance cells.
  • Innovations in cell chemistry, such as dendrite formation prevention and the use of low-carbon aluminum casings, are improving both safety and sustainability, with advanced monitoring software enhancing battery lifespan by 15% in some applications.
  • Additionally, the expanding energy storage systems sector requires reliable and cost-effective solutions for grid stabilization services and uninterruptible power supply.
  • This diversification into industrial applications, including professional power tools and deep sea exploration, is creating new revenue streams and driving technical advancements.

What are the market trends shaping the Cylindrical Lithium-ion Battery Industry?

  • The market is witnessing a significant trend toward the adoption of large-format 46-series cylindrical cells. This shift is driven by the demand for higher energy density and improved vehicle performance.

  • A primary trend reshaping the market is the adoption of large-format cylindrical cells, which enables improved energy density and simplifies manufacturing. This shift allows automotive manufacturers to reduce battery pack component counts by over 30%, lowering overall costs and vehicle weight.
  • The integration of silicon anode technology is another key development, with early implementations showing a potential increase in cell capacity by up to 20% compared to traditional graphite-based designs. Furthermore, a growing emphasis on circular economy principles is driving innovation in end-of-life battery recycling and the use of cobalt-free chemistries.
  • This focus on sustainability is becoming a competitive differentiator, as regulatory bodies tighten requirements for material traceability and carbon footprint reporting in the production of high discharge rate batteries.

What challenges does the Cylindrical Lithium-ion Battery Industry face during its growth?

  • Supply chain instability and challenges in raw material procurement present a key challenge affecting the industry's growth trajectory.

  • A significant challenge confronting the market is the inherent manufacturing complexity and the high capital expenditure required for next-generation production equipment. Transitioning to larger cell formats introduces technical hurdles, with initial production runs experiencing yield rates up to 15% lower than established lines.
  • These scale-up constraints are exacerbated by persistent supply chain instability and difficulties in raw material procurement, which can cause component cost fluctuations of over 25% in a single quarter. Furthermore, ensuring safety and effective thermal management remains a primary concern.
  • The risk of thermal runaway in high-capacity cells necessitates stringent testing and the integration of advanced safety features, which can increase pack weight and design complexity, partially offsetting gains in energy density.

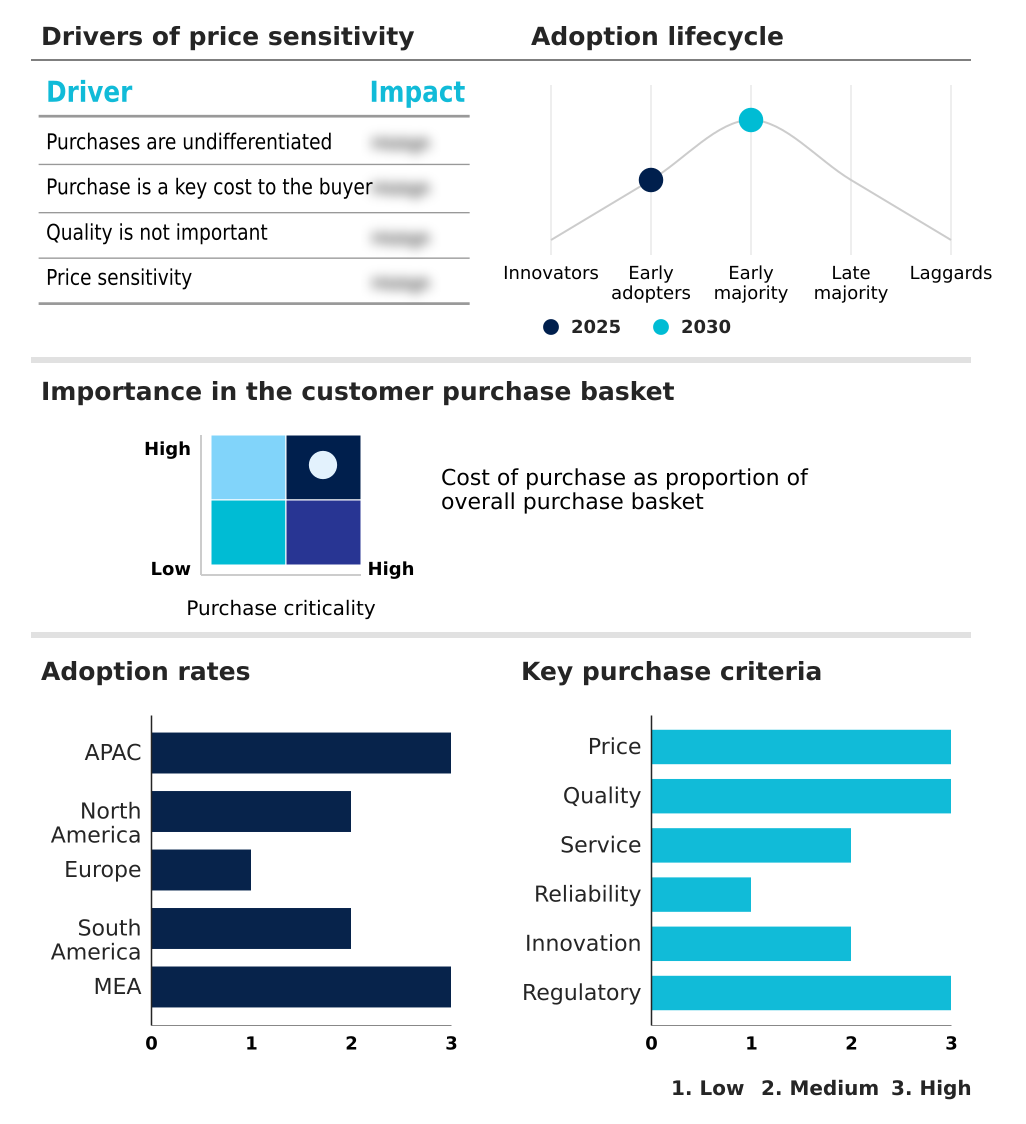
Exclusive Technavio Analysis on Customer Landscape

The cylindrical lithium-ion battery market forecasting report includes the adoption lifecycle of the market, covering from the innovator’s stage to the laggard’s stage. It focuses on adoption rates in different regions based on penetration. Furthermore, the cylindrical lithium-ion battery market report also includes key purchase criteria and drivers of price sensitivity to help companies evaluate and develop their market growth analysis strategies.

Customer Landscape of Cylindrical Lithium-ion Battery Industry

Competitive Landscape

Companies are implementing various strategies, such as strategic alliances, cylindrical lithium-ion battery market forecast, partnerships, mergers and acquisitions, geographical expansion, and product/service launches, to enhance their presence in the industry.

CBAK Energy Technology Inc. - Offerings include high-capacity 18650 and 21700 cylindrical lithium-ion cells engineered for high-power electric mobility, energy storage, and industrial applications.

The industry research and growth report includes detailed analyses of the competitive landscape of the market and information about key companies, including:

  • CBAK Energy Technology Inc.
  • Contemporary Amperex Ltd.
  • E One Moli Energy Corp.
  • EVE Energy Co. Ltd.
  • Gotion High tech Co. Ltd.
  • LG Electronics Inc.
  • Lithion Battery Inc.
  • Lithium Werks
  • Murata Manufacturing Co. Ltd.
  • Nanograf Corp.
  • Northvolt AB
  • OptimumNano Energy Co. Ltd.
  • Panasonic Holdings Corp.
  • Samsung Electronics Co. Ltd.
  • Shenzhen BAK Battery Co. Ltd.
  • Sunwoda Electronic Co. Ltd.
  • Tadiran Batteries GmbH
  • Tesla Inc.
  • TianJin Lishen Battery Ltd.
  • VARTA AG

Qualitative and quantitative analysis of companies has been conducted to help clients understand the wider business environment as well as the strengths and weaknesses of key industry players. Data is qualitatively analyzed to categorize companies as pure play, category-focused, industry-focused, and diversified; it is quantitatively analyzed to categorize companies as dominant, leading, strong, tentative, and weak.

Recent Development and News in Cylindrical lithium-ion battery market

  • In August, 2024, Northvolt AB launched a project to utilize low-carbon aluminum for the casings of its cylindrical cells to reduce the overall environmental footprint of the manufacturing process.
  • In January, 2025, Gotion High tech Co. Ltd. demonstrated a new 4695 cylindrical cell that uses a silicon anode to achieve a full charge in under twenty minutes, addressing demand for fast-charging solutions.
  • In March, 2025, VARTA AG introduced a new compact energy storage system for medical laboratories that utilizes high-density cylindrical cells to provide uninterruptible power for sensitive equipment.
  • In May, 2025, Sunwoda Electronic Co. Ltd. expanded its testing laboratory for cylindrical batteries, ensuring its lithium nickel manganese cobalt cells meet the highest international safety standards.

Dive into Technavio’s robust research methodology, blending expert interviews, extensive data synthesis, and validated models for unparalleled Cylindrical Lithium-ion Battery Market insights. See full methodology.

Market Scope
Page number 313
Base year 2025
Historic period 2020-2024
Forecast period 2026-2030
Growth momentum & CAGR Accelerate at a CAGR of 7%
Market growth 2026-2030 USD 13972.9 million
Market structure Fragmented
YoY growth 2025-2026(%) 6.6%
Key countries China, Japan, India, South Korea, Australia, Indonesia, US, Canada, Mexico, Germany, France, UK, Italy, Spain, The Netherlands, Brazil, Argentina, Chile, Saudi Arabia, UAE, South Africa, Turkey and Israel
Competitive landscape Leading Companies, Market Positioning of Companies, Competitive Strategies, and Industry Risks

Request Free Sample

Research Analyst Overview

  • The cylindrical lithium-ion battery market is advancing through intense innovation in materials and manufacturing processes. The industry-wide adoption of 4680 cylindrical cells and the 4695 cylindrical cell is redefining cell-to-pack technology, enabling lighter and more integrated structural battery pack designs.
  • Core to this evolution is silicon anode technology and the refinement of high nickel cathodes, which are pushing the boundaries of energy density. Simultaneously, lithium iron phosphate chemistry is gaining prominence for its safety and cost-effectiveness, supported by developments in fire retardant electrolyte and separator material.
  • Manufacturing is becoming more sophisticated with the use of dry electrode coating, advanced laser welding techniques, and automated inspection systems. For boardroom decisions, the adoption of tabless electrode design is critical, as it has been shown to lower internal resistance by up to 10%, directly impacting fast charging solutions and thermal management.
  • The market offers a diverse range of formats, including VTC6 18650 cells, 21700 high-capacity cells, 32140 cylindrical batteries, and the 33140 cylindrical cell, alongside established NCR 18650 cells.
  • Innovations extend to chemistries like lithium titanate and nanophosphate cylindrical cell technology, while battery management systems become more crucial for optimizing cycle life and performance in high-power lithium-ion batteries and rechargeable lithium-ion cells. The development of solid state electrolytes and silicon-graphene anode technology signals the next frontier.

What are the Key Data Covered in this Cylindrical Lithium-ion Battery Market Research and Growth Report?

  • What is the expected growth of the Cylindrical Lithium-ion Battery Market between 2026 and 2030?

    • USD 13.97 billion, at a CAGR of 7%

  • What segmentation does the market report cover?

    • The report is segmented by Application (Automotive, Industrial, and Others), Type (Lithium nickel manganese cobalt, Lithium titanate, Lithium iron phosphate, and Lithium cobalt oxide), Capacity (Between 3000 to 10000 mAh, Below 3000 mAh, and Above 10000 mAh) and Geography (APAC, North America, Europe, South America, Middle East and Africa)

  • Which regions are analyzed in the report?

    • APAC, North America, Europe, South America and Middle East and Africa

  • What are the key growth drivers and market challenges?

    • Increasing demand for electric mobility, Supply chain stability and raw material procurement challenges

  • Who are the major players in the Cylindrical Lithium-ion Battery Market?

    • CBAK Energy Technology Inc., Contemporary Amperex Ltd., E One Moli Energy Corp., EVE Energy Co. Ltd., Gotion High tech Co. Ltd., LG Electronics Inc., Lithion Battery Inc., Lithium Werks, Murata Manufacturing Co. Ltd., Nanograf Corp., Northvolt AB, OptimumNano Energy Co. Ltd., Panasonic Holdings Corp., Samsung Electronics Co. Ltd., Shenzhen BAK Battery Co. Ltd., Sunwoda Electronic Co. Ltd., Tadiran Batteries GmbH, Tesla Inc., TianJin Lishen Battery Ltd. and VARTA AG

Market Research Insights

  • The dynamics of the cylindrical lithium-ion battery market are shaped by a push for higher performance and the practicalities of industrial scale-up. The pursuit of advanced cell chemistries is delivering tangible results, with some firms reporting up to a 15% increase in cycle life through improved anode materials.
  • This enhances the viability of batteries in demanding applications like heavy duty vehicle models and professional power tools. Concurrently, a focus on manufacturing excellence is critical; the integration of automated production machinery has enabled a reduction in defect rates by over 10% in some high-volume lines. However, gigafactory investments are counterbalanced by the persistent challenge of supply chain stability.
  • The reliance on geographically concentrated raw material procurement creates price volatility, impacting profitability and complicating long-term planning for energy storage systems and automotive electrification.

We can help! Our analysts can customize this cylindrical lithium-ion battery market research report to meet your requirements.

Get in touch

1. Executive Summary

1.1 Market overview

Executive Summary - Chart on Market Overview
Executive Summary - Data Table on Market Overview
Executive Summary - Chart on Global Market Characteristics
Executive Summary - Chart on Market by Geography
Executive Summary - Chart on Market Segmentation by Application
Executive Summary - Chart on Market Segmentation by Type
Executive Summary - Chart on Market Segmentation by Capacity
Executive Summary - Chart on Incremental Growth
Executive Summary - Data Table on Incremental Growth
Executive Summary - Chart on Company Market Positioning

2. Technavio Analysis

2.1 Analysis of price sensitivity, lifecycle, customer purchase basket, adoption rates, and purchase criteria

2.2 Criticality of inputs and Factors of differentiation

Chart on Overview on criticality of inputs and factors of differentiation

2.3 Factors of disruption

Chart on Overview on factors of disruption

2.4 Impact of drivers and challenges

Chart on Impact of drivers and challenges in 2025 and 2030

3. Market Landscape

3.1 Market ecosystem

Chart on Parent Market
Data Table on - Parent Market

3.2 Market characteristics

Chart on Market characteristics analysis

3.3 Value chain analysis

Chart on Value chain analysis

4. Market Sizing

4.1 Market definition

Data Table on Offerings of companies included in the market definition

4.2 Market segment analysis

Market segments

4.3 Market size 2025

4.4 Market outlook: Forecast for 2025-2030

Chart on Global - Market size and forecast 2025-2030 ($ million)
Data Table on Global - Market size and forecast 2025-2030 ($ million)
Chart on Global Market: Year-over-year growth 2025-2030 (%)
Data Table on Global Market: Year-over-year growth 2025-2030 (%)

5. Historic Market Size

5.1 Global Cylindrical Lithium-Ion Battery Market 2020 - 2024

Historic Market Size - Data Table on Global Cylindrical Lithium-Ion Battery Market 2020 - 2024 ($ million)

5.2 Application segment analysis 2020 - 2024

Historic Market Size - Application Segment 2020 - 2024 ($ million)

5.3 Type segment analysis 2020 - 2024

Historic Market Size - Type Segment 2020 - 2024 ($ million)

5.4 Capacity segment analysis 2020 - 2024

Historic Market Size - Capacity Segment 2020 - 2024 ($ million)

5.5 Geography segment analysis 2020 - 2024

Historic Market Size - Geography Segment 2020 - 2024 ($ million)

5.6 Country segment analysis 2020 - 2024

Historic Market Size - Country Segment 2020 - 2024 ($ million)

6. Qualitative Analysis

6.1 Impact of AI on Global Cylindrical Lithium-Ion Battery Market

7. Five Forces Analysis

7.1 Five forces summary

Five forces analysis - Comparison between 2025 and 2030

7.2 Bargaining power of buyers

Bargaining power of buyers - Impact of key factors 2025 and 2030

7.3 Bargaining power of suppliers

Bargaining power of suppliers - Impact of key factors in 2025 and 2030

7.4 Threat of new entrants

Threat of new entrants - Impact of key factors in 2025 and 2030

7.5 Threat of substitutes

Threat of substitutes - Impact of key factors in 2025 and 2030

7.6 Threat of rivalry

Threat of rivalry - Impact of key factors in 2025 and 2030

7.7 Market condition

Chart on Market condition - Five forces 2025 and 2030

8. Market Segmentation by Application

8.1 Market segments

Chart on Application - Market share 2025-2030 (%)
Data Table on Application - Market share 2025-2030 (%)

8.2 Comparison by Application

Chart on Comparison by Application
Data Table on Comparison by Application

8.3 Automotive - Market size and forecast 2025-2030

Chart on Automotive - Market size and forecast 2025-2030 ($ million)
Data Table on Automotive - Market size and forecast 2025-2030 ($ million)
Chart on Automotive - Year-over-year growth 2025-2030 (%)
Data Table on Automotive - Year-over-year growth 2025-2030 (%)

8.4 Industrial - Market size and forecast 2025-2030

Chart on Industrial - Market size and forecast 2025-2030 ($ million)
Data Table on Industrial - Market size and forecast 2025-2030 ($ million)
Chart on Industrial - Year-over-year growth 2025-2030 (%)
Data Table on Industrial - Year-over-year growth 2025-2030 (%)

8.5 Others - Market size and forecast 2025-2030

Chart on Others - Market size and forecast 2025-2030 ($ million)
Data Table on Others - Market size and forecast 2025-2030 ($ million)
Chart on Others - Year-over-year growth 2025-2030 (%)
Data Table on Others - Year-over-year growth 2025-2030 (%)

8.6 Market opportunity by Application

Market opportunity by Application ($ million)
Data Table on Market opportunity by Application ($ million)

9. Market Segmentation by Type

9.1 Market segments

Chart on Type - Market share 2025-2030 (%)
Data Table on Type - Market share 2025-2030 (%)

9.2 Comparison by Type

Chart on Comparison by Type
Data Table on Comparison by Type

9.3 Lithium nickel manganese cobalt - Market size and forecast 2025-2030

Chart on Lithium nickel manganese cobalt - Market size and forecast 2025-2030 ($ million)
Data Table on Lithium nickel manganese cobalt - Market size and forecast 2025-2030 ($ million)
Chart on Lithium nickel manganese cobalt - Year-over-year growth 2025-2030 (%)
Data Table on Lithium nickel manganese cobalt - Year-over-year growth 2025-2030 (%)

9.4 Lithium titanate - Market size and forecast 2025-2030

Chart on Lithium titanate - Market size and forecast 2025-2030 ($ million)
Data Table on Lithium titanate - Market size and forecast 2025-2030 ($ million)
Chart on Lithium titanate - Year-over-year growth 2025-2030 (%)
Data Table on Lithium titanate - Year-over-year growth 2025-2030 (%)

9.5 Lithium iron phosphate - Market size and forecast 2025-2030

Chart on Lithium iron phosphate - Market size and forecast 2025-2030 ($ million)
Data Table on Lithium iron phosphate - Market size and forecast 2025-2030 ($ million)
Chart on Lithium iron phosphate - Year-over-year growth 2025-2030 (%)
Data Table on Lithium iron phosphate - Year-over-year growth 2025-2030 (%)

9.6 Lithium cobalt oxide - Market size and forecast 2025-2030

Chart on Lithium cobalt oxide - Market size and forecast 2025-2030 ($ million)
Data Table on Lithium cobalt oxide - Market size and forecast 2025-2030 ($ million)
Chart on Lithium cobalt oxide - Year-over-year growth 2025-2030 (%)
Data Table on Lithium cobalt oxide - Year-over-year growth 2025-2030 (%)

9.7 Market opportunity by Type

Market opportunity by Type ($ million)
Data Table on Market opportunity by Type ($ million)

10. Market Segmentation by Capacity

10.1 Market segments

Chart on Capacity - Market share 2025-2030 (%)
Data Table on Capacity - Market share 2025-2030 (%)

10.2 Comparison by Capacity

Chart on Comparison by Capacity
Data Table on Comparison by Capacity

10.3 Between 3000 to 10000 mAh - Market size and forecast 2025-2030

Chart on Between 3000 to 10000 mAh - Market size and forecast 2025-2030 ($ million)
Data Table on Between 3000 to 10000 mAh - Market size and forecast 2025-2030 ($ million)
Chart on Between 3000 to 10000 mAh - Year-over-year growth 2025-2030 (%)
Data Table on Between 3000 to 10000 mAh - Year-over-year growth 2025-2030 (%)

10.4 Below 3000 mAh - Market size and forecast 2025-2030

Chart on Below 3000 mAh - Market size and forecast 2025-2030 ($ million)
Data Table on Below 3000 mAh - Market size and forecast 2025-2030 ($ million)
Chart on Below 3000 mAh - Year-over-year growth 2025-2030 (%)
Data Table on Below 3000 mAh - Year-over-year growth 2025-2030 (%)

10.5 Above 10000 mAh - Market size and forecast 2025-2030

Chart on Above 10000 mAh - Market size and forecast 2025-2030 ($ million)
Data Table on Above 10000 mAh - Market size and forecast 2025-2030 ($ million)
Chart on Above 10000 mAh - Year-over-year growth 2025-2030 (%)
Data Table on Above 10000 mAh - Year-over-year growth 2025-2030 (%)

10.6 Market opportunity by Capacity

Market opportunity by Capacity ($ million)
Data Table on Market opportunity by Capacity ($ million)

11. Customer Landscape

11.1 Customer landscape overview

Analysis of price sensitivity, lifecycle, customer purchase basket, adoption rates, and purchase criteria

12. Geographic Landscape

12.1 Geographic segmentation

Chart on Market share by geography 2025-2030 (%)
Data Table on Market share by geography 2025-2030 (%)

12.2 Geographic comparison

Chart on Geographic comparison
Data Table on Geographic comparison

12.3 APAC - Market size and forecast 2025-2030

Chart on APAC - Market size and forecast 2025-2030 ($ million)
Data Table on APAC - Market size and forecast 2025-2030 ($ million)
Chart on APAC - Year-over-year growth 2025-2030 (%)
Data Table on APAC - Year-over-year growth 2025-2030 (%)
Chart on Regional Comparison - APAC
Data Table on Regional Comparison - APAC

12.3.1 China - Market size and forecast 2025-2030

Chart on China - Market size and forecast 2025-2030 ($ million)
Data Table on China - Market size and forecast 2025-2030 ($ million)
Chart on China - Year-over-year growth 2025-2030 (%)
Data Table on China - Year-over-year growth 2025-2030 (%)

12.3.2 Japan - Market size and forecast 2025-2030

Chart on Japan - Market size and forecast 2025-2030 ($ million)
Data Table on Japan - Market size and forecast 2025-2030 ($ million)
Chart on Japan - Year-over-year growth 2025-2030 (%)
Data Table on Japan - Year-over-year growth 2025-2030 (%)

12.3.3 India - Market size and forecast 2025-2030

Chart on India - Market size and forecast 2025-2030 ($ million)
Data Table on India - Market size and forecast 2025-2030 ($ million)
Chart on India - Year-over-year growth 2025-2030 (%)
Data Table on India - Year-over-year growth 2025-2030 (%)

12.3.4 South Korea - Market size and forecast 2025-2030

Chart on South Korea - Market size and forecast 2025-2030 ($ million)
Data Table on South Korea - Market size and forecast 2025-2030 ($ million)
Chart on South Korea - Year-over-year growth 2025-2030 (%)
Data Table on South Korea - Year-over-year growth 2025-2030 (%)

12.3.5 Australia - Market size and forecast 2025-2030

Chart on Australia - Market size and forecast 2025-2030 ($ million)
Data Table on Australia - Market size and forecast 2025-2030 ($ million)
Chart on Australia - Year-over-year growth 2025-2030 (%)
Data Table on Australia - Year-over-year growth 2025-2030 (%)

12.3.6 Indonesia - Market size and forecast 2025-2030

Chart on Indonesia - Market size and forecast 2025-2030 ($ million)
Data Table on Indonesia - Market size and forecast 2025-2030 ($ million)
Chart on Indonesia - Year-over-year growth 2025-2030 (%)
Data Table on Indonesia - Year-over-year growth 2025-2030 (%)

12.4 North America - Market size and forecast 2025-2030

Chart on North America - Market size and forecast 2025-2030 ($ million)
Data Table on North America - Market size and forecast 2025-2030 ($ million)
Chart on North America - Year-over-year growth 2025-2030 (%)
Data Table on North America - Year-over-year growth 2025-2030 (%)
Chart on Regional Comparison - North America
Data Table on Regional Comparison - North America

12.4.1 US - Market size and forecast 2025-2030

Chart on US - Market size and forecast 2025-2030 ($ million)
Data Table on US - Market size and forecast 2025-2030 ($ million)
Chart on US - Year-over-year growth 2025-2030 (%)
Data Table on US - Year-over-year growth 2025-2030 (%)

12.4.2 Canada - Market size and forecast 2025-2030

Chart on Canada - Market size and forecast 2025-2030 ($ million)
Data Table on Canada - Market size and forecast 2025-2030 ($ million)
Chart on Canada - Year-over-year growth 2025-2030 (%)
Data Table on Canada - Year-over-year growth 2025-2030 (%)

12.4.3 Mexico - Market size and forecast 2025-2030

Chart on Mexico - Market size and forecast 2025-2030 ($ million)
Data Table on Mexico - Market size and forecast 2025-2030 ($ million)
Chart on Mexico - Year-over-year growth 2025-2030 (%)
Data Table on Mexico - Year-over-year growth 2025-2030 (%)

12.5 Europe - Market size and forecast 2025-2030

Chart on Europe - Market size and forecast 2025-2030 ($ million)
Data Table on Europe - Market size and forecast 2025-2030 ($ million)
Chart on Europe - Year-over-year growth 2025-2030 (%)
Data Table on Europe - Year-over-year growth 2025-2030 (%)
Chart on Regional Comparison - Europe
Data Table on Regional Comparison - Europe

12.5.1 Germany - Market size and forecast 2025-2030

Chart on Germany - Market size and forecast 2025-2030 ($ million)
Data Table on Germany - Market size and forecast 2025-2030 ($ million)
Chart on Germany - Year-over-year growth 2025-2030 (%)
Data Table on Germany - Year-over-year growth 2025-2030 (%)

12.5.2 France - Market size and forecast 2025-2030

Chart on France - Market size and forecast 2025-2030 ($ million)
Data Table on France - Market size and forecast 2025-2030 ($ million)
Chart on France - Year-over-year growth 2025-2030 (%)
Data Table on France - Year-over-year growth 2025-2030 (%)

12.5.3 UK - Market size and forecast 2025-2030

Chart on UK - Market size and forecast 2025-2030 ($ million)
Data Table on UK - Market size and forecast 2025-2030 ($ million)
Chart on UK - Year-over-year growth 2025-2030 (%)
Data Table on UK - Year-over-year growth 2025-2030 (%)

12.5.4 Italy - Market size and forecast 2025-2030

Chart on Italy - Market size and forecast 2025-2030 ($ million)
Data Table on Italy - Market size and forecast 2025-2030 ($ million)
Chart on Italy - Year-over-year growth 2025-2030 (%)
Data Table on Italy - Year-over-year growth 2025-2030 (%)

12.5.5 Spain - Market size and forecast 2025-2030

Chart on Spain - Market size and forecast 2025-2030 ($ million)
Data Table on Spain - Market size and forecast 2025-2030 ($ million)
Chart on Spain - Year-over-year growth 2025-2030 (%)
Data Table on Spain - Year-over-year growth 2025-2030 (%)

12.5.6 The Netherlands - Market size and forecast 2025-2030

Chart on The Netherlands - Market size and forecast 2025-2030 ($ million)
Data Table on The Netherlands - Market size and forecast 2025-2030 ($ million)
Chart on The Netherlands - Year-over-year growth 2025-2030 (%)
Data Table on The Netherlands - Year-over-year growth 2025-2030 (%)

12.6 South America - Market size and forecast 2025-2030

Chart on South America - Market size and forecast 2025-2030 ($ million)
Data Table on South America - Market size and forecast 2025-2030 ($ million)
Chart on South America - Year-over-year growth 2025-2030 (%)
Data Table on South America - Year-over-year growth 2025-2030 (%)
Chart on Regional Comparison - South America
Data Table on Regional Comparison - South America

12.6.1 Brazil - Market size and forecast 2025-2030

Chart on Brazil - Market size and forecast 2025-2030 ($ million)
Data Table on Brazil - Market size and forecast 2025-2030 ($ million)
Chart on Brazil - Year-over-year growth 2025-2030 (%)
Data Table on Brazil - Year-over-year growth 2025-2030 (%)

12.6.2 Argentina - Market size and forecast 2025-2030

Chart on Argentina - Market size and forecast 2025-2030 ($ million)
Data Table on Argentina - Market size and forecast 2025-2030 ($ million)
Chart on Argentina - Year-over-year growth 2025-2030 (%)
Data Table on Argentina - Year-over-year growth 2025-2030 (%)

12.6.3 Chile - Market size and forecast 2025-2030

Chart on Chile - Market size and forecast 2025-2030 ($ million)
Data Table on Chile - Market size and forecast 2025-2030 ($ million)
Chart on Chile - Year-over-year growth 2025-2030 (%)
Data Table on Chile - Year-over-year growth 2025-2030 (%)

12.7 Middle East and Africa - Market size and forecast 2025-2030

Chart on Middle East and Africa - Market size and forecast 2025-2030 ($ million)
Data Table on Middle East and Africa - Market size and forecast 2025-2030 ($ million)
Chart on Middle East and Africa - Year-over-year growth 2025-2030 (%)
Data Table on Middle East and Africa - Year-over-year growth 2025-2030 (%)
Chart on Regional Comparison - Middle East and Africa
Data Table on Regional Comparison - Middle East and Africa

12.7.1 Saudi Arabia - Market size and forecast 2025-2030

Chart on Saudi Arabia - Market size and forecast 2025-2030 ($ million)
Data Table on Saudi Arabia - Market size and forecast 2025-2030 ($ million)
Chart on Saudi Arabia - Year-over-year growth 2025-2030 (%)
Data Table on Saudi Arabia - Year-over-year growth 2025-2030 (%)

12.7.2 UAE - Market size and forecast 2025-2030

Chart on UAE - Market size and forecast 2025-2030 ($ million)
Data Table on UAE - Market size and forecast 2025-2030 ($ million)
Chart on UAE - Year-over-year growth 2025-2030 (%)
Data Table on UAE - Year-over-year growth 2025-2030 (%)

12.7.3 South Africa - Market size and forecast 2025-2030

Chart on South Africa - Market size and forecast 2025-2030 ($ million)
Data Table on South Africa - Market size and forecast 2025-2030 ($ million)
Chart on South Africa - Year-over-year growth 2025-2030 (%)
Data Table on South Africa - Year-over-year growth 2025-2030 (%)

12.7.4 Turkey - Market size and forecast 2025-2030

Chart on Turkey - Market size and forecast 2025-2030 ($ million)
Data Table on Turkey - Market size and forecast 2025-2030 ($ million)
Chart on Turkey - Year-over-year growth 2025-2030 (%)
Data Table on Turkey - Year-over-year growth 2025-2030 (%)

12.7.5 Israel - Market size and forecast 2025-2030

Chart on Israel - Market size and forecast 2025-2030 ($ million)
Data Table on Israel - Market size and forecast 2025-2030 ($ million)
Chart on Israel - Year-over-year growth 2025-2030 (%)
Data Table on Israel - Year-over-year growth 2025-2030 (%)

12.8 Market opportunity by geography

Market opportunity by geography ($ million)
Data Tables on Market opportunity by geography ($ million)

13. Drivers, Challenges, and Opportunity

13.1 Market drivers

Increasing demand for electric mobility
Technological innovation in cell chemistry
Expansion of energy storage sector

13.2 Market challenges

Supply chain stability and raw material procurement challenges
Manufacturing complexity and scale up constraints
Safety and thermal management challenges

13.3 Impact of drivers and challenges

Impact of drivers and challenges in 2025 and 2030

13.4 Market opportunities

Adoption of large format 46 series cylindrical cells
Advancements in silicon anode technology
Integration of sustainability and circular economy principles

14. Competitive Landscape

14.1 Overview

14.2

Overview on criticality of inputs and factors of differentiation

14.3 Landscape disruption

Overview on factors of disruption

14.4 Industry risks

Impact of key risks on business

15. Competitive Analysis

15.1 Companies profiled

Companies covered

15.2 Company ranking index

15.3 Market positioning of companies

Matrix on companies position and classification

15.4 CBAK Energy Technology Inc.

CBAK Energy Technology Inc. - Overview
CBAK Energy Technology Inc. - Product / Service
CBAK Energy Technology Inc. - Key offerings
SWOT

15.5 Contemporary Amperex Ltd.

Contemporary Amperex Ltd. - Overview
Contemporary Amperex Ltd. - Business segments
Contemporary Amperex Ltd. - Key news
Contemporary Amperex Ltd. - Key offerings
Contemporary Amperex Ltd. - Segment focus
SWOT

15.6 E One Moli Energy Corp.

E One Moli Energy Corp. - Overview
E One Moli Energy Corp. - Product / Service
E One Moli Energy Corp. - Key offerings
SWOT

15.7 EVE Energy Co. Ltd.

EVE Energy Co. Ltd. - Overview
EVE Energy Co. Ltd. - Business segments
EVE Energy Co. Ltd. - Key offerings
EVE Energy Co. Ltd. - Segment focus
SWOT

15.8 Gotion High tech Co. Ltd.

Gotion High tech Co. Ltd. - Overview
Gotion High tech Co. Ltd. - Business segments
Gotion High tech Co. Ltd. - Key offerings
Gotion High tech Co. Ltd. - Segment focus
SWOT

15.9 LG Electronics Inc.

LG Electronics Inc. - Overview
LG Electronics Inc. - Business segments
LG Electronics Inc. - Key offerings
LG Electronics Inc. - Segment focus
SWOT

15.10 Murata Manufacturing Co. Ltd.

Murata Manufacturing Co. Ltd. - Overview
Murata Manufacturing Co. Ltd. - Business segments
Murata Manufacturing Co. Ltd. - Key news
Murata Manufacturing Co. Ltd. - Key offerings
Murata Manufacturing Co. Ltd. - Segment focus
SWOT

15.11 Northvolt AB

Northvolt AB - Overview
Northvolt AB - Product / Service
Northvolt AB - Key offerings
SWOT

15.12 OptimumNano Energy Co. Ltd.

OptimumNano Energy Co. Ltd. - Overview
OptimumNano Energy Co. Ltd. - Product / Service
OptimumNano Energy Co. Ltd. - Key offerings
SWOT

15.13 Panasonic Holdings Corp.

Panasonic Holdings Corp. - Overview
Panasonic Holdings Corp. - Business segments
Panasonic Holdings Corp. - Key news
Panasonic Holdings Corp. - Key offerings
Panasonic Holdings Corp. - Segment focus
SWOT

15.14 Samsung Electronics Co. Ltd.

Samsung Electronics Co. Ltd. - Overview
Samsung Electronics Co. Ltd. - Business segments
Samsung Electronics Co. Ltd. - Key news
Samsung Electronics Co. Ltd. - Key offerings
Samsung Electronics Co. Ltd. - Segment focus
SWOT

15.15 Sunwoda Electronic Co. Ltd.

Sunwoda Electronic Co. Ltd. - Overview
Sunwoda Electronic Co. Ltd. - Business segments
Sunwoda Electronic Co. Ltd. - Key offerings
Sunwoda Electronic Co. Ltd. - Segment focus
SWOT

15.16 Tadiran Batteries GmbH

Tadiran Batteries GmbH - Overview
Tadiran Batteries GmbH - Product / Service
Tadiran Batteries GmbH - Key offerings
SWOT

15.17 Tesla Inc.

Tesla Inc. - Overview
Tesla Inc. - Business segments
Tesla Inc. - Key news
Tesla Inc. - Key offerings
Tesla Inc. - Segment focus
SWOT

15.18 VARTA AG

VARTA AG - Overview
VARTA AG - Business segments
VARTA AG - Key offerings
VARTA AG - Segment focus
SWOT

16. Appendix

16.1 Scope of the report

Market definition
Objectives
Notes and caveats

16.2 Inclusions and exclusions checklist

Inclusions checklist
Exclusions checklist

16.3 Currency conversion rates for US$

16.4 Research methodology

16.5 Data procurement

Information sources

16.6 Data validation

16.7 Validation techniques employed for market sizing

16.8 Data synthesis

16.9 360 degree market analysis

16.10 List of abbreviations

Research Methodology

Technavio presents a detailed picture of the market by way of study, synthesis, and summation of data from multiple sources. The analysts have presented the various facets of the market with a particular focus on identifying the key industry influencers. The data thus presented is comprehensive, reliable, and the result of extensive research, both primary and secondary.

INFORMATION SOURCES

Primary sources

  • Manufacturers and suppliers
  • Channel partners
  • Industry experts
  • Strategic decision makers

Secondary sources

  • Industry journals and periodicals
  • Government data
  • Financial reports of key industry players
  • Historical data
  • Press releases

DATA ANALYSIS

Data Synthesis

  • Collation of data
  • Estimation of key figures
  • Analysis of derived insights

Data Validation

  • Triangulation with data models
  • Reference against proprietary databases
  • Corroboration with industry experts

REPORT WRITING

Qualitative

  • Market drivers
  • Market challenges
  • Market trends
  • Five forces analysis

Quantitative

  • Market size and forecast
  • Market segmentation
  • Geographical insights
  • Competitive landscape

Interested in this report?

Get your sample now to see our research methodology and insights!

Download Now

Frequently Asked Questions

Cylindrical Lithium-ion Battery market growth will increase by USD 13972.9 million during 2026-2030.

The Cylindrical Lithium-ion Battery market is expected to grow at a CAGR of 7% during 2026-2030.

Cylindrical Lithium-ion Battery market is segmented by Application (Automotive, Industrial, Others) Type (Lithium nickel manganese cobalt, Lithium titanate, Lithium iron phosphate, Lithium cobalt oxide) Capacity (Between 3000 to 10000 mAh, Below 3000 mAh, Above 10000 mAh)

CBAK Energy Technology Inc., Contemporary Amperex Ltd., E One Moli Energy Corp., EVE Energy Co. Ltd., Gotion High tech Co. Ltd., LG Electronics Inc., Lithion Battery Inc., Lithium Werks, Murata Manufacturing Co. Ltd., Nanograf Corp., Northvolt AB, OptimumNano Energy Co. Ltd., Panasonic Holdings Corp., Samsung Electronics Co. Ltd., Shenzhen BAK Battery Co. Ltd., Sunwoda Electronic Co. Ltd., Tadiran Batteries GmbH, Tesla Inc., TianJin Lishen Battery Ltd., VARTA AG are a few of the key vendors in the Cylindrical Lithium-ion Battery market.

APAC will register the highest growth rate of 58% among the other regions. Therefore, the Cylindrical Lithium-ion Battery market in APAC is expected to garner significant business opportunities for the vendors during the forecast period.

China, Japan, India, South Korea, Australia, Indonesia, US, Canada, Mexico, Germany, France, UK, Italy, Spain, The Netherlands, Brazil, Argentina, Chile, Saudi Arabia, UAE, South Africa, Turkey, Israel

  • Increasing demand for electric mobility is the driving factor this market.

The Cylindrical Lithium-ion Battery market vendors should focus on grabbing business opportunities from the Application segment as it accounted for the largest market share in the base year.