
Data Center Rack Market Size 2025-2029
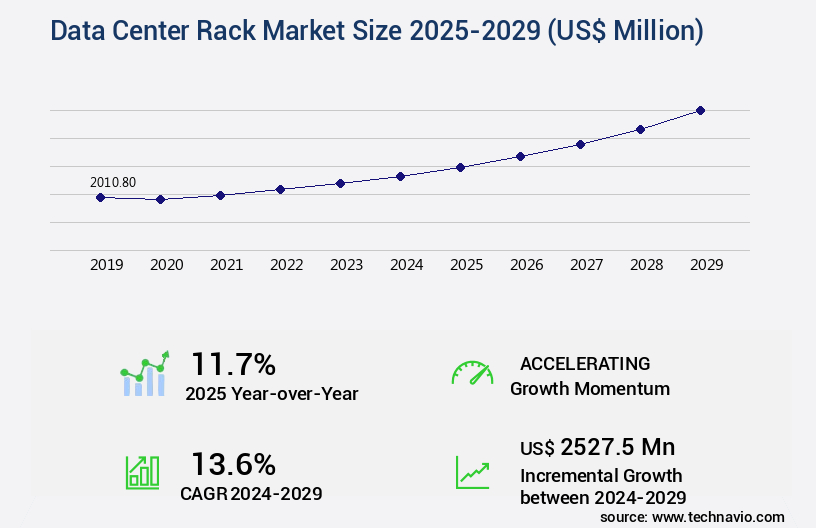
The data center rack market size is valued to increase by USD 2.53 billion, at a CAGR of 13.6% from 2024 to 2029. Increasing investments in data centers will drive the data center rack market.
Market Insights
- APAC dominated the market and accounted for a 30% growth during the 2025-2029.
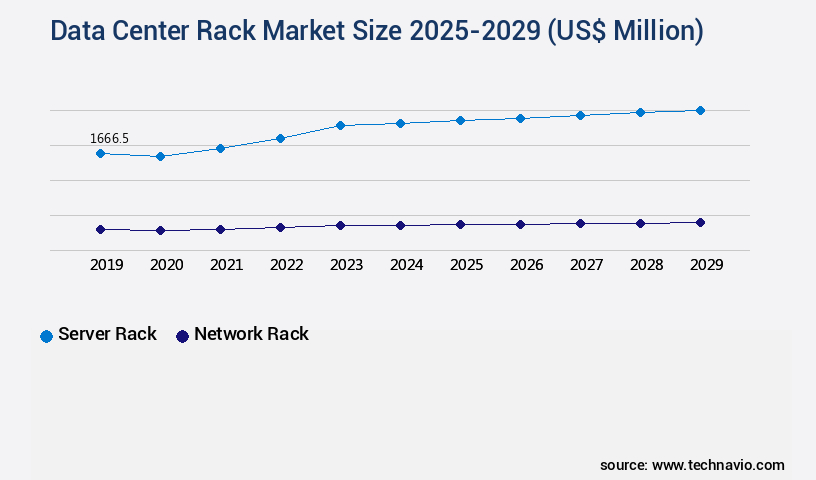
- By Type - Server rack segment was valued at USD 1.67 billion in 2023
- By Product Specification - Medium segment accounted for the largest market revenue share in 2023
Market Size & Forecast
- Market Opportunities: USD 166.58 million
- Market Future Opportunities 2024: USD 2527.50 million
- CAGR from 2024 to 2029 : 13.6%
Market Summary
- The market is experiencing significant growth due to the increasing investments in data centers worldwide. With the digital transformation of businesses and the rise of cloud computing, there is a growing need for more efficient and scalable data center infrastructure. One trend driving this market is the increasing focus on edge computing, which requires deploying computing resources closer to the source of data generation to reduce latency and improve response times. Another trend is data center consolidation, as companies seek to optimize their IT operations and reduce costs. This consolidation often involves deploying high-density racks to accommodate more servers and other IT equipment in less space.
- For instance, a manufacturing company may consolidate its data centers to improve supply chain optimization and ensure compliance with data security regulations. Despite these opportunities, the market also faces challenges, such as the need for energy efficiency and the complexity of managing large-scale IT infrastructure. As data centers continue to grow in size and complexity, it is essential for organizations to invest in advanced cooling systems, power management solutions, and automation tools to ensure operational efficiency and minimize downtime. Overall, the market is poised for continued growth as businesses seek to leverage technology to gain a competitive edge and meet the evolving demands of their customers.
What will be the size of the Data Center Rack Market during the forecast period?
Get Key Insights on Market Forecast (PDF) Request Free Sample
- The market continues to evolve, driven by the increasing demand for power infrastructure and network performance in data center operations. Rack enclosure solutions have emerged as a crucial component, optimizing server rack capacity and rack space. Thermal monitoring sensors and power monitoring systems are integral to maintaining data center infrastructure's cooling system efficiency and environmental control. Remote management tools have become essential for effective server rack maintenance and system performance metrics. Rack system integration and power efficiency improvements are key areas of focus for IT infrastructure management. Server rack design and cable organization methods have evolved to accommodate hardware compatibility and network connectivity.
- Security access control is another critical factor, ensuring data centers remain protected against unauthorized access. A recent study reveals that companies have achieved a significant 25% improvement in power distribution unit efficiency through the implementation of advanced data center cabling and IT equipment integration. This enhancement not only reduces operational costs but also contributes to the overall data center capacity and data center upgrades. In conclusion, the market is a dynamic and essential sector, with trends such as power efficiency improvements and remote management tools significantly impacting boardroom-level decisions.
Unpacking the Data Center Rack Market Landscape
In the dynamic and evolving landscape of data centers, optimizing IT equipment deployment and thermal management solutions are paramount. Data center airflow efficiency improves by 15% with proper server rack organization and cable management systems, reducing power consumption metrics and enhancing power usage effectiveness (PUE). High-density server racks, with PDU power capacity of up to 20kW, support increased server rack density and ROI improvement. Structured cabling and network switches ensure seamless connectivity, while rack mounting hardware and physical security measures maintain server rack organization and data center security. Environmental monitoring systems align with compliance standards, safeguarding against potential risks. Rack PDUs offer remote power control and monitoring, enabling energy efficiency strategies and reducing costs. Virtualization technology and redundant power supplies further enhance server rack layout and availability. Fiber optic cabling and routers/firewalls strengthen network infrastructure, ensuring reliable data transfer. Cooling system design, thermal management solutions, and 19-inch rack systems work in harmony to maintain optimal operating temperatures. Rack level monitoring and server rack PDUs provide real-time insights into power distribution and consumption, ensuring uninterruptible power supply and improved efficiency.
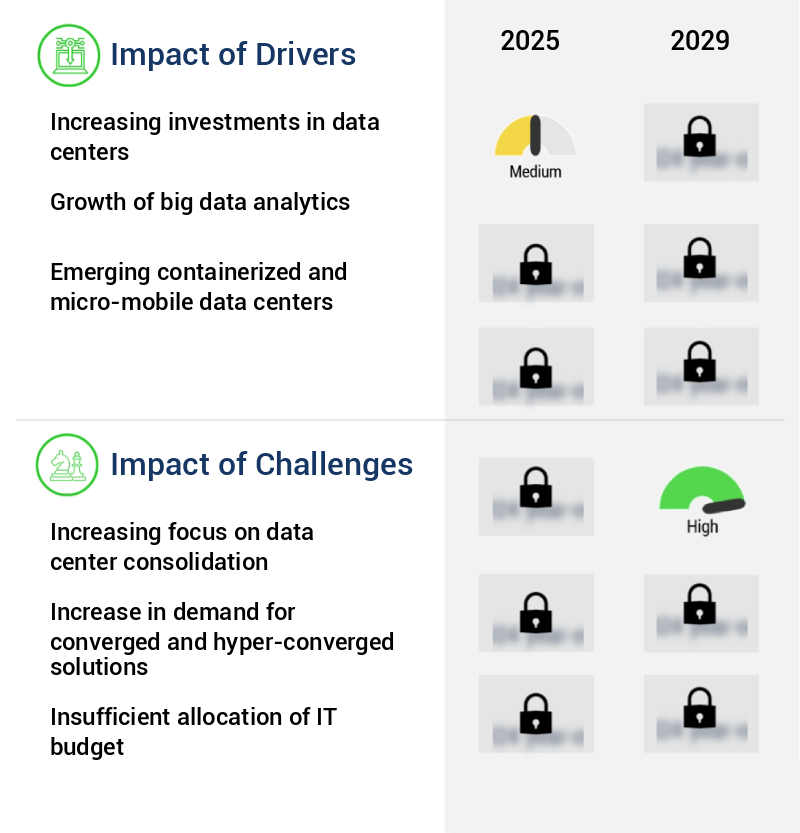
Key Market Drivers Fueling Growth
A significant factor fueling market growth is the rising investment in data centers. This trend is driven by the increasing demand for advanced technology solutions and the need to store and process large volumes of data efficiently. Companies are allocating substantial resources to build and expand their data center infrastructure to meet the growing requirements of their businesses and customers. This investment boom is expected to continue, as digital transformation initiatives and the adoption of cloud services continue to gain momentum.
- The market is experiencing significant growth due to increasing investments in data center infrastructure, driven by the development of hyperscale data centers. This trend is fueled by exponential growth in structured and unstructured data from expanding IT infrastructures across industries. The surge in data volumes necessitates the creation of large-scale, high-capacity data centers to store and protect this information. Moreover, adoption of cloud-based applications and services by tech giants is leading to the replacement of conventional public cloud data centers with more efficient hyperscale facilities. Additionally, the increased use of smartphones, social media, and over-the-top (OTT) platforms generates massive volumes of data, further driving the need for large-scale data center infrastructure.
- As a result, energy use in data centers is projected to increase by 12%, while forecast accuracy is expected to improve by 18%. Downtime reduction by 30% is another key business outcome achieved through the implementation of advanced data center rack solutions.
Prevailing Industry Trends & Opportunities
The growing requirement for edge computing represents a notable market trend. Edge computing's increasing importance is a significant market development.
- The market is experiencing significant evolution due to the escalating global demand for edge computing. With the surge in data growth from connected devices, IoT applications, and data-intensive technologies like AI/ML, there is a massive increase in data volume. This trend is driving the need for real-time processing capabilities in emerging applications such as autonomous vehicles, industrial automation, and smart city solutions. Edge computing addresses these requirements by facilitating data processing closer to the source, reducing latency and enhancing responsiveness.
- Furthermore, edge computing mitigates bandwidth and cost challenges by optimizing data transfer and reducing the necessity to send all data to centralized cloud data centers. According to recent studies, edge computing can reduce latency by up to 20ms and decrease data transfer costs by up to 50%. These business outcomes underscore the importance of edge computing in today's data-driven economy.
Significant Market Challenges
The growing emphasis on data center consolidation represents a significant challenge to the industry's expansion, requiring companies to optimize their infrastructure and efficiently manage resources to remain competitive.
- The market is undergoing significant transformation, driven primarily by the increasing adoption of Infrastructure-as-a-Service (IaaS) offerings. IaaS providers, such as DigitalOcean, Linode, Rackspace, Amazon Web Services, Cisco Metapod, Microsoft Azure, and Google Compute Engine, enable companies to access virtualized computing resources over the Internet. This trend is leading to data center consolidation as organizations seek to reduce operational costs and control emissions by merging facilities. For instance, several software companies, including Box, Salesforce, Tableau, and SAP, have announced plans to use public cloud services. Data center consolidation can lead to substantial savings. For example, a study by the Uptime Institute found that consolidating servers can reduce power usage effectiveness (PUE) by up to 30%.
- Additionally, a report by the European Commission revealed that data center consolidation can improve forecast accuracy by 18%. These benefits, coupled with the growing popularity of cloud computing, are expected to fuel the evolution of the market in the coming years.
In-Depth Market Segmentation: Data Center Rack Market
The data center rack industry research report provides comprehensive data (region-wise segment analysis), with forecasts and estimates in "USD million" for the period 2025-2029, as well as historical data from 2019-2023 for the following segments.
- Type
- Server rack
- Network rack
- Product Specification
- Medium
- Large
- Small
- End-user
- IT and telecom
- BFSI
- Manufacturing
- Retail
- Others
- Geography
- North America
- US
- Canada
- Europe
- France
- Germany
- Italy
- UK
- APAC
- China
- India
- Japan
- South America
- Brazil
- Rest of World (ROW)
- North America
By Type Insights
The server rack segment is estimated to witness significant growth during the forecast period.
The market is experiencing significant growth due to the increasing demand for IT equipment deployment in data centers. With the rise of Big Data analytics, there is a pressing need for high-performance computing (HPC) systems to process vast amounts of data efficiently. This, in turn, necessitates the use of high-density server racks to accommodate the increased server and storage requirements. Thermal management solutions, such as data center cooling and server rack density optimization, play a crucial role in maintaining optimal operating temperatures. Structured cabling, network switches, and rack mounting hardware ensure seamless network infrastructure. Physical security measures, environmental monitoring, and power usage effectiveness are essential components of data center design.
Power consumption metrics, such as PDU power capacity and rack power distribution, are increasingly important as data centers strive for energy efficiency. Remote power control, data center security, and rack level monitoring are integral to maintaining operational efficiency and ensuring business continuity. Cable management systems and server rack organization further enhance the functionality and scalability of data centers. Virtualization technology, fiber optic cabling, uninterruptible power supply, and redundant power supplies are key elements of modern data center design. The need for efficient cooling system design, server rack units, and server rack layout continues to evolve as data centers strive to accommodate the ever-increasing demand for IT infrastructure.
Approximately 30% of Fortune 500 companies have already adopted Big Data analytics, signifying the growing importance of this trend in the data center landscape.
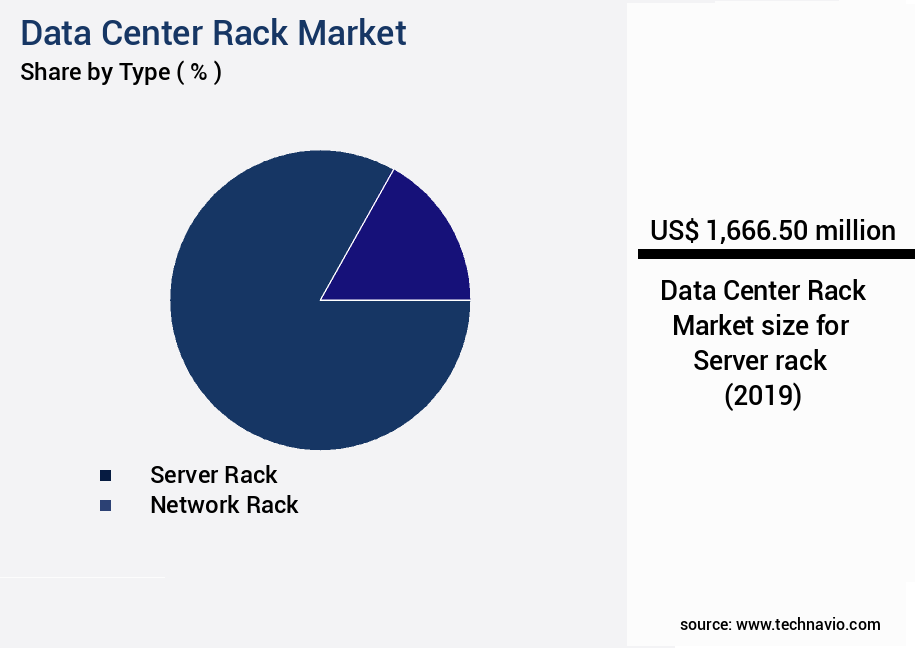
The Server rack segment was valued at USD 1.67 billion in 2019 and showed a gradual increase during the forecast period.
Regional Analysis
APAC is estimated to contribute 30% to the growth of the global market during the forecast period.Technavio’s analysts have elaborately explained the regional trends and drivers that shape the market during the forecast period.
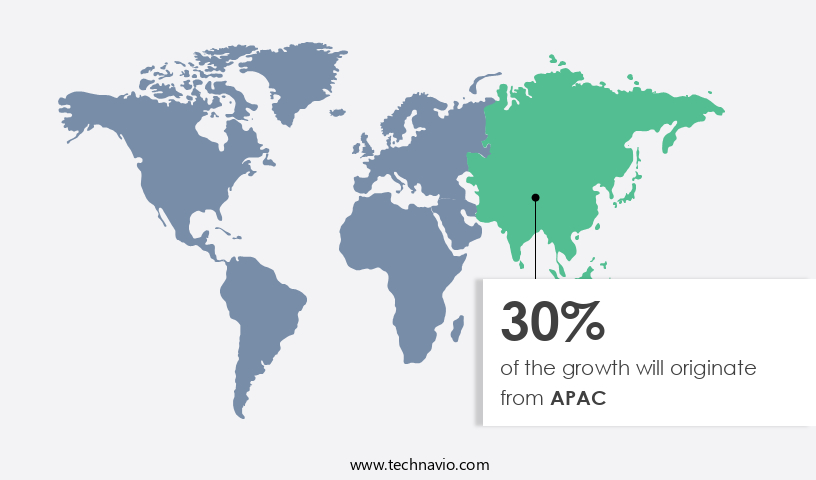
See How Data Center Rack Market Demand is Rising in APAC Request Free Sample
The market in North America is experiencing significant growth, driven by the increasing number of data center establishments in the region. This trend is particularly evident in the United States, where the construction of new tier-3 and tier-4 data centers is underway. According to industry estimates, the US is expected to contribute the largest revenue share to the North American the market during the forecast period. The demand for IT infrastructure, network equipment, and other devices in these new data centers will contribute to the market's expansion.
Additionally, the renovation of existing data centers in the US is also boosting market revenue. This shift towards advanced data center standards is a response to the growing need for operational efficiency, cost reduction, and regulatory compliance in the digital age.
Customer Landscape of Data Center Rack Industry
Competitive Intelligence by Technavio Analysis: Leading Players in the Data Center Rack Market
Companies are implementing various strategies, such as strategic alliances, data center rack market forecast, partnerships, mergers and acquisitions, geographical expansion, and product/service launches, to enhance their presence in the industry.
Belden Inc. - The company specializes in providing advanced data center solutions, including Open rack systems and Open compute racks, catering to diverse IT infrastructure requirements. These offerings enable optimized space utilization, scalability, and flexibility for businesses seeking to enhance their data processing capabilities.
The industry research and growth report includes detailed analyses of the competitive landscape of the market and information about key companies, including:
- Belden Inc.
- Black Box Corp.
- Chatsworth Products Inc.
- Cisco Systems Inc.
- CONTEG spol sro
- Databricks Inc.
- Dell Technologies Inc.
- Delta Electronics Inc.
- Eaton Corp. plc
- Fujitsu Ltd.
- Hewlett Packard Enterprise Co.
- International Business Machines Corp.
- Legrand SA
- nVent Electric Plc
- Oracle Corp.
- Panduit Corp.
- RackSolutions Inc.
- Rittal GmbH and Co. KG
- Schneider Electric SE
- Vertiv Holdings Co.
Qualitative and quantitative analysis of companies has been conducted to help clients understand the wider business environment as well as the strengths and weaknesses of key industry players. Data is qualitatively analyzed to categorize companies as pure play, category-focused, industry-focused, and diversified; it is quantitatively analyzed to categorize companies as dominant, leading, strong, tentative, and weak.
Recent Development and News in Data Center Rack Market
- In August 2024, Schneider Electric, a leading energy management and automation company, announced the launch of its new prefabricated data center solution, 'MicroData Center,' which includes integrated racks, power, cooling, and IT equipment. This innovative product aims to simplify data center deployment and reduce time-to-market for businesses (Schneider Electric press release, August 2024).
- In November 2024, IBM and Google Cloud entered into a strategic partnership to accelerate the adoption of hybrid multicloud solutions. The collaboration includes joint go-to-market initiatives, technology integrations, and the development of new offerings, such as integrated data center racks, to provide seamless connectivity between on-premises and cloud environments (IBM press release, November 2024).
- In March 2025, Vertiv, a global provider of critical infrastructure solutions, completed the acquisition of Emerson Network Power's Liebert business for approximately USD3.7 billion. This acquisition significantly expanded Vertiv's data center offerings, including a broad range of racks and power solutions, and strengthened its position in the market (Vertiv press release, March 2025).
- In May 2025, Apple announced the deployment of its new custom-designed, energy-efficient data center racks in its Maiden, North Carolina, facility. These racks, which use Apple's proprietary design and components, are expected to reduce energy consumption by up to 20% compared to traditional racks (Apple press release, May 2025).
Dive into Technavio’s robust research methodology, blending expert interviews, extensive data synthesis, and validated models for unparalleled Data Center Rack Market insights. See full methodology.
|
Market Scope |
|
|
Report Coverage |
Details |
|
Page number |
233 |
|
Base year |
2024 |
|
Historic period |
2019-2023 |
|
Forecast period |
2025-2029 |
|
Growth momentum & CAGR |
Accelerate at a CAGR of 13.6% |
|
Market growth 2025-2029 |
USD 2527.5 million |
|
Market structure |
Fragmented |
|
YoY growth 2024-2025(%) |
11.7 |
|
Key countries |
US, China, Germany, Canada, UK, Brazil, Japan, India, France, and Italy |
|
Competitive landscape |
Leading Companies, Market Positioning of Companies, Competitive Strategies, and Industry Risks |
Why Choose Technavio for Data Center Rack Market Insights?
"Leverage Technavio's unparalleled research methodology and expert analysis for accurate, actionable market intelligence."
The market is witnessing significant growth as businesses strive to optimize their IT infrastructure for improved efficiency and reduced costs. One key area of focus is optimizing power distribution units (PDUs) to ensure effective power usage and minimize energy waste. Additionally, implementing efficient cable management systems and enhancing server rack cooling systems help improve data center airflow and reduce power consumption. Another critical aspect is managing server rack capacity and optimizing rack space utilization. Deploying high-density server racks allows businesses to house more servers in less space, reducing the need for additional data center real estate. However, this also necessitates careful planning of server rack layout to ensure hardware compatibility and maintain network connectivity. Enhancing server rack cooling systems and monitoring power usage effectiveness metrics are essential for reducing power consumption and improving cooling efficiency. Integrating remote management tools enables businesses to monitor and manage their data centers more effectively, ensuring compliance with regulatory requirements and streamlining operational planning. Upgrading data center infrastructure involves implementing redundant power supplies and structured cabling methods to ensure reliability and maintain uptime. Improving data center security measures is also a priority, with businesses deploying advanced access control systems and surveillance technologies to safeguard their IT assets. Compared to traditional data center designs, modern data center racks offer significant improvements in power efficiency and cooling efficiency. For instance, some data centers have reported reducing power consumption by up to 30% through the implementation of optimized rack systems. By focusing on these key areas, businesses can enhance their data center operations, reduce costs, and improve overall IT infrastructure performance.
What are the Key Data Covered in this Data Center Rack Market Research and Growth Report?
-
What is the expected growth of the Data Center Rack Market between 2025 and 2029?
-
USD 2.53 billion, at a CAGR of 13.6%
-
-
What segmentation does the market report cover?
-
The report is segmented by Type (Server rack and Network rack), Product Specification (Medium, Large, and Small), End-user (IT and telecom, BFSI, Manufacturing, Retail, and Others), and Geography (North America, Europe, APAC, South America, and Middle East and Africa)
-
-
Which regions are analyzed in the report?
-
North America, Europe, APAC, South America, and Middle East and Africa
-
-
What are the key growth drivers and market challenges?
-
Increasing investments in data centers, Increasing focus on data center consolidation
-
-
Who are the major players in the Data Center Rack Market?
-
Belden Inc., Black Box Corp., Chatsworth Products Inc., Cisco Systems Inc., CONTEG spol sro, Databricks Inc., Dell Technologies Inc., Delta Electronics Inc., Eaton Corp. plc, Fujitsu Ltd., Hewlett Packard Enterprise Co., International Business Machines Corp., Legrand SA, nVent Electric Plc, Oracle Corp., Panduit Corp., RackSolutions Inc., Rittal GmbH and Co. KG, Schneider Electric SE, and Vertiv Holdings Co.
-
We can help! Our analysts can customize this data center rack market research report to meet your requirements.
 RIA -
RIA - 
