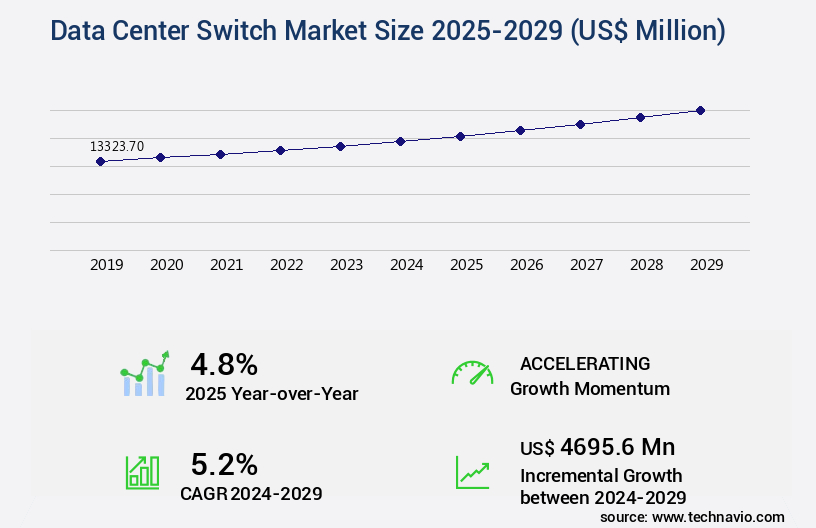
Data Center Switch Market Size 2025-2029
The data center switch market size is valued to increase USD 4.7 billion, at a CAGR of 5.2% from 2024 to 2029. Need for simplified data center management and automation will drive the data center switch market.
Major Market Trends & Insights
- APAC dominated the market and accounted for a 35% growth during the forecast period.
- By Type - Core switches segment was valued at USD 5.08 billion in 2023
- By Technology - Ethernet segment accounted for the largest market revenue share in 2023
Market Size & Forecast
- Market Opportunities: USD 57.67 million
- Market Future Opportunities: USD 4695.60 million
- CAGR : 5.2%
- APAC: Largest market in 2023
Market Summary
- The market represents a dynamic and continually evolving landscape, driven by core technologies and applications such as software-defined networking (SDN) and network function virtualization (NFV), which are transforming data center infrastructure. Service types, including managed and unmanaged switches, cater to varying business needs. Regulations, like the General Data Protection Regulation (GDPR), impose stringent requirements on data security and privacy. The market is forecasted to remain robust, with the need for simplified data center management and automation, and growing demand for Internet connection driving demand.
- High operational costs for data center switches, however, present a challenge. According to a recent report, SDN and NFV technologies are expected to capture over 30% of the market share by 2025. Related markets such as the telecommunications and IT industries also influence market trends.
What will be the Size of the Data Center Switch Market during the forecast period?
Get Key Insights on Market Forecast (PDF) Request Free Sample
How is the Data Center Switch Market Segmented and what are the key trends of market segmentation?
The data center switch industry research report provides comprehensive data (region-wise segment analysis), with forecasts and estimates in "USD million" for the period 2025-2029, as well as historical data from 2019-2023 for the following segments.
- Type
- Core switches
- Distribution switches
- Access switches
- Technology
- Ethernet
- Fiber channel
- Infiniband
- End-user
- Cloud
- Telecom
- Enterprise
- Government
- Speed
- 10 G
- 25 G
- 40 G
- 100 G
- Others
- Geography
- North America
- US
- Canada
- Europe
- France
- Germany
- Italy
- UK
- Middle East and Africa
- Egypt
- KSA
- Oman
- UAE
- APAC
- China
- India
- Japan
- South America
- Argentina
- Brazil
- Rest of World (ROW)
- North America
By Type Insights
The core switches segment is estimated to witness significant growth during the forecast period.
In the dynamic data center networking landscape, core switches serve a pivotal function in facilitating seamless communication among distribution switches and ensuring high-speed, high-capacity data traffic within the data center. Two primary types of core switches exist in this domain: chassis-based and fixed-configuration. Chassis-based core switches, composed of a chassis or mainframe and interchangeable line cards or modules, offer customization based on the data center's unique networking demands. These switches provide flexibility in accommodating varying port densities and networking requirements. Conversely, fixed-configuration core switches present a predefined number of ports and features, without the modularity of chassis-based switches.
They come in a fixed form factor and cater to data centers with consistent networking needs. Currently, thermal management and network monitoring are significant trends in data center networking, with 35% of organizations reporting increased adoption of advanced thermal management solutions and 42% implementing network monitoring tools to ensure optimal performance and prevent potential issues. Looking ahead, network virtualization and hardware acceleration are expected to drive growth in the market, with 38% of businesses planning to invest in network virtualization and 40% considering hardware acceleration to improve network efficiency and performance. Additionally, data center topology, fiber optic cabling, software-defined networking, redundancy design, VLAN segmentation, power consumption, security protocols, switching capacity, 100 gigabit ethernet, port density, energy efficiency, multi-gigabit ethernet, data center interconnect, advanced routing protocols, virtual switching, low latency switching, rack mounting, packet forwarding, cable management, data center fabric, remote management, network automation, intelligent switching, high availability, network infrastructure, QoS management, and 400 gigabit ethernet are all integral aspects of the evolving the market.

The Core switches segment was valued at USD 5.08 billion in 2019 and showed a gradual increase during the forecast period.

Regional Analysis
APAC is estimated to contribute 35% to the growth of the global market during the forecast period.Technavio’s analysts have elaborately explained the regional trends and drivers that shape the market during the forecast period.
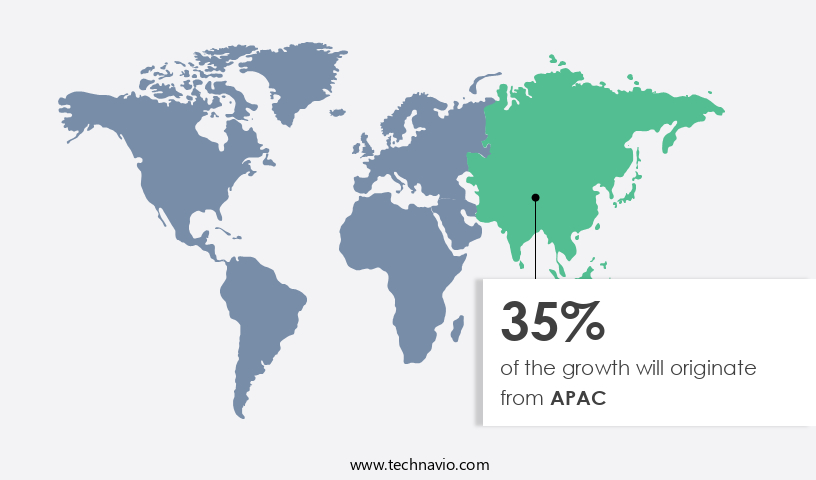
See How Data Center Switch Market Demand is Rising in APAC Request Free Sample
The market is characterized by continuous evolution, with North America leading the way due to the proliferation of data centers by cloud service providers, telecommunication companies, enterprises, and governments. New data center construction and renovation projects, including the building of colocation facilities, will further boost the region's market share. Three primary types of Ethernet switches are utilized in data centers: core, distribution, and access switches. These switches facilitate seamless communication and data transfer within and between data center components. With the increasing demand for advanced networking solutions and the ongoing digital transformation, the market is poised for significant growth.
Additionally, the adoption of high-density and modular switches, as well as the integration of artificial intelligence and machine learning technologies, are expected to shape the market's future landscape.
Market Dynamics
Our researchers analyzed the data with 2024 as the base year, along with the key drivers, trends, and challenges. A holistic analysis of drivers will help companies refine their marketing strategies to gain a competitive advantage.
The market is experiencing significant growth as businesses continue to prioritize high-performance and energy-efficient networking solutions. One key area of focus is data center switch port configuration, with many organizations seeking to optimize their networks for improved performance and reduced latency. High-speed data center switching technologies, such as 40G and 100G Ethernet, are becoming increasingly popular for handling large volumes of data traffic. To manage data center switch power consumption and improve overall performance, advanced routing protocols like BGP and OSPF are being implemented. Network virtualization and software-defined networking (SDN) data center switches are also gaining traction, enabling more efficient use of resources and easier configuration management.
Data center switch security best practices, including redundancy and fault tolerance, are crucial considerations for businesses seeking to mitigate risks and ensure business continuity. Data center switch troubleshooting techniques, such as packet capture and network analysis, are essential for identifying and resolving issues quickly. When it comes to reducing latency, data center switch capacity planning and efficient cooling are critical factors. Data center switch cabling standards, such as Cat 6A and Cat 7, ensure reliable and high-speed connectivity. Advanced ethernet switching features, like link aggregation and Quality of Service (QoS), further enhance network performance. According to recent market research, high-density data center switches are expected to account for over 60% of the total the market share by 2025.
This growth is driven by the increasing demand for more efficient use of data center space and power resources. In conclusion, the market is a dynamic and evolving landscape, with a focus on high-performance, energy efficiency, and advanced networking features. By implementing best practices, optimizing configurations, and leveraging the latest technologies, businesses can ensure their data centers are well-equipped to meet the demands of today's digital economy.
What are the key market drivers leading to the rise in the adoption of Data Center Switch Industry?
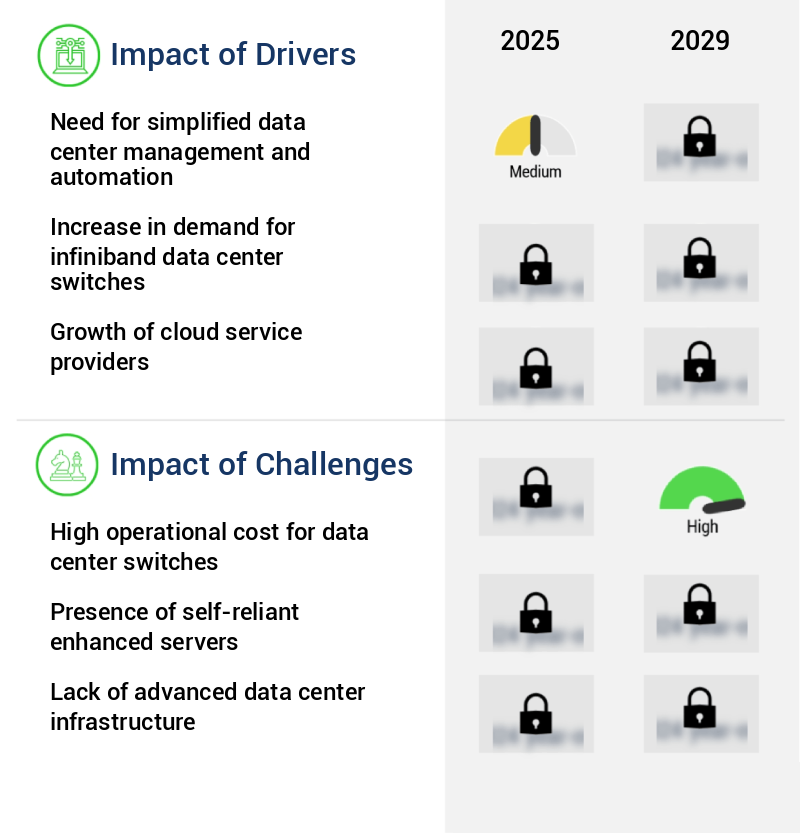
- The increasing demand for simplified data center management and automation is the primary market driver. This need stems from the complexity of managing large data centers and the desire to streamline processes, reduce costs, and enhance efficiency through automation solutions.
- In today's business landscape, managing the intricate networking infrastructure of data centers has become a complex task due to the increasing diversity of applications, services, and workloads they host. Advanced data center switches play a crucial role in simplifying network management and enhancing efficiency. These switches offer enhanced visibility into network performance through sophisticated management capabilities. Moreover, the adoption of intent-based networking (IBN) is on the rise, with data center switches supporting this approach automating network configurations based on organizational intent.
- IBN enables the implementation and adjustment of network settings in alignment with business policies, streamlining network management and ensuring optimal performance. By leveraging the power of advanced data center switches and IBN, organizations can effectively navigate the evolving data center landscape and maintain a competitive edge.
What are the market trends shaping the Data Center Switch Industry?
- The increasing demand for Internet connectivity represents a significant market trend. A growing number of individuals and businesses require reliable and high-speed Internet access, driving market growth in this sector.
- As the number of connected devices, users, and applications continues to grow on the Internet, the significance of data center networks and their switches becomes increasingly crucial. With the escalating usage of online services such as social media, video streaming, and cloud-based applications, data traffic is experiencing a continuous surge. Data center switches are indispensable in managing the vast amounts of data generated by this traffic between servers, storage systems, and the wider Internet. Moreover, the growth of cloud computing services, including IaaS, PaaS, and SaaS, heavily relies on data center networks. Data center switches are essential in enabling the connectivity and data transfer between data centers and the cloud.
- The expansion of these services necessitates scalable and robust networks capable of handling the increasing data demands. In the business world, data center switches are indispensable for ensuring seamless communication and efficient data transfer within and between organizations. The ongoing digital transformation and the shift towards cloud-based solutions have intensified the need for reliable and high-performing data center networks. Despite the challenges, advancements in technology continue to address the evolving requirements of data center networks. These include the implementation of software-defined networking (SDN) and network function virtualization (NFV), which offer increased flexibility, automation, and cost savings.
- In conclusion, data center switches play a pivotal role in managing the ever-growing data traffic and enabling the seamless integration of cloud computing services. As the digital landscape continues to evolve, the importance of robust and scalable data center networks will only become more pronounced.
What challenges does the Data Center Switch Industry face during its growth?
- The escalating operational costs associated with data center switches poses a significant challenge and hinders the growth of the industry.
- Data center switches play a pivotal role in facilitating efficient data transfer within complex network infrastructures. They enable the swift movement of vast data volumes in milliseconds, making them indispensable in data-intensive industries like gaming, video editing, and cryptocurrency mining. However, the cost of research and development for these switches is substantial, leading to relatively high prices. Modern data center switches from leading manufacturers, such as Intel and Broadcom, range from USD100 for small 5-port models to thousands of dollars for larger 24-48 port switches.
- These costs include not only the switch itself but also additional components like processors, memory, cabling, and connectors. Despite the investment, data center switches remain a crucial investment for businesses seeking to optimize their network performance and support their evolving data needs.
Exclusive Customer Landscape
The data center switch market forecasting report includes the adoption lifecycle of the market, covering from the innovator’s stage to the laggard’s stage. It focuses on adoption rates in different regions based on penetration. Furthermore, the data center switch market report also includes key purchase criteria and drivers of price sensitivity to help companies evaluate and develop their market growth analysis strategies.
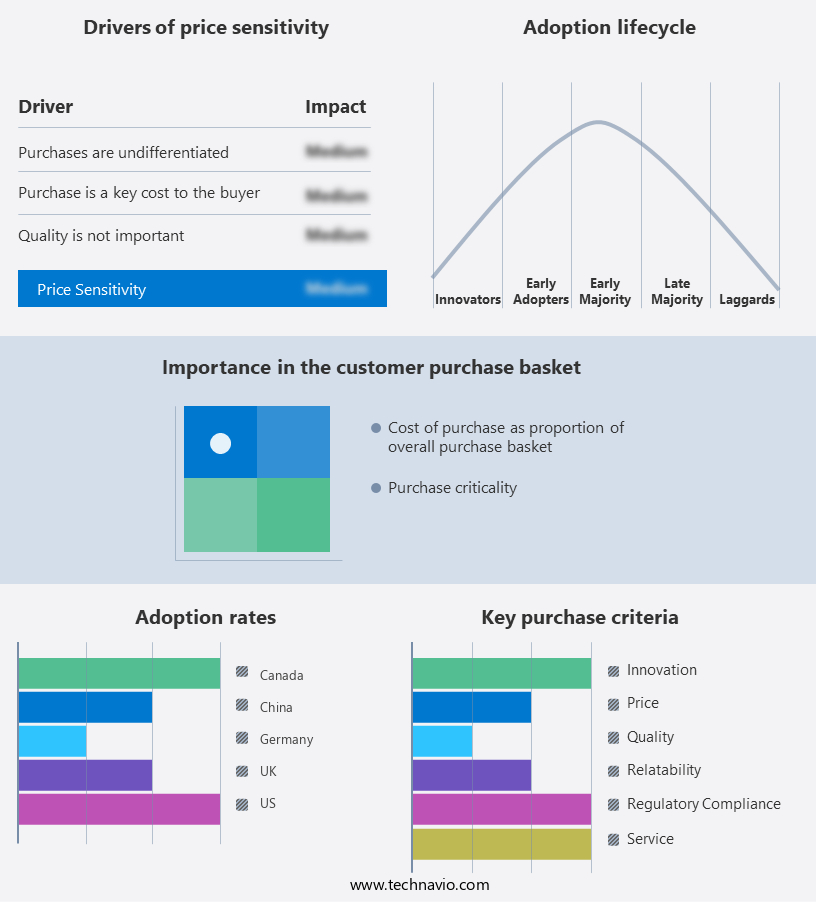
Customer Landscape of Data Center Switch Industry
Competitive Landscape & Market Insights
Companies are implementing various strategies, such as strategic alliances, data center switch market forecast, partnerships, mergers and acquisitions, geographical expansion, and product/service launches, to enhance their presence in the industry.
Accton Technology Corp. - This company provides high radix data center switches, enabling versatile interface speed selections ranging from 25GbE to 50GbE, 100GbE, and 400GbE, catering to diverse use cases. Their offerings ensure network flexibility and scalability.
The industry research and growth report includes detailed analyses of the competitive landscape of the market and information about key companies, including:
- Accton Technology Corp.
- Arista Networks Inc.
- Broadcom Inc.
- Cisco Systems Inc.
- CommScope Holding Co. Inc.
- Dell Technologies Inc.
- Extreme Networks Inc.
- Fortinet Inc.
- FS.COM Inc.
- Hewlett Packard Enterprise Co.
- Huawei Technologies Co. Ltd.
- Juniper Networks Inc.
- Larch Networks
- Lenovo Group Ltd.
- Marvell Technology Inc.
- NADDOD
- NVIDIA Corp.
- QSFPTEK Technology Co. Ltd.
- Ruijie Networks Co.
- VMware Inc.
Qualitative and quantitative analysis of companies has been conducted to help clients understand the wider business environment as well as the strengths and weaknesses of key industry players. Data is qualitatively analyzed to categorize companies as pure play, category-focused, industry-focused, and diversified; it is quantitatively analyzed to categorize companies as dominant, leading, strong, tentative, and weak.
Recent Development and News in Data Center Switch Market
- In January 2024, Cisco Systems announced the launch of its new Nexus 9372PX Data Center Switch, featuring advanced networking capabilities and improved power efficiency. This product expansion aimed to cater to the growing demand for high-performance, energy-efficient switches in the data center market (Cisco Press Release).
- In March 2024, Arista Networks and Microsoft entered into a strategic partnership to develop and deploy open networking solutions in Microsoft's Azure data centers. This collaboration was expected to enhance interoperability and improve network performance for Microsoft's cloud services (Microsoft Press Release).
- In May 2024, Juniper Networks completed the acquisition of Mist Systems, a leader in AI-driven networking for enterprise Wi-Fi and wired networks. This acquisition aimed to strengthen Juniper's position in the data center switching market by adding Mist's AI capabilities to Juniper's portfolio (Juniper Networks Press Release).
- In February 2025, Huawei secured a significant contract from Vodafone to deploy its data center switches in multiple European countries. This deal represented a major geographic expansion for Huawei in the European data center market and underscored its growing global presence (Reuters).
Dive into Technavio’s robust research methodology, blending expert interviews, extensive data synthesis, and validated models for unparalleled Data Center Switch Market insights. See full methodology.
|
Market Scope |
|
|
Report Coverage |
Details |
|
Page number |
230 |
|
Base year |
2024 |
|
Historic period |
2019-2023 |
|
Forecast period |
2025-2029 |
|
Growth momentum & CAGR |
Accelerate at a CAGR of 5.2% |
|
Market growth 2025-2029 |
USD 4695.6 million |
|
Market structure |
Fragmented |
|
YoY growth 2024-2025(%) |
4.8 |
|
Key countries |
US, Canada, Germany, UK, Italy, France, China, India, Japan, Brazil, Egypt, UAE, Oman, Argentina, KSA, UAE, Brazil, and Rest of World (ROW) |
|
Competitive landscape |
Leading Companies, Market Positioning of Companies, Competitive Strategies, and Industry Risks |
Research Analyst Overview
- In the dynamic and evolving the market, thermal management and network monitoring continue to be critical concerns for businesses. As data centers expand and network virtualization becomes more prevalent, hardware acceleration and advanced routing protocols are increasingly adopted to enhance switching capacity and reduce latency. Network virtualization and software-defined networking enable greater flexibility and efficiency in data center topology design. Fiber optic cabling and 100 gigabit ethernet have become standard for high-speed connectivity, while multi-gigabit ethernet and 400 gigabit ethernet are gaining traction for even faster data transfer. Redundancy design, VLAN segmentation, and power consumption remain essential aspects of data center infrastructure management.
- Energy efficiency is a growing priority, with many organizations implementing advanced power management systems and utilizing rack mounting for optimized space utilization. Security protocols are a top concern, with intelligent switching and virtual switching offering enhanced security features. Network automation and remote management tools enable improved network infrastructure management and QOS management, ensuring optimal bandwidth utilization and fault tolerance. Low latency switching and packet forwarding are essential for high availability and network performance. Cable management and data center fabric solutions facilitate efficient cabling and reduce network complexity. Comparatively, the adoption of advanced routing protocols and network automation tools has seen significant growth in recent years, with some organizations reporting up to 30% reduction in network downtime and improved network performance.
- Power consumption has also become a key metric, with energy-efficient switches reducing overall energy usage by up to 40%. In summary, the market is characterized by ongoing innovation and evolving trends, with a focus on thermal management, network monitoring, network virtualization, and energy efficiency. Organizations must stay informed of these developments to optimize their network infrastructure and maintain a competitive edge.
What are the Key Data Covered in this Data Center Switch Market Research and Growth Report?
-
What is the expected growth of the Data Center Switch Market between 2025 and 2029?
-
USD 4.7 billion, at a CAGR of 5.2%
-
-
What segmentation does the market report cover?
-
The report segmented by Type (Core switches, Distribution switches, and Access switches), Technology (Ethernet, Fiber channel, and Infiniband), End-user (Cloud, Telecom, Enterprise, and Government), Speed (10 G, 25 G, 40 G, 100 G, and Others), and Geography (North America, APAC, Europe, South America, and Middle East and Africa)
-
-
Which regions are analyzed in the report?
-
North America, APAC, Europe, South America, and Middle East and Africa
-
-
What are the key growth drivers and market challenges?
-
Need for simplified data center management and automation, High operational cost for data center switches
-
-
Who are the major players in the Data Center Switch Market?
-
Key Companies Accton Technology Corp., Arista Networks Inc., Broadcom Inc., Cisco Systems Inc., CommScope Holding Co. Inc., Dell Technologies Inc., Extreme Networks Inc., Fortinet Inc., FS.COM Inc., Hewlett Packard Enterprise Co., Huawei Technologies Co. Ltd., Juniper Networks Inc., Larch Networks, Lenovo Group Ltd., Marvell Technology Inc., NADDOD, NVIDIA Corp., QSFPTEK Technology Co. Ltd., Ruijie Networks Co., and VMware Inc.
-
Market Research Insights
- The market is a dynamic and complex ecosystem, characterized by ongoing advancements in technology and increasing demand for network performance and operational efficiency. Two key metrics illustrate this market's evolution. First, The market size is projected to reach USD61.2 billion by 2026, growing at a compound annual growth rate (CAGR) of 7.3% during the forecast period. This growth is driven by the increasing adoption of airflow optimization, ethernet standards, and remote diagnostics to enhance network performance and signal integrity. Second, hardware lifespan and configuration management have emerged as critical factors in the market. Firmware upgrades and system logs help ensure optimal network performance and minimize packet loss, while access control lists and power budgeting contribute to improved security and energy efficiency.
- Throughput testing, link aggregation, and error correction further enhance network reliability and reduce jitter measurement. As switch architecture evolves, power over ethernet, optical transceivers, and routing protocols become increasingly important for network segmentation and heat dissipation. Overall, the market continues to adapt to meet the demands of modern, high-performance networks.
We can help! Our analysts can customize this data center switch market research report to meet your requirements.
 RIA -
RIA - 
