Dietary Supplement Contract Manufacturing Market Size 2025-2029
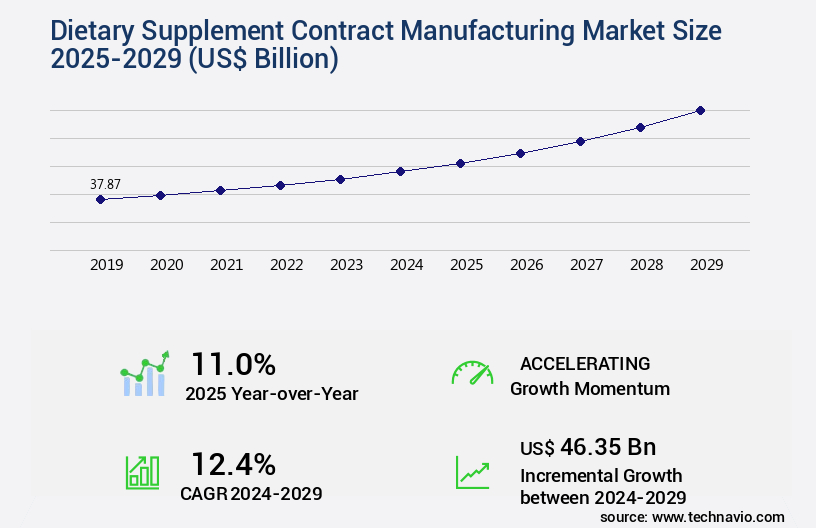
The dietary supplement contract manufacturing market size is valued to increase USD 46.35 billion, at a CAGR of 12.4% from 2024 to 2029. High prevalence of obesity will drive the dietary supplement contract manufacturing market.
Major Market Trends & Insights
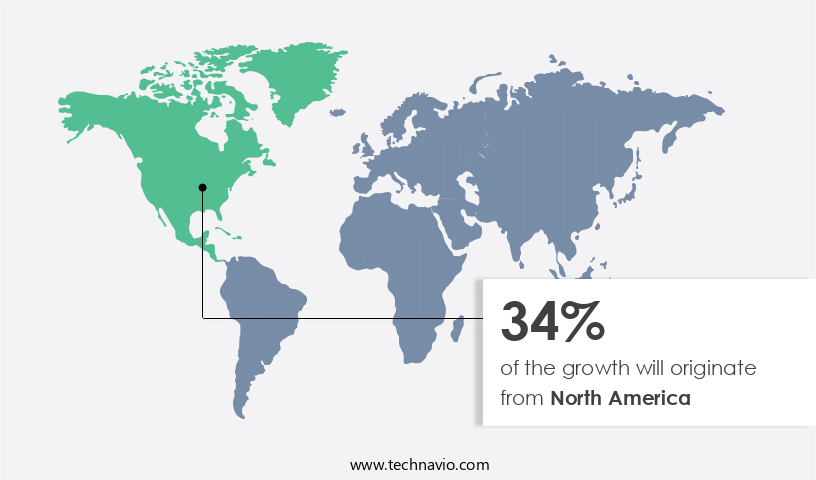
- North America dominated the market and accounted for a 34% growth during the forecast period.
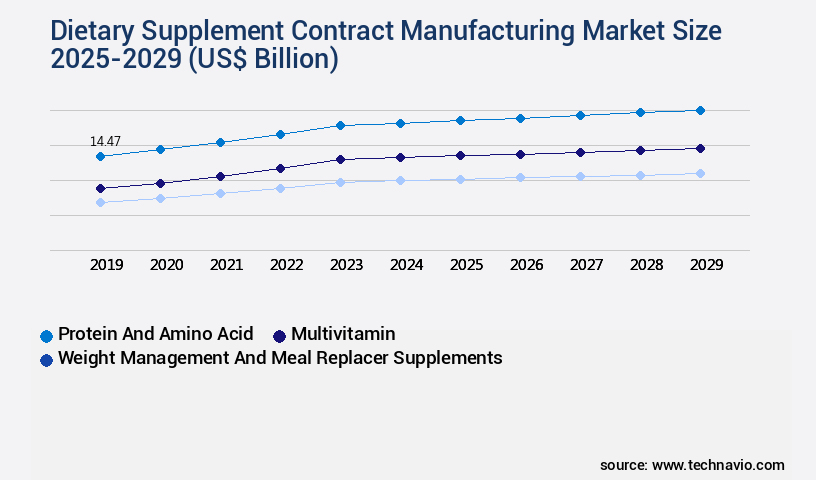
- By Product - Protein and amino acid segment was valued at USD 14.47 billion in 2023
- By Formulation - Tablets segment accounted for the largest market revenue share in 2023
Market Size & Forecast
- Market Opportunities: USD 177.32 billion
- Market Future Opportunities: USD 46.35 billion
- CAGR from 2024 to 2029 : 12.4%
Market Summary
- The market has experienced significant growth in recent years, driven by increasing consumer awareness and preference for healthier lifestyle choices. The global market for dietary supplements is projected to reach a value of USD 226.2 billion by 2027, growing at a steady pace. This expansion is fueled by various factors, including the rising prevalence of chronic diseases, the growing geriatric population, and the increasing acceptance of dietary supplements as an alternative to prescription medication. Despite this promising outlook, the market faces challenges, such as stringent regulatory requirements and the need for transparency and quality assurance.
- Contract manufacturers play a crucial role in addressing these challenges by providing specialized expertise, advanced technology, and cost-effective solutions. They enable businesses to produce high-quality dietary supplements while adhering to regulatory guidelines and maintaining competitive pricing. The market is characterized by continuous innovation and technological advancements. For instance, the adoption of advanced manufacturing technologies, such as continuous manufacturing and nanotechnology, is revolutionizing the production process, enhancing product quality, and reducing costs. Additionally, the increasing popularity of personalized nutrition and functional foods is driving demand for customized dietary supplements, further expanding the market's scope. In conclusion, the market is a dynamic and evolving industry, driven by consumer trends, regulatory requirements, and technological advancements.
What will be the Size of the Dietary Supplement Contract Manufacturing Market during the forecast period?

Get Key Insights on Market Forecast (PDF) Request Free Sample
How is the Dietary Supplement Contract Manufacturing Market Segmented?
The dietary supplement contract manufacturing industry research report provides comprehensive data (region-wise segment analysis), with forecasts and estimates in "USD billion" for the period 2025-2029, as well as historical data from 2019-2023 for the following segments.
- Product
- Protein and amino acid
- Multivitamin
- Weight management and meal replacer supplements
- Others
- Formulation
- Tablets
- Capsules
- Gummies
- Others
- Service
- Manufacturing
- Packaging
- R&D
- Regulatory Consulting
- End-User
- Nutraceutical Companies
- Pharmaceutical Companies
- Food & Beverage Companies
- Geography
- North America
- Europe
- Middle East and Africa
- APAC
- South America
- Rest of World (ROW)
By Product Insights
The protein and amino acid segment is estimated to witness significant growth during the forecast period.
The market is a dynamic and evolving industry, with protein and amino acid supplements commanding a substantial share due to their vital role in muscle growth, recovery, and overall health maintenance. These supplements, sourced primarily from whey, casein, soy, and egg whites, offer a complete protein profile, containing all nine essential amino acids that the human body cannot produce naturally. In July 2024, The Coconut Collab, a UK-based plant-based coconut yogurt brand, entered this market with Protein Yog, a dairy-free yogurt providing 10 grams of protein per serving. This launch underscores the ongoing demand for innovative, plant-based protein solutions.

Request Free Sample
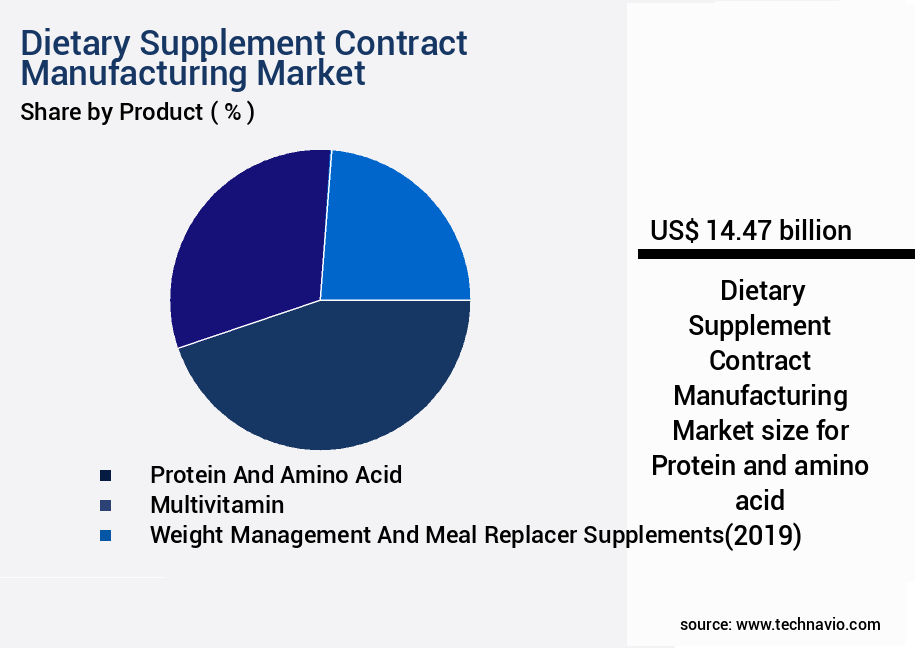
The Protein and amino acid segment was valued at USD 14.47 billion in 2019 and showed a gradual increase during the forecast period.
The manufacturing process for these supplements involves various stages, including inventory management, capsule filling, powder blending, tablet compression, liquid filling, and quality assurance systems. Good manufacturing practices (GMP) are strictly adhered to during the entire process, from raw material testing and deviation investigation to production scheduling and order fulfillment. Additionally, contract manufacturing agreements, supplier audits, and risk management are crucial elements in this industry, ensuring the highest standards of product labeling, material handling, and cleanroom manufacturing. With a focus on custom formulation development, ingredient sourcing, and GMP certification, contract manufacturers prioritize capacity planning and change control to maintain efficient and effective operations.

Request Free Sample
Regional Analysis
North America is estimated to contribute 34% to the growth of the global market during the forecast period. Technavio's analysts have elaborately explained the regional trends and drivers that shape the market during the forecast period.

See How Dietary Supplement Contract Manufacturing Market Demand is Rising in North America Request Free Sample
The market is witnessing significant evolution, with North America leading the global landscape due to technological advancements and stringent quality standards. In October 2023, Vitaquest International, a prominent player, expanded its capabilities by acquiring a powder processing facility from Pharmachem Laboratories. This acquisition incorporates Ashland's fluidized bed process technologies, enhancing particle and powder engineering for the food, beverage, and dietary supplement industries. This strategic move enables Vitaquest to boost production efficiency and product quality, catering to the increasing demand for high-performance dietary supplements.
According to recent reports, the global dietary supplement market size was valued at over USD 140 billion in 2020 and is projected to reach USD 220 billion by 2028, growing at a steady pace. This growth is attributed to the rising health consciousness and increasing consumer preference for natural and organic products.
Market Dynamics
Our researchers analyzed the data with 2024 as the base year, along with the key drivers, trends, and challenges. A holistic analysis of drivers will help companies refine their marketing strategies to gain a competitive advantage.
The market has experienced significant growth in recent years, driven by increasing consumer demand for personalized and high-quality nutritional products. This market encompasses the production of dietary supplements on behalf of other companies, offering various services such as formulation development, custom manufacturing, and scale-up processes. Costs in the market can vary greatly depending on the specific requirements of each project. These costs include raw materials, labor, equipment usage, and regulatory compliance fees. Contract manufacturers adhere to strict regulations, including those set by the Food and Drug Administration (FDA) for dietary supplement GMP compliance and regulations. Quality control and assurance are essential components of the contract manufacturing process. Manufacturers employ advanced technologies and best practices to ensure the highest standards are met. This includes implementing robust quality control systems, validating manufacturing processes, and conducting stability studies. The custom supplement manufacturing process begins with formulation development services, where manufacturers collaborate with clients to create unique and effective supplement formulations. Scale-up processes are then employed to manufacture supplements in large quantities while maintaining consistency and quality. Dietary supplement manufacturing facilities must adhere to stringent requirements, including proper equipment, environmental conditions, and record-keeping systems. Contract manufacturing agreements outline the terms and conditions of the partnership between the manufacturer and the client, ensuring transparency and accountability. Outsourcing supplement manufacturing offers significant cost savings compared to in-house production. However, it is crucial to carefully evaluate potential contract manufacturers to minimize risks associated with quality, regulatory compliance, and intellectual property protection. In conclusion, the market offers various benefits, including cost savings, access to specialized expertise, and improved efficiency. By adhering to strict regulations, employing advanced technologies, and following best practices, contract manufacturers ensure the production of high-quality, effective dietary supplements.

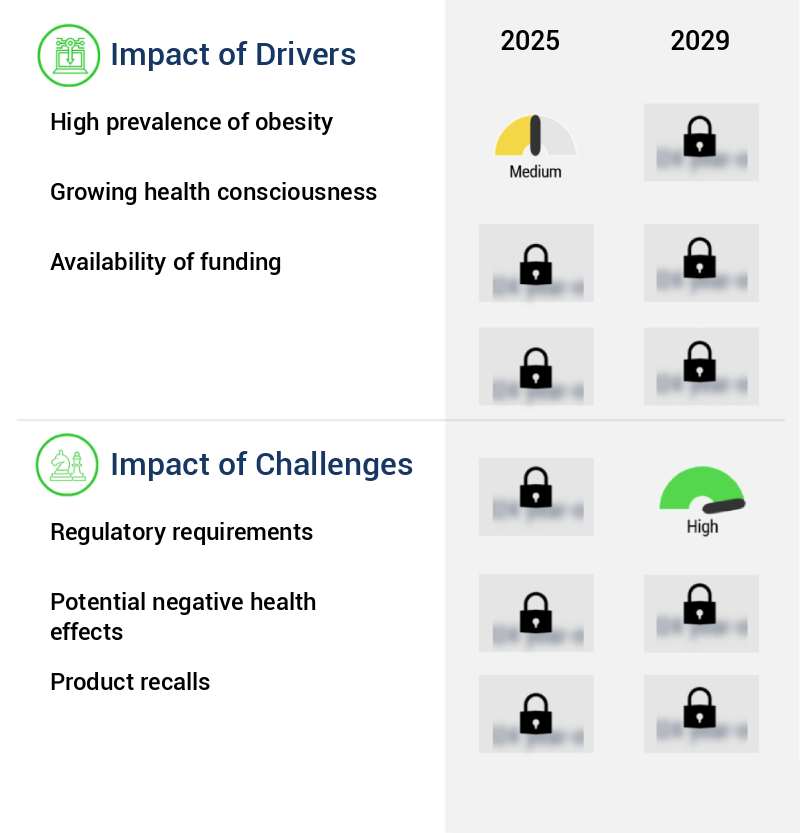
What are the key market drivers leading to the rise in the adoption of Dietary Supplement Contract Manufacturing Industry?
- The high prevalence of obesity serves as the primary market driver, as a significant portion of the population seeks solutions to combat this health concern.
- The market experiences continuous growth due to the escalating obesity rates across numerous regions. According to the Centers for Disease Control and Prevention (CDC), over 40% of American adults are classified as obese, with similar prevalence observed among men and women. This issue is pervasive, with at least 20% of adults residing in every U.S. State living with obesity. In 16 states, obesity rates among White adults surpass 35%.
- In contrast, the National Family Health Survey (NFHS-5) in India reveals a significant disparity in obesity rates between urban and rural populations. These statistics underscore the urgent need for effective health interventions and the expanding role of dietary supplement contract manufacturers in addressing this global health concern.
What are the market trends shaping the Dietary Supplement Contract Manufacturing Industry?
- The trend in the market involves capacity additions. It is a mandatory action for businesses.
- The market is undergoing substantial growth, fueled by escalating consumer preference for diverse and health-conscientious products. A recent development in this sector is CAPTEK Softgel International's expansion with a new 60,000-square-foot gummy supplement manufacturing facility in La Mirada, California, USA. This facility, inaugurated in March 2024, specializes in gummy supplement production, offering comprehensive solutions that encompass turnkey gummy formulations, custom flavorings, and bottling services. The starch-free production lines enable the facility to produce a multitude of gummy varieties, including those based on pectin, agar, carrageenan, gelatin, and their combinations.
- This versatility encourages innovation and caters to consumers with specific dietary needs, such as those requiring gluten-free products.
What challenges does the Dietary Supplement Contract Manufacturing Industry face during its growth?
- The growth of the industry is significantly impacted by regulatory requirements, which pose a significant challenge that must be addressed by professionals in a knowledgeable and formal manner.
- The market is subject to intricate regulatory oversight, with the Food and Drug Administration (FDA) governing both finished products and their components in the United States. Dietary supplements are distinctly regulated under the Dietary Supplement Health and Education Act of 1994 (DSHEA), which mandates manufacturers and distributors to ensure their offerings are free from adulteration and misbranding. To comply with the Federal Food, Drug, and Cosmetic Act, as amended by DSHEA and FDA regulations, these entities must meticulously assess the safety and labeling of their products prior to market release.
- This stringent regulatory environment underscores the importance of rigorous quality control processes and thorough compliance with established guidelines.
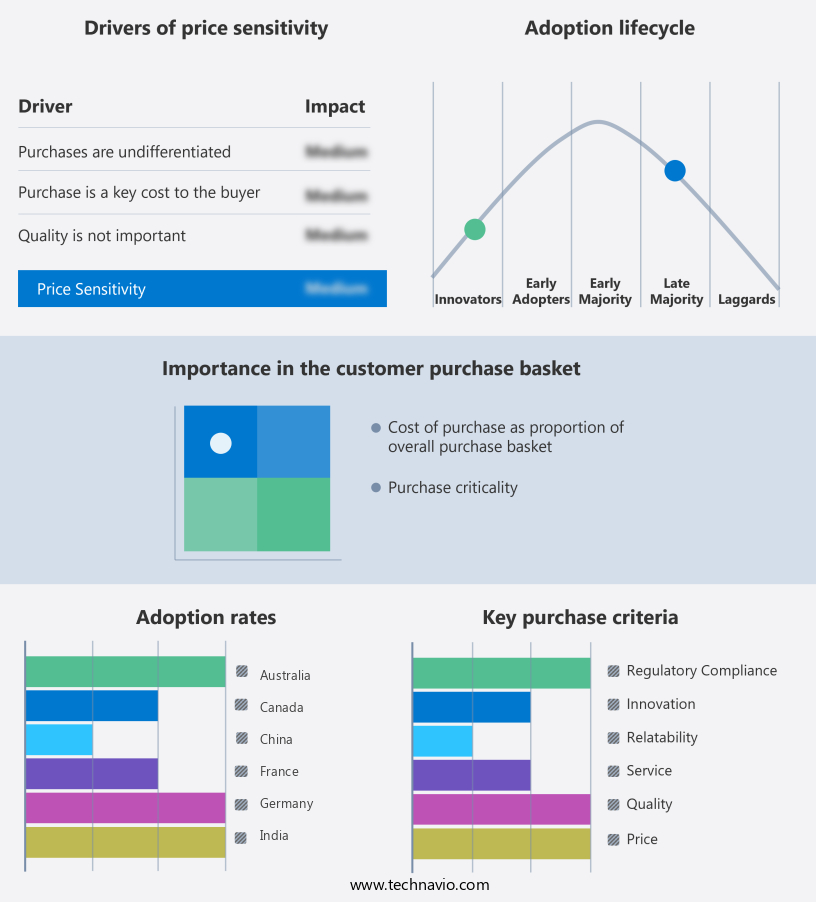
Exclusive Technavio Analysis on Customer Landscape
The dietary supplement contract manufacturing market forecasting report includes the adoption lifecycle of the market, covering from the innovator's stage to the laggard's stage. It focuses on adoption rates in different regions based on penetration. Furthermore, the dietary supplement contract manufacturing market report also includes key purchase criteria and drivers of price sensitivity to help companies evaluate and develop their market growth analysis strategies.

Customer Landscape of Dietary Supplement Contract Manufacturing Industry
Competitive Landscape
Companies are implementing various strategies, such as strategic alliances, dietary supplement contract manufacturing market forecast, partnerships, mergers and acquisitions, geographical expansion, and product/service launches, to enhance their presence in the industry.
Aenova Group - This company specializes in providing dietary supplement manufacturers with high-quality contract services for modified cellulose binders, such as Klucel Nutra, and hydroxypropyl methylcellulose products.
The industry research and growth report includes detailed analyses of the competitive landscape of the market and information about key companies, including:
- Aenova Group
- Arjuna Natural Pvt Ltd
- Capsugel (Lonza)
- Catalent, Inc.
- Church & Dwight Co., Inc.
- DSM Nutritional Products
- Eurofins Scientific SE
- Glanbia PLC
- Hermes Pharma GmbH
- Kaged Muscle
- Lonza Group AG
- Nutrilo GmbH
- Piramal Pharma Solutions
- Robinson Pharma, Inc.
- Sakura Pharma Co., Ltd.
- Sirio Pharma Co., Ltd.
- SFI Health (formerly Schwabe North America Inc.)
- Swiss Caps AG
- Tishcon Corp.
- Vitakem Nutraceutical Inc.
Qualitative and quantitative analysis of companies has been conducted to help clients understand the wider business environment as well as the strengths and weaknesses of key industry players. Data is qualitatively analyzed to categorize companies as pure play, category-focused, industry-focused, and diversified; it is quantitatively analyzed to categorize companies as dominant, leading, strong, tentative, and weak.
Recent Development and News in Dietary Supplement Contract Manufacturing Market
- In January 2024, Nutraceutical Corporation, a leading dietary supplement contract manufacturer, announced the launch of its new state-of-the-art manufacturing facility in California, increasing its production capacity by 50% (Nutraceutical Corporation Press Release, 2024).
- In March 2024, DSM Nutritional Products and BASF Corporation formed a strategic partnership to expand their dietary supplement offerings by combining DSM's nutritional ingredients and BASF's production capabilities (Bloomberg, 2024).
- In May 2024, NBTY, Inc., a prominent dietary supplement contract manufacturer, completed a USD 100 million funding round to invest in research and development and expand its global reach (SEC Filing, NBTY, Inc., 2024).
- In January 2025, the U.S. Food and Drug Administration (FDA) approved the use of a new dietary ingredient, BioActive Iron, for use in dietary supplements, marking a significant regulatory approval for the industry (FDA Press Release, 2025).
Dive into Technavio's robust research methodology, blending expert interviews, extensive data synthesis, and validated models for unparalleled Dietary Supplement Contract Manufacturing Market insights. See full methodology.
Market Scope
|
Report Coverage
|
Details
|
Page number
|
213
|
Base year
|
2024
|
Historic period
|
2019-2023 |
Forecast period
|
2025-2029
|
Growth momentum & CAGR
|
Accelerate at a CAGR of 12.4%
|
Market growth 2025-2029
|
USD 46.35 billion
|
Market structure
|
Fragmented
|
YoY growth 2024-2025(%)
|
11.0
|
Key countries
|
US, Canada, Germany, UK, Italy, France, China, India, Japan, Brazil, Egypt, UAE, Oman, Argentina, KSA, UAE, Brazil, and Rest of World (ROW)
|
Competitive landscape
|
Leading Companies, Market Positioning of Companies, Competitive Strategies, and Industry Risks
|
Request Free Sample
Research Analyst Overview
- The market continues to evolve, driven by the increasing demand for personalized and high-quality nutritional products. This dynamic industry encompasses various processes, including capsule filling, powder blending, and liquid filling, among others. Inventory management and manufacturing process validation are crucial components, ensuring efficient production and maintaining product integrity. Quality assurance systems, such as supplier audits and raw material testing, are integral to delivering consistent and safe finished goods. For instance, a leading contract manufacturer experienced a 25% increase in sales due to their commitment to good manufacturing practices and custom formulation development. The industry is projected to grow by 7% annually, reflecting the ongoing demand for contract manufacturing services.
- Effective risk management, order fulfillment, and nutritional labeling are essential for maintaining customer satisfaction and regulatory compliance. Contract manufacturing agreements, batch record review, and production scheduling are vital elements in managing supply chain complexities. Cleanroom manufacturing and GMP certification are crucial aspects of the manufacturing process, ensuring a controlled environment and adherence to strict quality standards. Change control, product labeling, and material handling are additional critical components in maintaining a robust and efficient manufacturing process. Overall, the market showcases continuous growth and innovation, with a focus on delivering high-quality, customized products while ensuring regulatory compliance and operational efficiency.
What are the Key Data Covered in this Dietary Supplement Contract Manufacturing Market Research and Growth Report?
-
What is the expected growth of the Dietary Supplement Contract Manufacturing Market between 2025 and 2029?
-
What segmentation does the market report cover?
-
The report is segmented by Product (Protein and amino acid, Multivitamin, Weight management and meal replacer supplements, and Others), Formulation (Tablets, Capsules, Gummies, and Others), Geography (North America, Europe, APAC, Middle East and Africa, and South America), Service (Manufacturing, Packaging, R&D, and Regulatory Consulting), and End-User (Nutraceutical Companies, Pharmaceutical Companies, and Food & Beverage Companies)
-
Which regions are analyzed in the report?
-
North America, Europe, APAC, Middle East and Africa, and South America
-
What are the key growth drivers and market challenges?
-
Who are the major players in the Dietary Supplement Contract Manufacturing Market?
-
Aenova Group, Arjuna Natural Pvt Ltd, Capsugel (Lonza), Catalent, Inc., Church & Dwight Co., Inc., DSM Nutritional Products, Eurofins Scientific SE, Glanbia PLC, Hermes Pharma GmbH, Kaged Muscle, Lonza Group AG, Nutrilo GmbH, Piramal Pharma Solutions, Robinson Pharma, Inc., Sakura Pharma Co., Ltd., Sirio Pharma Co., Ltd., SFI Health (formerly Schwabe North America Inc.), Swiss Caps AG, Tishcon Corp., and Vitakem Nutraceutical Inc.
Market Research Insights
- The market is a dynamic and complex industry, continually evolving to meet the demands of consumers and regulatory bodies. Two key statistics highlight its growth and complexity. In a recent contract manufacturing agreement, a leading supplier increased production capacity by 25% to meet the surging demand for a specific supplement. In this market, manufacturers focus on various aspects to deliver high-quality products. They optimize processes through ingredient specifications, quality by design, and process optimization. They also consider packaging materials, excipient selection, documentation control, and waste reduction.
- Personnel training, manufacturing scale-up, cleaning validation, preventive maintenance, and labeling regulations are other essential elements. The industry prioritizes compliance requirements, calibration procedures, and sanitation procedures, ensuring the production of safe and effective dietary supplements. Record keeping, distribution logistics, production efficiency, and supply chain traceability are also crucial for maintaining transparency and reliability. Manufacturers invest in equipment qualification, product traceability, design of experiments, data integrity, cost analysis manufacturing, and yield optimization to improve their capabilities and meet the evolving needs of their clients. Shelf life testing, statistical process control, and process capability analysis are essential for ensuring product quality and consistency.
We can help! Our analysts can customize this dietary supplement contract manufacturing market research report to meet your requirements.
Get in touch
1 Executive Summary
- 1.1 Market overview
- Executive Summary - Chart on Market Overview
- Executive Summary - Data Table on Market Overview
- Executive Summary - Chart on Global Market Characteristics
- Executive Summary - Chart on Market by Geography
- Executive Summary - Chart on Market Segmentation by Product
- Executive Summary - Chart on Market Segmentation by Formulation
- Executive Summary - Chart on Incremental Growth
- Executive Summary - Data Table on Incremental Growth
- Executive Summary - Chart on Company Market Positioning
2 Technavio Analysis
- 2.1 Analysis of price sensitivity, lifecycle, customer purchase basket, adoption rates, and purchase criteria
- Analysis of price sensitivity, lifecycle, customer purchase basket, adoption rates, and purchase criteria
- 2.2 Criticality of inputs and Factors of differentiation
- Overview on criticality of inputs and factors of differentiation
- 2.3 Factors of disruption
- Overview on factors of disruption
- 2.4 Impact of drivers and challenges
- Impact of drivers and challenges in 2024 and 2029
3 Market Landscape
- 3.1 Market ecosystem
- Parent Market
- Data Table on - Parent Market
- 3.2 Market characteristics
- Market characteristics analysis
4 Market Sizing
- 4.1 Market definition
- Offerings of companies included in the market definition
- 4.2 Market segment analysis
- 4.4 Market outlook: Forecast for 2024-2029
- Chart on Global - Market size and forecast 2024-2029 ($ million)
- Data Table on Global - Market size and forecast 2024-2029 ($ million)
- Chart on Global Market: Year-over-year growth 2024-2029 (%)
- Data Table on Global Market: Year-over-year growth 2024-2029 (%)
5 Historic Market Size
- 5.1 Global Dietary Supplement Contract Manufacturing Market 2019 - 2023
- Historic Market Size - Data Table on Global Dietary Supplement Contract Manufacturing Market 2019 - 2023 ($ million)
- 5.2 Product segment analysis 2019 - 2023
- Historic Market Size - Product Segment 2019 - 2023 ($ million)
- 5.3 Formulation segment analysis 2019 - 2023
- Historic Market Size - Formulation Segment 2019 - 2023 ($ million)
- 5.4 Geography segment analysis 2019 - 2023
- Historic Market Size - Geography Segment 2019 - 2023 ($ million)
- 5.5 Country segment analysis 2019 - 2023
- Historic Market Size - Country Segment 2019 - 2023 ($ million)
6 Qualitative Analysis
- 6.1 Impact of AI on the Global Dietary Supplement Contract Manufacturing Market
7 Five Forces Analysis
- 7.1 Five forces summary
- Five forces analysis - Comparison between 2024 and 2029
- 7.2 Bargaining power of buyers
- Bargaining power of buyers - Impact of key factors 2024 and 2029
- 7.3 Bargaining power of suppliers
- Bargaining power of suppliers - Impact of key factors in 2024 and 2029
- 7.4 Threat of new entrants
- Threat of new entrants - Impact of key factors in 2024 and 2029
- 7.5 Threat of substitutes
- Threat of substitutes - Impact of key factors in 2024 and 2029
- 7.6 Threat of rivalry
- Threat of rivalry - Impact of key factors in 2024 and 2029
- 7.7 Market condition
- Chart on Market condition - Five forces 2024 and 2029
8 Market Segmentation by Product
- 8.1 Market segments
- Chart on Product - Market share (2024-2029) (%)
- Data Table on Product - Market share (2024-2029) (%)
- 8.2 Comparison by Product
- Chart on Comparison by Product
- Data Table on Comparison by Product
- 8.3 Protein and amino acid - Market size and forecast (2024-2029)
- Chart on Protein and amino acid - Market size and forecast (2024-2029) ($ million)
- Data Table on Protein and amino acid - Market size and forecast (2024-2029) ($ million)
- Chart on Protein and amino acid - Year-over-year growth (2024-2029) (%)
- Data Table on Protein and amino acid - Year-over-year growth (2024-2029) (%)
- 8.4 Multivitamin - Market size and forecast (2024-2029)
- Chart on Multivitamin - Market size and forecast (2024-2029) ($ million)
- Data Table on Multivitamin - Market size and forecast (2024-2029) ($ million)
- Chart on Multivitamin - Year-over-year growth (2024-2029) (%)
- Data Table on Multivitamin - Year-over-year growth (2024-2029) (%)
- 8.5 Weight management and meal replacer supplements - Market size and forecast (2024-2029)
- Chart on Weight management and meal replacer supplements - Market size and forecast (2024-2029) ($ million)
- Data Table on Weight management and meal replacer supplements - Market size and forecast (2024-2029) ($ million)
- Chart on Weight management and meal replacer supplements - Year-over-year growth (2024-2029) (%)
- Data Table on Weight management and meal replacer supplements - Year-over-year growth (2024-2029) (%)
- 8.6 Others - Market size and forecast (2024-2029)
- Chart on Others - Market size and forecast (2024-2029) ($ million)
- Data Table on Others - Market size and forecast (2024-2029) ($ million)
- Chart on Others - Year-over-year growth (2024-2029) (%)
- Data Table on Others - Year-over-year growth (2024-2029) (%)
- 8.7 Market opportunity by Product
- Market opportunity by Product ($ million)
- Data Table on Market opportunity by Product ($ million)
9 Market Segmentation by Formulation
- 9.1 Market segments
- Chart on Formulation - Market share (2024-2029) (%)
- Data Table on Formulation - Market share (2024-2029) (%)
- 9.2 Comparison by Formulation
- Chart on Comparison by Formulation
- Data Table on Comparison by Formulation
- 9.3 Tablets - Market size and forecast (2024-2029)
- Chart on Tablets - Market size and forecast (2024-2029) ($ million)
- Data Table on Tablets - Market size and forecast (2024-2029) ($ million)
- Chart on Tablets - Year-over-year growth (2024-2029) (%)
- Data Table on Tablets - Year-over-year growth (2024-2029) (%)
- 9.4 Capsules - Market size and forecast (2024-2029)
- Chart on Capsules - Market size and forecast (2024-2029) ($ million)
- Data Table on Capsules - Market size and forecast (2024-2029) ($ million)
- Chart on Capsules - Year-over-year growth (2024-2029) (%)
- Data Table on Capsules - Year-over-year growth (2024-2029) (%)
- 9.5 Gummies - Market size and forecast (2024-2029)
- Chart on Gummies - Market size and forecast (2024-2029) ($ million)
- Data Table on Gummies - Market size and forecast (2024-2029) ($ million)
- Chart on Gummies - Year-over-year growth (2024-2029) (%)
- Data Table on Gummies - Year-over-year growth (2024-2029) (%)
- 9.6 Others - Market size and forecast (2024-2029)
- Chart on Others - Market size and forecast (2024-2029) ($ million)
- Data Table on Others - Market size and forecast (2024-2029) ($ million)
- Chart on Others - Year-over-year growth (2024-2029) (%)
- Data Table on Others - Year-over-year growth (2024-2029) (%)
- 9.7 Market opportunity by Formulation
- Market opportunity by Formulation ($ million)
- Data Table on Market opportunity by Formulation ($ million)
10 Market Segmentation by Service
- 10.1 Market segments
- Chart on Service - Market share (2024-2029) (%)
- Data Table on Service - Market share (2024-2029) (%)
- 10.2 Comparison by Service
- Chart on Comparison by Service
- Data Table on Comparison by Service
- 10.3 Manufacturing - Market size and forecast (2024-2029)
- Chart on Manufacturing - Market size and forecast (2024-2029) ($ million)
- Data Table on Manufacturing - Market size and forecast (2024-2029) ($ million)
- Chart on Manufacturing - Year-over-year growth (2024-2029) (%)
- Data Table on Manufacturing - Year-over-year growth (2024-2029) (%)
- 10.4 Packaging - Market size and forecast (2024-2029)
- Chart on Packaging - Market size and forecast (2024-2029) ($ million)
- Data Table on Packaging - Market size and forecast (2024-2029) ($ million)
- Chart on Packaging - Year-over-year growth (2024-2029) (%)
- Data Table on Packaging - Year-over-year growth (2024-2029) (%)
- 10.5 R&D - Market size and forecast (2024-2029)
- Chart on R&D - Market size and forecast (2024-2029) ($ million)
- Data Table on R&D - Market size and forecast (2024-2029) ($ million)
- Chart on R&D - Year-over-year growth (2024-2029) (%)
- Data Table on R&D - Year-over-year growth (2024-2029) (%)
- 10.6 Regulatory Consulting - Market size and forecast (2024-2029)
- Chart on Regulatory Consulting - Market size and forecast (2024-2029) ($ million)
- Data Table on Regulatory Consulting - Market size and forecast (2024-2029) ($ million)
- Chart on Regulatory Consulting - Year-over-year growth (2024-2029) (%)
- Data Table on Regulatory Consulting - Year-over-year growth (2024-2029) (%)
- 10.7 Market opportunity by Service
- Market opportunity by Service ($ million)
- Data Table on Market opportunity by Service ($ million)
11 Market Segmentation by End-User
- 11.1 Market segments
- Chart on End-User - Market share (2024-2029) (%)
- Data Table on End-User - Market share (2024-2029) (%)
- 11.2 Comparison by End-User
- Chart on Comparison by End-User
- Data Table on Comparison by End-User
- 11.3 Nutraceutical Companies - Market size and forecast (2024-2029)
- Chart on Nutraceutical Companies - Market size and forecast (2024-2029) ($ million)
- Data Table on Nutraceutical Companies - Market size and forecast (2024-2029) ($ million)
- Chart on Nutraceutical Companies - Year-over-year growth (2024-2029) (%)
- Data Table on Nutraceutical Companies - Year-over-year growth (2024-2029) (%)
- 11.4 Pharmaceutical Companies - Market size and forecast (2024-2029)
- Chart on Pharmaceutical Companies - Market size and forecast (2024-2029) ($ million)
- Data Table on Pharmaceutical Companies - Market size and forecast (2024-2029) ($ million)
- Chart on Pharmaceutical Companies - Year-over-year growth (2024-2029) (%)
- Data Table on Pharmaceutical Companies - Year-over-year growth (2024-2029) (%)
- 11.5 Food & Beverage Companies - Market size and forecast (2024-2029)
- Chart on Food & Beverage Companies - Market size and forecast (2024-2029) ($ million)
- Data Table on Food & Beverage Companies - Market size and forecast (2024-2029) ($ million)
- Chart on Food & Beverage Companies - Year-over-year growth (2024-2029) (%)
- Data Table on Food & Beverage Companies - Year-over-year growth (2024-2029) (%)
- 11.6 Market opportunity by End-User
- Market opportunity by End-User ($ million)
- Data Table on Market opportunity by End-User ($ million)
12 Customer Landscape
- 12.1 Customer landscape overview
- Analysis of price sensitivity, lifecycle, customer purchase basket, adoption rates, and purchase criteria
13 Geographic Landscape
- 13.1 Geographic segmentation
- Chart on Market share by geography 2024-2029 (%)
- Data Table on Market share by geography 2024-2029 (%)
- 13.2 Geographic comparison
- Chart on Geographic comparison
- Data Table on Geographic comparison
- 13.3 North America - Market size and forecast 2024-2029
- Chart on North America - Market size and forecast 2024-2029 ($ million)
- Data Table on North America - Market size and forecast 2024-2029 ($ million)
- Chart on North America - Year-over-year growth 2024-2029 (%)
- Data Table on North America - Year-over-year growth 2024-2029 (%)
- 13.4 Europe - Market size and forecast 2024-2029
- Chart on Europe - Market size and forecast 2024-2029 ($ million)
- Data Table on Europe - Market size and forecast 2024-2029 ($ million)
- Chart on Europe - Year-over-year growth 2024-2029 (%)
- Data Table on Europe - Year-over-year growth 2024-2029 (%)
- 13.5 APAC - Market size and forecast 2024-2029
- Chart on APAC - Market size and forecast 2024-2029 ($ million)
- Data Table on APAC - Market size and forecast 2024-2029 ($ million)
- Chart on APAC - Year-over-year growth 2024-2029 (%)
- Data Table on APAC - Year-over-year growth 2024-2029 (%)
- 13.6 Middle East and Africa - Market size and forecast 2024-2029
- Chart on Middle East and Africa - Market size and forecast 2024-2029 ($ million)
- Data Table on Middle East and Africa - Market size and forecast 2024-2029 ($ million)
- Chart on Middle East and Africa - Year-over-year growth 2024-2029 (%)
- Data Table on Middle East and Africa - Year-over-year growth 2024-2029 (%)
- 13.7 South America - Market size and forecast 2024-2029
- Chart on South America - Market size and forecast 2024-2029 ($ million)
- Data Table on South America - Market size and forecast 2024-2029 ($ million)
- Chart on South America - Year-over-year growth 2024-2029 (%)
- Data Table on South America - Year-over-year growth 2024-2029 (%)
- 13.8 US - Market size and forecast 2024-2029
- Chart on US - Market size and forecast 2024-2029 ($ million)
- Data Table on US - Market size and forecast 2024-2029 ($ million)
- Chart on US - Year-over-year growth 2024-2029 (%)
- Data Table on US - Year-over-year growth 2024-2029 (%)
- 13.9 China - Market size and forecast 2024-2029
- Chart on China - Market size and forecast 2024-2029 ($ million)
- Data Table on China - Market size and forecast 2024-2029 ($ million)
- Chart on China - Year-over-year growth 2024-2029 (%)
- Data Table on China - Year-over-year growth 2024-2029 (%)
- 13.10 Germany - Market size and forecast 2024-2029
- Chart on Germany - Market size and forecast 2024-2029 ($ million)
- Data Table on Germany - Market size and forecast 2024-2029 ($ million)
- Chart on Germany - Year-over-year growth 2024-2029 (%)
- Data Table on Germany - Year-over-year growth 2024-2029 (%)
- 13.11 UK - Market size and forecast 2024-2029
- Chart on UK - Market size and forecast 2024-2029 ($ million)
- Data Table on UK - Market size and forecast 2024-2029 ($ million)
- Chart on UK - Year-over-year growth 2024-2029 (%)
- Data Table on UK - Year-over-year growth 2024-2029 (%)
- 13.12 Japan - Market size and forecast 2024-2029
- Chart on Japan - Market size and forecast 2024-2029 ($ million)
- Data Table on Japan - Market size and forecast 2024-2029 ($ million)
- Chart on Japan - Year-over-year growth 2024-2029 (%)
- Data Table on Japan - Year-over-year growth 2024-2029 (%)
- 13.13 India - Market size and forecast 2024-2029
- Chart on India - Market size and forecast 2024-2029 ($ million)
- Data Table on India - Market size and forecast 2024-2029 ($ million)
- Chart on India - Year-over-year growth 2024-2029 (%)
- Data Table on India - Year-over-year growth 2024-2029 (%)
- 13.14 Canada - Market size and forecast 2024-2029
- Chart on Canada - Market size and forecast 2024-2029 ($ million)
- Data Table on Canada - Market size and forecast 2024-2029 ($ million)
- Chart on Canada - Year-over-year growth 2024-2029 (%)
- Data Table on Canada - Year-over-year growth 2024-2029 (%)
- 13.15 France - Market size and forecast 2024-2029
- Chart on France - Market size and forecast 2024-2029 ($ million)
- Data Table on France - Market size and forecast 2024-2029 ($ million)
- Chart on France - Year-over-year growth 2024-2029 (%)
- Data Table on France - Year-over-year growth 2024-2029 (%)
- 13.16 South Korea - Market size and forecast 2024-2029
- Chart on South Korea - Market size and forecast 2024-2029 ($ million)
- Data Table on South Korea - Market size and forecast 2024-2029 ($ million)
- Chart on South Korea - Year-over-year growth 2024-2029 (%)
- Data Table on South Korea - Year-over-year growth 2024-2029 (%)
- 13.17 Australia - Market size and forecast 2024-2029
- Chart on Australia - Market size and forecast 2024-2029 ($ million)
- Data Table on Australia - Market size and forecast 2024-2029 ($ million)
- Chart on Australia - Year-over-year growth 2024-2029 (%)
- Data Table on Australia - Year-over-year growth 2024-2029 (%)
- 13.18 Market opportunity by geography
- Market opportunity by geography ($ million)
- Data Tables on Market opportunity by geography ($ million)
- 13.19 Italy - Market size and forecast (2024-2029)
- Chart on Italy - Market size and forecast (2024-2029) ($ million)
- Data Table on Italy - Market size and forecast (2024-2029) ($ million)
- Chart on Italy - Year-over-year growth (2024-2029) (%)
- Data Table on Italy - Year-over-year growth (2024-2029) (%)
- 13.20 Brazil - Market size and forecast (2024-2029)
- Chart on Brazil - Market size and forecast (2024-2029) ($ million)
- Data Table on Brazil - Market size and forecast (2024-2029) ($ million)
- Chart on Brazil - Year-over-year growth (2024-2029) (%)
- Data Table on Brazil - Year-over-year growth (2024-2029) (%)
- 13.21 Egypt - Market size and forecast (2024-2029)
- Chart on Egypt - Market size and forecast (2024-2029) ($ million)
- Data Table on Egypt - Market size and forecast (2024-2029) ($ million)
- Chart on Egypt - Year-over-year growth (2024-2029) (%)
- Data Table on Egypt - Year-over-year growth (2024-2029) (%)
- 13.22 UAE - Market size and forecast (2024-2029)
- Chart on UAE - Market size and forecast (2024-2029) ($ million)
- Data Table on UAE - Market size and forecast (2024-2029) ($ million)
- Chart on UAE - Year-over-year growth (2024-2029) (%)
- Data Table on UAE - Year-over-year growth (2024-2029) (%)
- 13.23 Oman - Market size and forecast (2024-2029)
- Chart on Oman - Market size and forecast (2024-2029) ($ million)
- Data Table on Oman - Market size and forecast (2024-2029) ($ million)
- Chart on Oman - Year-over-year growth (2024-2029) (%)
- Data Table on Oman - Year-over-year growth (2024-2029) (%)
- 13.24 Argentina - Market size and forecast (2024-2029)
- Chart on Argentina - Market size and forecast (2024-2029) ($ million)
- Data Table on Argentina - Market size and forecast (2024-2029) ($ million)
- Chart on Argentina - Year-over-year growth (2024-2029) (%)
- Data Table on Argentina - Year-over-year growth (2024-2029) (%)
- 13.25 KSA - Market size and forecast (2024-2029)
- Chart on KSA - Market size and forecast (2024-2029) ($ million)
- Data Table on KSA - Market size and forecast (2024-2029) ($ million)
- Chart on KSA - Year-over-year growth (2024-2029) (%)
- Data Table on KSA - Year-over-year growth (2024-2029) (%)
- 13.26 Rest of World (ROW) - Market size and forecast (2024-2029)
- Chart on Rest of World (ROW) - Market size and forecast (2024-2029) ($ million)
- Data Table on Rest of World (ROW) - Market size and forecast (2024-2029) ($ million)
- Chart on Rest of World (ROW) - Year-over-year growth (2024-2029) (%)
- Data Table on Rest of World (ROW) - Year-over-year growth (2024-2029) (%)
14 Drivers, Challenges, and Opportunity/Restraints
- 14.3 Impact of drivers and challenges
- Impact of drivers and challenges in 2024 and 2029
- 14.4 Market opportunities/restraints
15 Competitive Landscape
- 15.2 Competitive Landscape
- Overview on criticality of inputs and factors of differentiation
- 15.3 Landscape disruption
- Overview on factors of disruption
- 15.4 Industry risks
- Impact of key risks on business
16 Competitive Analysis
- 16.2 Market positioning of companies
- Matrix on companies position and classification
- 16.3 Aenova Group
- Aenova Group - Overview
- Aenova Group - Product / Service
- Aenova Group - Key offerings
- 16.4 Arjuna Natural Pvt Ltd
- Arjuna Natural Pvt Ltd - Overview
- Arjuna Natural Pvt Ltd - Product / Service
- Arjuna Natural Pvt Ltd - Key offerings
- 16.5 Capsugel (Lonza)
- Capsugel (Lonza) - Overview
- Capsugel (Lonza) - Product / Service
- Capsugel (Lonza) - Key offerings
- 16.6 Catalent, Inc.
- Catalent, Inc. - Overview
- Catalent, Inc. - Product / Service
- Catalent, Inc. - Key offerings
- 16.7 Church & Dwight Co., Inc.
- Church & Dwight Co., Inc. - Overview
- Church & Dwight Co., Inc. - Product / Service
- Church & Dwight Co., Inc. - Key offerings
- 16.8 DSM Nutritional Products
- DSM Nutritional Products - Overview
- DSM Nutritional Products - Product / Service
- DSM Nutritional Products - Key offerings
- 16.9 Eurofins Scientific SE
- Eurofins Scientific SE - Overview
- Eurofins Scientific SE - Product / Service
- Eurofins Scientific SE - Key offerings
- 16.10 Glanbia PLC
- Glanbia PLC - Overview
- Glanbia PLC - Product / Service
- Glanbia PLC - Key offerings
- 16.11 Hermes Pharma GmbH
- Hermes Pharma GmbH - Overview
- Hermes Pharma GmbH - Product / Service
- Hermes Pharma GmbH - Key offerings
- 16.12 Kaged Muscle
- Kaged Muscle - Overview
- Kaged Muscle - Product / Service
- Kaged Muscle - Key offerings
- 16.13 Lonza Group AG
- Lonza Group AG - Overview
- Lonza Group AG - Product / Service
- Lonza Group AG - Key offerings
- 16.14 Nutrilo GmbH
- Nutrilo GmbH - Overview
- Nutrilo GmbH - Product / Service
- Nutrilo GmbH - Key offerings
- 16.15 Piramal Pharma Solutions
- Piramal Pharma Solutions - Overview
- Piramal Pharma Solutions - Product / Service
- Piramal Pharma Solutions - Key offerings
- 16.16 Robinson Pharma, Inc.
- Robinson Pharma, Inc. - Overview
- Robinson Pharma, Inc. - Product / Service
- Robinson Pharma, Inc. - Key offerings
- 16.17 Sakura Pharma Co., Ltd.
- Sakura Pharma Co., Ltd. - Overview
- Sakura Pharma Co., Ltd. - Product / Service
- Sakura Pharma Co., Ltd. - Key offerings
- 16.18 Sirio Pharma Co., Ltd.
- Sirio Pharma Co., Ltd. - Overview
- Sirio Pharma Co., Ltd. - Product / Service
- Sirio Pharma Co., Ltd. - Key offerings
- 16.19 SFI Health (formerly Schwabe North America Inc.)
- SFI Health (formerly Schwabe North America Inc.) - Overview
- SFI Health (formerly Schwabe North America Inc.) - Product / Service
- SFI Health (formerly Schwabe North America Inc.) - Key offerings
- 16.20 Swiss Caps AG
- Swiss Caps AG - Overview
- Swiss Caps AG - Product / Service
- Swiss Caps AG - Key offerings
- 16.21 Tishcon Corp.
- Tishcon Corp. - Overview
- Tishcon Corp. - Product / Service
- Tishcon Corp. - Key offerings
- 16.22 Vitakem Nutraceutical Inc.
- Vitakem Nutraceutical Inc. - Overview
- Vitakem Nutraceutical Inc. - Product / Service
- Vitakem Nutraceutical Inc. - Key offerings
- 16.23 Ashland Inc.
- Ashland Inc. - Overview
- Ashland Inc. - Product / Service
- Ashland Inc. - Key offerings
- 16.24 Biotrex Nutraceuticals
- Biotrex Nutraceuticals - Overview
- Biotrex Nutraceuticals - Product / Service
- Biotrex Nutraceuticals - Key offerings
- 16.25 Biovencer Healthcare Pvt. Ltd.
- Biovencer Healthcare Pvt. Ltd. - Overview
- Biovencer Healthcare Pvt. Ltd. - Product / Service
- Biovencer Healthcare Pvt. Ltd. - Key offerings
- 16.26 CAPTEK Softgel International Inc.
- CAPTEK Softgel International Inc. - Overview
- CAPTEK Softgel International Inc. - Product / Service
- CAPTEK Softgel International Inc. - Key offerings
- 16.27 Divine Design Manufacturing
- Divine Design Manufacturing - Overview
- Divine Design Manufacturing - Product / Service
- Divine Design Manufacturing - Key offerings
- 16.28 Gemini Pharmaceuticals
- Gemini Pharmaceuticals - Overview
- Gemini Pharmaceuticals - Product / Service
- Gemini Pharmaceuticals - Key offerings
- 16.29 Hendel LLC
- Hendel LLC - Overview
- Hendel LLC - Product / Service
- Hendel LLC - Key offerings
- 16.30 Lonza Group Ltd.
- Lonza Group Ltd. - Overview
- Lonza Group Ltd. - Product / Service
- Lonza Group Ltd. - Key offerings
- 16.31 MARTINEZ NIETO S.A
- MARTINEZ NIETO S.A - Overview
- MARTINEZ NIETO S.A - Product / Service
- MARTINEZ NIETO S.A - Key offerings
- 16.32 MediGrUn Naturprodukte GmbH
- MediGrUn Naturprodukte GmbH - Overview
- MediGrUn Naturprodukte GmbH - Product / Service
- MediGrUn Naturprodukte GmbH - Key offerings
- 16.33 NutraScience Labs
- NutraScience Labs - Overview
- NutraScience Labs - Product / Service
- NutraScience Labs - Key offerings
- 16.34 Rain Nutrience
- Rain Nutrience - Overview
- Rain Nutrience - Product / Service
- Rain Nutrience - Key offerings
- 16.35 Sirio Pharma Co. Ltd.
- Sirio Pharma Co. Ltd. - Overview
- Sirio Pharma Co. Ltd. - Product / Service
- Sirio Pharma Co. Ltd. - Key offerings
- 16.36 Soft Gel Technologies Inc.
- Soft Gel Technologies Inc. - Overview
- Soft Gel Technologies Inc. - Product / Service
- Soft Gel Technologies Inc. - Key offerings
- 16.37 Trividia Manufacturing Solutions Inc.
- Trividia Manufacturing Solutions Inc. - Overview
- Trividia Manufacturing Solutions Inc. - Product / Service
- Trividia Manufacturing Solutions Inc. - Key offerings
17 Appendix
- 17.2 Inclusions and exclusions checklist
- Inclusions checklist
- Exclusions checklist
- 17.3 Currency conversion rates for US$
- Currency conversion rates for US$
- 17.4 Research methodology
- 17.7 Validation techniques employed for market sizing
- Validation techniques employed for market sizing
- 17.9 360 degree market analysis
- 360 degree market analysis
- 17.10 List of abbreviations