Emotion AI Market Analysis, Size, and Forecast 2026-2030: APAC (China, Japan, and South Korea), North America (US, Canada, and Mexico), Europe (Germany, UK, and France), South America (Brazil, Argentina, and Colombia), Middle East and Africa (UAE, Saudi Arabia, and South Africa), and Rest of World (ROW)

Emotion AI Market Analysis, Size, and Forecast 2026-2030:
APAC (China, Japan, and South Korea), North America (US, Canada, and Mexico), Europe (Germany, UK, and France), South America (Brazil, Argentina, and Colombia), Middle East and Africa (UAE, Saudi Arabia, and South Africa), and Rest of World (ROW)

Published: May 2026 296 Pages SKU: IRTNTR80668

Market Overview at a Glance

$17.38 B
Market Opportunity
27.8%
CAGR 2025 - 2030
39%
APAC Growth
$1.79 B
Video segment 2024

Emotion AI Market Size 2026-2030

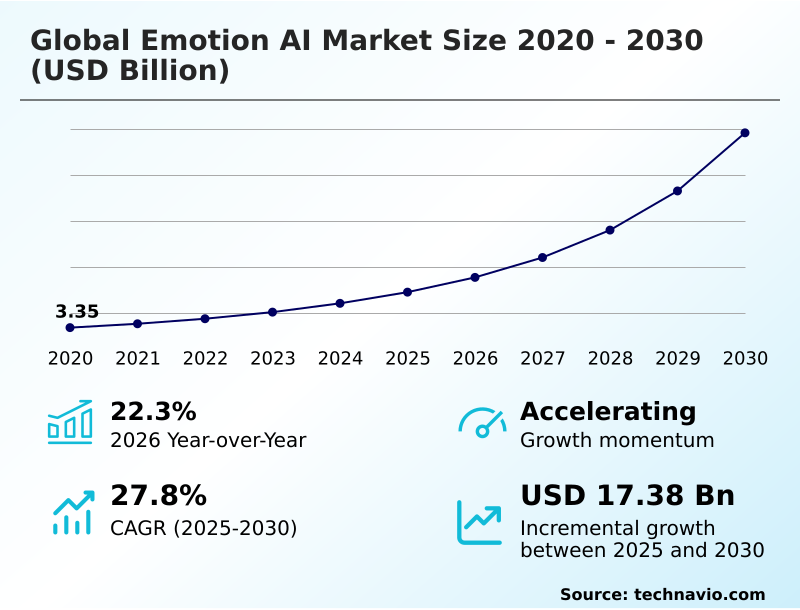
The Emotion AI Market size was valued at USD 7.22 billion in 2025, growing at a CAGR of 27.8% during the forecast period 2026-2030.

Major Market Trends & Insights

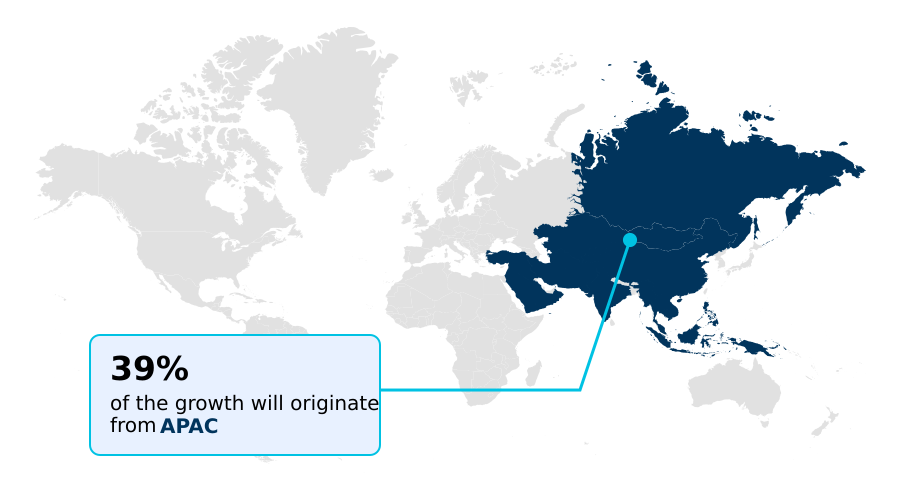
  • APAC dominated the market and accounted for a 39% growth during the forecast period.
  • By Type - Video segment was valued at USD 1.79 billion in 2024
  • By Technology - Machine learning segment accounted for the largest market revenue share in 2024

Market Size & Forecast

  • Historic Market Opportunities 2020-2024: USD 21.25 billion
  • Market Future Opportunities 2025-2030: USD 17.38 billion
  • CAGR from 2025 to 2030 : 27.8%

Market Summary

  • The emotion AI market is characterized by rapid technological advancement, with on-device processing reducing latency by over 50% compared to traditional cloud-based systems. This shift is critical in automotive applications, where driver monitoring systems must provide real-time alerts to prevent accidents.
  • For instance, a logistics firm can use in-cabin sensing to detect driver fatigue, potentially reducing fatigue-related incidents by up to 30%. The primary driver is the enterprise-wide pursuit of enhanced customer experience, using affective computing to analyze interactions and foster loyalty.
  • However, the market faces a significant challenge in navigating regulatory fragmentation and the absence of industry standards, which creates compliance complexities and hinders the development of interoperable solutions, impacting large-scale deployment strategies.

What will be the Size of the Emotion AI Market during the forecast period?

Get Key Insights on Market Forecast (PDF) Request Free Sample

How is the Emotion AI Market Segmented?

The emotion ai industry research report provides comprehensive data (region-wise segment analysis), with forecasts and analysis for the period 2026-2030, as well as historical data from 2020-2024 for the following segments.

  • Type
    • Video
    • Voice-focused
    • Multimodal
    • Text-focused
  • Technology
    • Machine learning
    • Natural language processing
    • Others
  • Component
    • Software
    • Services
  • Geography
    • APAC
      • China
      • Japan
      • South Korea
    • North America
      • US
      • Canada
      • Mexico
    • Europe
      • Germany
      • UK
      • France
    • South America
      • Brazil
      • Argentina
      • Colombia
    • Middle East and Africa
      • UAE
      • Saudi Arabia
      • South Africa
    • Rest of World (ROW)

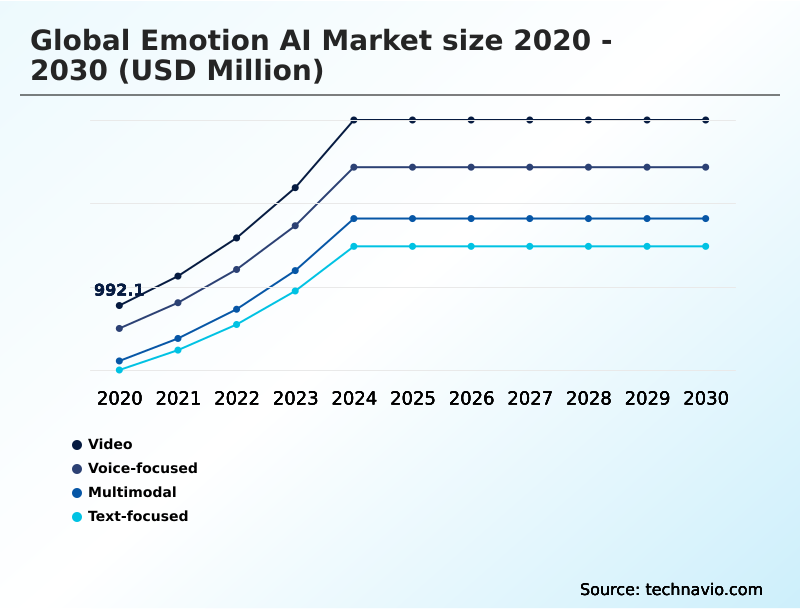
How is the Emotion AI Market Segmented by Type?

The video segment is estimated to witness significant growth during the forecast period.

The video segment, centered on facial expression analysis, faces a 15% performance degradation in suboptimal lighting, directly impacting reliability in real-world applications.

This modality utilizes computer vision and deep convolutional neural networks to decode action units, providing granular emotional insights that are often more authentic than verbal feedback.

Its application in controlled environments, such as market research where it can improve user feedback accuracy by up to 20%, drives demand despite challenges.

However, the technology's effectiveness depends on overcoming occlusions and the significant cultural variance in emotional expression, which requires extensive and diverse training datasets for its affective computing models to achieve contextual generalizability and avoid demographic bias.

Request Free Sample

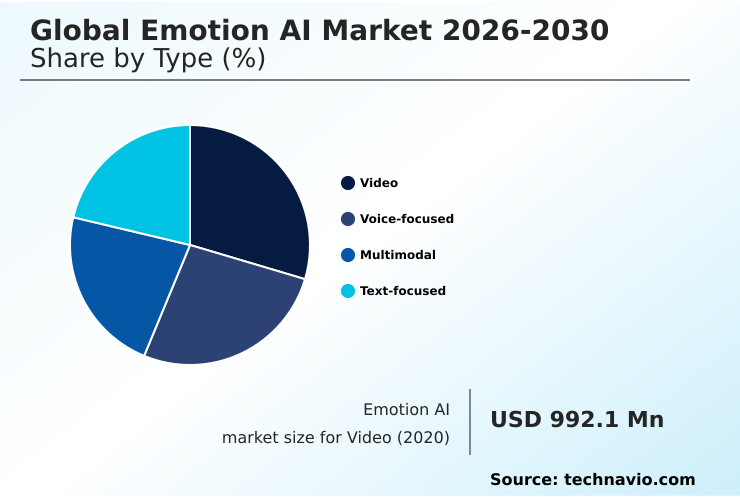
The Video segment was valued at USD 1.79 billion in 2024 and showed a gradual increase during the forecast period.

Request Free Sample

How demand for the Emotion AI market is rising in the leading region?

APAC is estimated to contribute 39% to the growth of the global market during the forecast period.Technavio’s analysts have elaborately explained the regional trends and drivers that shape the market during the forecast period.

See How Emotion AI Market demand is rising in APAC Request Free Sample

The geographic landscape of the global emotion AI market is led by APAC, which is projected to have the fastest growth rate at 28.6%, slightly outpacing North America's 27.6%.

This rapid expansion, contributing 39% of the market's incremental growth, is fueled by swift digitalization and strong government support in countries like China and India.

The US remains the single largest market, accounting for over 25% of the 2025 market share, driven by advanced applications in healthcare and automotive sectors, including sophisticated driver monitoring systems.

Differences in regional adoption are significant; European markets prioritize ethical AI and data governance due to strict GDPR regulations, whereas APAC's large-scale data availability accelerates the development of advanced psycholinguistic analysis and conversational analytics models.

What are the key Drivers, Trends, and Challenges in the Emotion AI Market?

Our researchers analyzed the data with 2025 as the base year, along with the key drivers, trends, and challenges. A holistic analysis of drivers will help companies refine their marketing strategies to gain a competitive advantage.

  • Enterprises are increasingly seeking specialized applications, prompting inquiries into how multimodal emotion AI for healthcare can improve remote patient monitoring and diagnostics. The need for transparency in automated decision-making drives interest in explainable AI in customer service, where systems must justify their outputs to meet both regulatory requirements and build user trust.
  • In the automotive sector, the focus on safety and user experience makes automotive in-cabin sensing solutions a critical area of R&D, with a goal of reducing driver distraction by over 40% compared to systems without emotional context. Similarly, the demand for accessible mental health tools fuels the development of emotion AI for mental wellness platforms.
  • For businesses, the focus is on practical implementation, leading to searches for a robust on-device emotion recognition API that ensures data privacy and real-time responsiveness.
  • This is particularly relevant in contact centers, where voice emotion recognition for call centers can improve first-call resolution rates by up to 15% by providing agents with immediate feedback on customer sentiment, demonstrating a clear ROI over traditional quality assurance methods.

What are the key market drivers leading to the rise in the adoption of Emotion AI Industry?

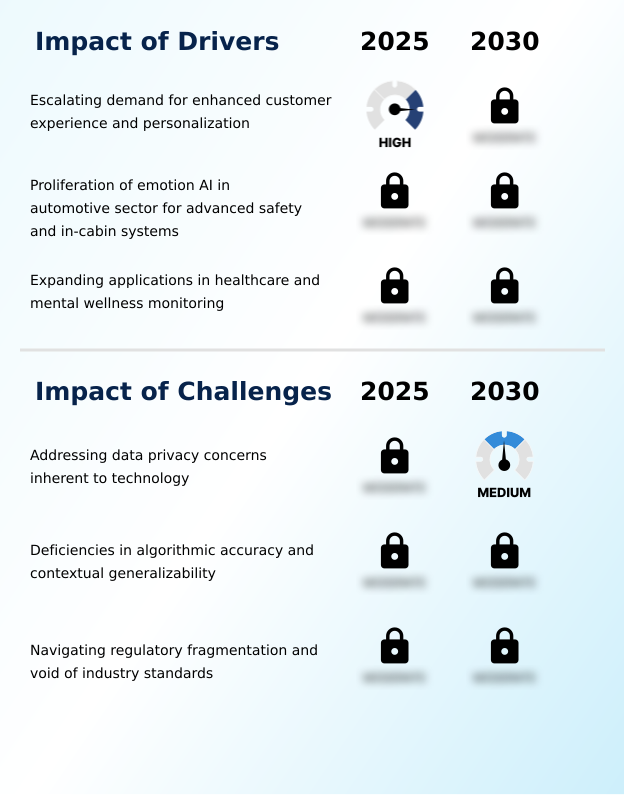
  • The escalating enterprise demand for enhanced customer experience and hyper-personalization is a primary driver propelling the global emotion AI market's growth.

  • The escalating enterprise focus on delivering a superior customer experience is a primary driver for the emotion AI market, with businesses using the technology seeing up to a 15% increase in customer retention rates.
  • Organizations are leveraging emotion AI to analyze implicit emotional cues from human-computer interaction, moving beyond traditional feedback methods. In contact centers, real-time conversational analytics of vocal biomarkers improves first-call resolution by over 10% by identifying customer frustration instantly.
  • Another powerful driver is the proliferation of emotion AI in the automotive sector for advanced driver monitoring systems. These systems use affective computing to detect driver fatigue and distraction, enhancing vehicle safety.
  • The expanding applications in healthcare for mental wellness and digital therapeutics further propel market growth.

What are the market trends shaping the Emotion AI Industry?

  • A defining market trend is the shift toward multimodal emotion AI, which integrates and analyzes multiple data streams simultaneously for a more accurate and nuanced understanding of human affective states.

  • A defining trend in the emotion AI market is the shift toward multimodal AI systems, which demonstrate a 20-30% improvement in accuracy over unimodal approaches. By integrating inputs from facial expression analysis, speech sentiment analysis, and physiological signals, these systems provide a more holistic contextual understanding of a user's state.
  • This move is driven by the demand for higher fidelity in critical applications like automotive safety and healthcare diagnostics. This technological progression compels investment in advanced sensor fusion algorithms and machine learning models capable of processing complex datasets.
  • Consequently, on-device processing is also gaining traction, as it addresses data privacy concerns by keeping sensitive biometric data localized, a key requirement for building consumer trust and complying with data governance regulations.

What challenges does the Emotion AI Industry face during its growth?

  • A paramount challenge confronting the industry is addressing the profound data privacy and ethical concerns inherent in the technology, which can act as a significant barrier to consumer trust and market adoption.

  • A formidable challenge for the emotion AI market is the technical limitation of algorithmic accuracy, with some models showing error rate disparities of over 15% across different demographic groups. This issue stems from a lack of contextual generalizability and inherent demographic bias in training data, which undermines system credibility in high-stakes applications.
  • Current models often fail to interpret cultural variance in emotional expression, limiting the scalability of a single solution across global markets. Another significant restraint is the fragmented and uncertain regulatory environment.
  • The absence of cohesive industry standards and the presence of black box models make it difficult for customers to verify performance claims, creating a barrier to market penetration that can slow adoption rates by as much as 25% in risk-averse sectors.

Exclusive Technavio Analysis on Customer Landscape

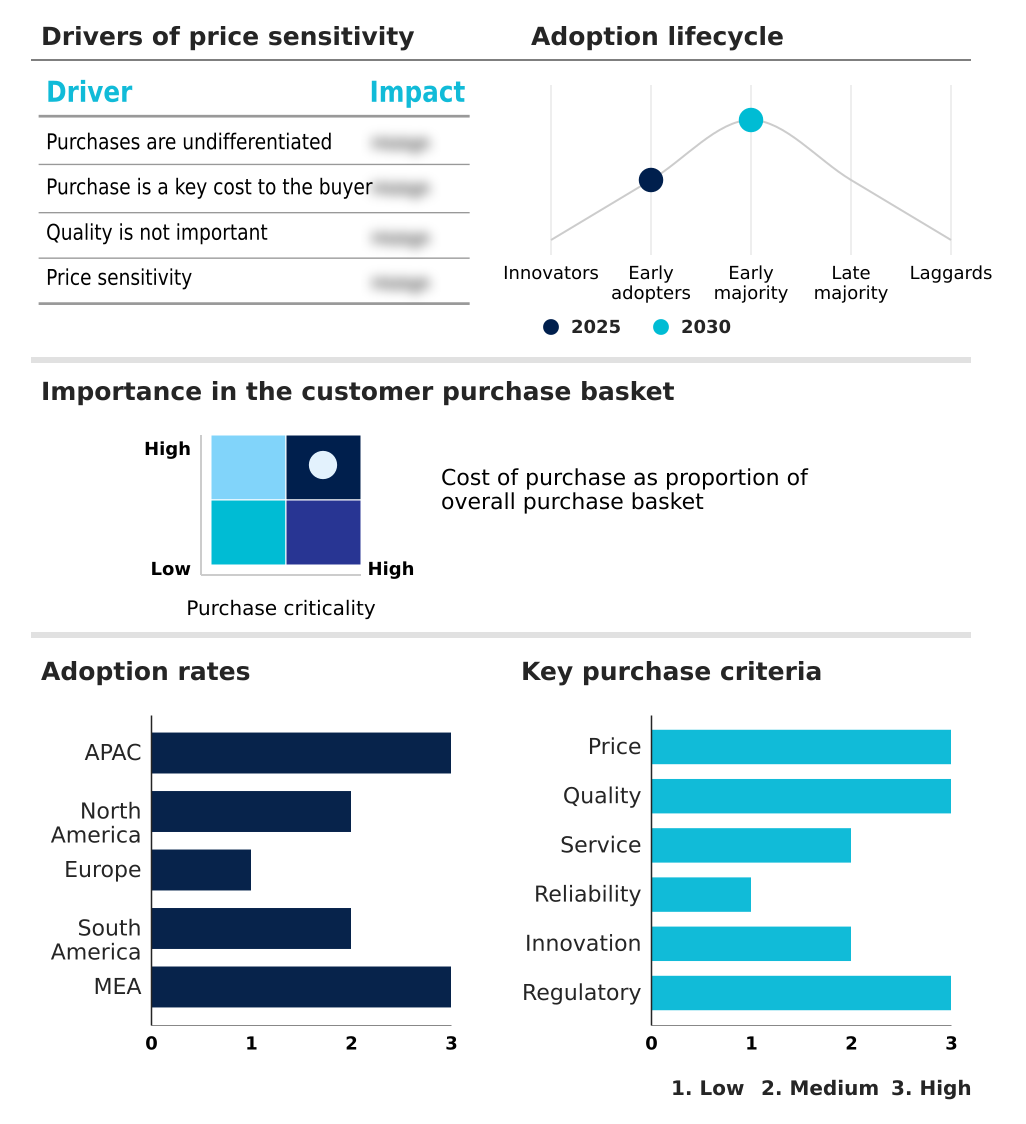
The emotion ai market forecasting report includes the adoption lifecycle of the market, covering from the innovator’s stage to the laggard’s stage. It focuses on adoption rates in different regions based on penetration. Furthermore, the emotion ai market report also includes key purchase criteria and drivers of price sensitivity to help companies evaluate and develop their market growth analysis strategies.

Customer Landscape of Emotion AI Industry

Competitive Landscape

Companies are implementing various strategies, such as strategic alliances, emotion ai market forecast, partnerships, mergers and acquisitions, geographical expansion, and product/service launches, to enhance their presence in the industry.

Amazon Web Services Inc. - Delivers real-time emotion AI insights through scalable facial analysis and sentiment detection, enabling deeper understanding from image, video, and text data for enterprise applications.

The industry research and growth report includes detailed analyses of the competitive landscape of the market and information about key companies, including:

  • Amazon Web Services Inc.
  • audEERING GmbH
  • Behavioral Signal
  • Cipia Vision Ltd.
  • Cogito Corp
  • Entropik Technologies Pvt. Ltd
  • Google LLC
  • Hume AI Inc.
  • IBM Corp.
  • Microsoft Corp.
  • Morphcast Inc.
  • Noldus Information Technology
  • Opsis Pte. Ltd.
  • Realeyes
  • Siena
  • Superceed
  • Symanto
  • Uniphore Technologies Inc.
  • VIER GmbH.
  • Voicesense

Qualitative and quantitative analysis of companies has been conducted to help clients understand the wider business environment as well as the strengths and weaknesses of key industry players. Data is qualitatively analyzed to categorize companies as pure play, category-focused, industry-focused, and diversified; it is quantitatively analyzed to categorize companies as dominant, leading, strong, tentative, and weak.

Market Intelligence Radar: High-Impact Developments & Growth Signals

  • In the Application Software industry, the rising adoption of enterprise analytics to process large data volumes has directly fueled demand for emotion AI, as businesses seek to extract nuanced emotional insights from unstructured customer data.
  • The growing deployment of subscription-based SaaS models has lowered adoption barriers for advanced tools, enabling SMEs to integrate sophisticated emotion AI capabilities into their workflows without significant upfront capital expenditure on infrastructure.
  • Increased automation of business processes through Robotic Process Automation (RPA) is creating new use cases for emotion AI, particularly in monitoring and optimizing human-robot collaboration and service bot interactions.
  • Heightened data security concerns associated with cloud-based platforms are compelling emotion AI providers to prioritize robust data governance and develop hybrid solutions that incorporate secure on-device processing.

Dive into Technavio’s robust research methodology, blending expert interviews, extensive data synthesis, and validated models for unparalleled Emotion AI Market insights. See full methodology.

Market Scope
Page number 296
Base year 2025
Historic period 2020-2024
Forecast period 2026-2030
Growth momentum & CAGR Accelerate at a CAGR of 27.8%
Market growth 2026-2030 USD 17378.2 million
Market structure Fragmented
YoY growth 2025-2026(%) 22.3%
Key countries China, Japan, South Korea, India, Australia, Indonesia, US, Canada, Mexico, Germany, UK, France, Italy, Spain, The Netherlands, Brazil, Argentina, Colombia, UAE, Saudi Arabia, South Africa, Israel and Turkey
Competitive landscape Leading Companies, Market Positioning of Companies, Competitive Strategies, and Industry Risks

Request Free Sample

Research Analyst Overview

  • The emotion AI market ecosystem is a complex network where technology providers and end-users interact within a rapidly evolving regulatory framework. Cloud infrastructure providers like Amazon Web Services Inc. and Google LLC supply the foundational computing power, forming a critical input for the value chain.
  • Specialized software companies then develop proprietary sensor fusion algorithms and machine learning models, which are delivered as APIs or standalone platforms. These solutions are adopted by end-use industries such as automotive, where they are integrated into in-cabin systems, and healthcare, which uses them for remote patient monitoring. The software segment dominates the market, accounting for over 60% of total revenue.
  • Regulatory bodies and a lack of universal industry standards introduce significant friction, influencing both product development and international deployment strategies for this biometric data technology.

What are the Key Data Covered in this Emotion AI Market Research and Growth Report?

  • What is the expected growth of the Emotion AI Market between 2026 and 2030?

    • The Emotion AI Market is expected to grow by USD 17.38 billion during 2026-2030, registering a CAGR of 27.8%. Year-over-year growth in 2026 is estimated at 22.3%%. This acceleration is shaped by escalating demand for enhanced customer experience and personalization, which is intensifying demand across multiple end-use verticals covered in the report.

  • What segmentation does the market report cover?

    • The report is segmented by Type (Video, Voice-focused, Multimodal, and Text-focused), Technology (Machine learning, Natural language processing, and Others), Component (Software, and Services) and Geography (APAC, North America, Europe, South America, Middle East and Africa). Among these, the Video segment is estimated to witness significant growth during the forecast period, driven by rising adoption across key application areas. Each segment includes detailed qualitative and quantitative analysis, along with historical data from 2020-2024 and forecasts through 2030 with year-over-year growth rates.

  • Which regions are analyzed in the report?

    • The report covers APAC, North America, Europe, South America and Middle East and Africa. APAC is estimated to contribute 39% to market growth during the forecast period. Country-level analysis includes China, Japan, South Korea, India, Australia, Indonesia, US, Canada, Mexico, Germany, UK, France, Italy, Spain, The Netherlands, Brazil, Argentina, Colombia, UAE, Saudi Arabia, South Africa, Israel and Turkey, with dedicated market size tables and year-over-year growth for each.

  • What are the key growth drivers and market challenges?

    • The primary driver is escalating demand for enhanced customer experience and personalization, which is accelerating investment and industry demand. The main challenge is addressing data privacy concerns inherent to technology, creating operational barriers for key market participants. The report quantifies the impact of each driver and challenge across 2026 and 2030 with comparative analysis.

  • Who are the major players in the Emotion AI Market?

    • Key vendors include Amazon Web Services Inc., audEERING GmbH, Behavioral Signal, Cipia Vision Ltd., Cogito Corp, Entropik Technologies Pvt. Ltd, Google LLC, Hume AI Inc., IBM Corp., Microsoft Corp., Morphcast Inc., Noldus Information Technology, Opsis Pte. Ltd., Realeyes, Siena, Superceed, Symanto, Uniphore Technologies Inc., VIER GmbH. and Voicesense. The report provides qualitative and quantitative analysis categorizing companies as dominant, leading, strong, tentative, and weak based on their market positioning. Company profiles include business segment analysis, SWOT assessment, key offerings, and recent strategic developments.

Market Research Insights

  • The competitive landscape for emotion AI is highly fragmented, with specialized firms capturing over 40% of niche application markets like automotive sensing. Major technology corporations such as Microsoft Corp. and Amazon Web Services Inc. leverage their vast cloud infrastructure to offer scalable emotion AI services, often bundled within broader AI platforms.
  • Recent developments are focused on improving algorithmic accuracy and addressing ethical AI concerns, with investment in explainable AI (XAI) growing by nearly 30%. For instance, Affectiva's funding round was aimed at expanding its footprint in automotive and marketing verticals, highlighting the demand for industry-specific solutions.
  • This innovation is a direct response to enterprise needs for more transparent and trustworthy systems, especially as challenges like data privacy and algorithmic bias remain significant hurdles to wider adoption.

We can help! Our analysts can customize this emotion ai market research report to meet your requirements.

Get in touch

1. Executive Summary

1.1 Market overview

Executive Summary - Chart on Market Overview
Executive Summary - Data Table on Market Overview
Executive Summary - Chart on Global Market Characteristics
Executive Summary - Chart on Market by Geography
Executive Summary - Chart on Market Segmentation by Type
Executive Summary - Chart on Market Segmentation by Technology
Executive Summary - Chart on Market Segmentation by Component
Executive Summary - Chart on Incremental Growth
Executive Summary - Data Table on Incremental Growth
Executive Summary - Chart on Company Market Positioning

2. Technavio Analysis

2.1 Analysis of price sensitivity, lifecycle, customer purchase basket, adoption rates, and purchase criteria

2.2 Criticality of inputs and Factors of differentiation

Chart on Overview on criticality of inputs and factors of differentiation

2.3 Factors of disruption

Chart on Overview on factors of disruption

2.4 Impact of drivers and challenges

Chart on Impact of drivers and challenges in 2025 and 2030

3. Market Landscape

3.1 Market ecosystem

Chart on Parent Market
Data Table on - Parent Market

3.2 Market characteristics

Chart on Market characteristics analysis

3.3 Value chain analysis

Chart on Value chain analysis

4. Market Sizing

4.1 Market definition

Data Table on Offerings of companies included in the market definition

4.2 Market segment analysis

Market segments

4.3 Market size 2025

4.4 Market outlook: Forecast for 2025-2030

Chart on Global - Market size and forecast 2025-2030 ($ million)
Data Table on Global - Market size and forecast 2025-2030 ($ million)
Chart on Global Market: Year-over-year growth 2025-2030 (%)
Data Table on Global Market: Year-over-year growth 2025-2030 (%)

5. Historic Market Size

5.1 Global Emotion AI Market 2020 - 2024

Historic Market Size - Data Table on Global Emotion AI Market 2020 - 2024 ($ million)

5.2 Type segment analysis 2020 - 2024

Historic Market Size - Type Segment 2020 - 2024 ($ million)

5.3 Technology segment analysis 2020 - 2024

Historic Market Size - Technology Segment 2020 - 2024 ($ million)

5.4 Component segment analysis 2020 - 2024

Historic Market Size - Component Segment 2020 - 2024 ($ million)

5.5 Geography segment analysis 2020 - 2024

Historic Market Size - Geography Segment 2020 - 2024 ($ million)

5.6 Country segment analysis 2020 - 2024

Historic Market Size - Country Segment 2020 - 2024 ($ million)

6. Qualitative Analysis

6.1 Impact of geopolitical conflicts on global emotion AI market

7. Five Forces Analysis

7.1 Five forces summary

Five forces analysis - Comparison between 2025 and 2030

7.2 Bargaining power of buyers

Bargaining power of buyers - Impact of key factors 2025 and 2030

7.3 Bargaining power of suppliers

Bargaining power of suppliers - Impact of key factors in 2025 and 2030

7.4 Threat of new entrants

Threat of new entrants - Impact of key factors in 2025 and 2030

7.5 Threat of substitutes

Threat of substitutes - Impact of key factors in 2025 and 2030

7.6 Threat of rivalry

Threat of rivalry - Impact of key factors in 2025 and 2030

7.7 Market condition

Chart on Market condition - Five forces 2025 and 2030

8. Market Segmentation by Type

8.1 Market segments

Chart on Type - Market share 2025-2030 (%)
Data Table on Type - Market share 2025-2030 (%)

8.2 Comparison by Type

Chart on Comparison by Type
Data Table on Comparison by Type

8.3 Video - Market size and forecast 2025-2030

Chart on Video - Market size and forecast 2025-2030 ($ million)
Data Table on Video - Market size and forecast 2025-2030 ($ million)
Chart on Video - Year-over-year growth 2025-2030 (%)
Data Table on Video - Year-over-year growth 2025-2030 (%)

8.4 Voice-focused - Market size and forecast 2025-2030

Chart on Voice-focused - Market size and forecast 2025-2030 ($ million)
Data Table on Voice-focused - Market size and forecast 2025-2030 ($ million)
Chart on Voice-focused - Year-over-year growth 2025-2030 (%)
Data Table on Voice-focused - Year-over-year growth 2025-2030 (%)

8.5 Multimodal - Market size and forecast 2025-2030

Chart on Multimodal - Market size and forecast 2025-2030 ($ million)
Data Table on Multimodal - Market size and forecast 2025-2030 ($ million)
Chart on Multimodal - Year-over-year growth 2025-2030 (%)
Data Table on Multimodal - Year-over-year growth 2025-2030 (%)

8.6 Text-focused - Market size and forecast 2025-2030

Chart on Text-focused - Market size and forecast 2025-2030 ($ million)
Data Table on Text-focused - Market size and forecast 2025-2030 ($ million)
Chart on Text-focused - Year-over-year growth 2025-2030 (%)
Data Table on Text-focused - Year-over-year growth 2025-2030 (%)

8.7 Market opportunity by Type

Market opportunity by Type ($ million)
Data Table on Market opportunity by Type ($ million)

9. Market Segmentation by Technology

9.1 Market segments

Chart on Technology - Market share 2025-2030 (%)
Data Table on Technology - Market share 2025-2030 (%)

9.2 Comparison by Technology

Chart on Comparison by Technology
Data Table on Comparison by Technology

9.3 Machine learning - Market size and forecast 2025-2030

Chart on Machine learning - Market size and forecast 2025-2030 ($ million)
Data Table on Machine learning - Market size and forecast 2025-2030 ($ million)
Chart on Machine learning - Year-over-year growth 2025-2030 (%)
Data Table on Machine learning - Year-over-year growth 2025-2030 (%)

9.4 Natural language processing - Market size and forecast 2025-2030

Chart on Natural language processing - Market size and forecast 2025-2030 ($ million)
Data Table on Natural language processing - Market size and forecast 2025-2030 ($ million)
Chart on Natural language processing - Year-over-year growth 2025-2030 (%)
Data Table on Natural language processing - Year-over-year growth 2025-2030 (%)

9.5 Others - Market size and forecast 2025-2030

Chart on Others - Market size and forecast 2025-2030 ($ million)
Data Table on Others - Market size and forecast 2025-2030 ($ million)
Chart on Others - Year-over-year growth 2025-2030 (%)
Data Table on Others - Year-over-year growth 2025-2030 (%)

9.6 Market opportunity by Technology

Market opportunity by Technology ($ million)
Data Table on Market opportunity by Technology ($ million)

10. Market Segmentation by Component

10.1 Market segments

Chart on Component - Market share 2025-2030 (%)
Data Table on Component - Market share 2025-2030 (%)

10.2 Comparison by Component

Chart on Comparison by Component
Data Table on Comparison by Component

10.3 Software - Market size and forecast 2025-2030

Chart on Software - Market size and forecast 2025-2030 ($ million)
Data Table on Software - Market size and forecast 2025-2030 ($ million)
Chart on Software - Year-over-year growth 2025-2030 (%)
Data Table on Software - Year-over-year growth 2025-2030 (%)

10.4 Services - Market size and forecast 2025-2030

Chart on Services - Market size and forecast 2025-2030 ($ million)
Data Table on Services - Market size and forecast 2025-2030 ($ million)
Chart on Services - Year-over-year growth 2025-2030 (%)
Data Table on Services - Year-over-year growth 2025-2030 (%)

10.5 Market opportunity by Component

Market opportunity by Component ($ million)
Data Table on Market opportunity by Component ($ million)

11. Customer Landscape

11.1 Customer landscape overview

Analysis of price sensitivity, lifecycle, customer purchase basket, adoption rates, and purchase criteria

12. Geographic Landscape

12.1 Geographic segmentation

Chart on Market share by geography 2025-2030 (%)
Data Table on Market share by geography 2025-2030 (%)

12.2 Geographic comparison

Chart on Geographic comparison
Data Table on Geographic comparison

12.3 APAC - Market size and forecast 2025-2030

Chart on APAC - Market size and forecast 2025-2030 ($ million)
Data Table on APAC - Market size and forecast 2025-2030 ($ million)
Chart on APAC - Year-over-year growth 2025-2030 (%)
Data Table on APAC - Year-over-year growth 2025-2030 (%)
Chart on Regional Comparison - APAC
Data Table on Regional Comparison - APAC

12.3.1 China - Market size and forecast 2025-2030

Chart on China - Market size and forecast 2025-2030 ($ million)
Data Table on China - Market size and forecast 2025-2030 ($ million)
Chart on China - Year-over-year growth 2025-2030 (%)
Data Table on China - Year-over-year growth 2025-2030 (%)

12.3.2 Japan - Market size and forecast 2025-2030

Chart on Japan - Market size and forecast 2025-2030 ($ million)
Data Table on Japan - Market size and forecast 2025-2030 ($ million)
Chart on Japan - Year-over-year growth 2025-2030 (%)
Data Table on Japan - Year-over-year growth 2025-2030 (%)

12.3.3 South Korea - Market size and forecast 2025-2030

Chart on South Korea - Market size and forecast 2025-2030 ($ million)
Data Table on South Korea - Market size and forecast 2025-2030 ($ million)
Chart on South Korea - Year-over-year growth 2025-2030 (%)
Data Table on South Korea - Year-over-year growth 2025-2030 (%)

12.3.4 India - Market size and forecast 2025-2030

Chart on India - Market size and forecast 2025-2030 ($ million)
Data Table on India - Market size and forecast 2025-2030 ($ million)
Chart on India - Year-over-year growth 2025-2030 (%)
Data Table on India - Year-over-year growth 2025-2030 (%)

12.3.5 Australia - Market size and forecast 2025-2030

Chart on Australia - Market size and forecast 2025-2030 ($ million)
Data Table on Australia - Market size and forecast 2025-2030 ($ million)
Chart on Australia - Year-over-year growth 2025-2030 (%)
Data Table on Australia - Year-over-year growth 2025-2030 (%)

12.3.6 Indonesia - Market size and forecast 2025-2030

Chart on Indonesia - Market size and forecast 2025-2030 ($ million)
Data Table on Indonesia - Market size and forecast 2025-2030 ($ million)
Chart on Indonesia - Year-over-year growth 2025-2030 (%)
Data Table on Indonesia - Year-over-year growth 2025-2030 (%)

12.4 North America - Market size and forecast 2025-2030

Chart on North America - Market size and forecast 2025-2030 ($ million)
Data Table on North America - Market size and forecast 2025-2030 ($ million)
Chart on North America - Year-over-year growth 2025-2030 (%)
Data Table on North America - Year-over-year growth 2025-2030 (%)
Chart on Regional Comparison - North America
Data Table on Regional Comparison - North America

12.4.1 US - Market size and forecast 2025-2030

Chart on US - Market size and forecast 2025-2030 ($ million)
Data Table on US - Market size and forecast 2025-2030 ($ million)
Chart on US - Year-over-year growth 2025-2030 (%)
Data Table on US - Year-over-year growth 2025-2030 (%)

12.4.2 Canada - Market size and forecast 2025-2030

Chart on Canada - Market size and forecast 2025-2030 ($ million)
Data Table on Canada - Market size and forecast 2025-2030 ($ million)
Chart on Canada - Year-over-year growth 2025-2030 (%)
Data Table on Canada - Year-over-year growth 2025-2030 (%)

12.4.3 Mexico - Market size and forecast 2025-2030

Chart on Mexico - Market size and forecast 2025-2030 ($ million)
Data Table on Mexico - Market size and forecast 2025-2030 ($ million)
Chart on Mexico - Year-over-year growth 2025-2030 (%)
Data Table on Mexico - Year-over-year growth 2025-2030 (%)

12.5 Europe - Market size and forecast 2025-2030

Chart on Europe - Market size and forecast 2025-2030 ($ million)
Data Table on Europe - Market size and forecast 2025-2030 ($ million)
Chart on Europe - Year-over-year growth 2025-2030 (%)
Data Table on Europe - Year-over-year growth 2025-2030 (%)
Chart on Regional Comparison - Europe
Data Table on Regional Comparison - Europe

12.5.1 Germany - Market size and forecast 2025-2030

Chart on Germany - Market size and forecast 2025-2030 ($ million)
Data Table on Germany - Market size and forecast 2025-2030 ($ million)
Chart on Germany - Year-over-year growth 2025-2030 (%)
Data Table on Germany - Year-over-year growth 2025-2030 (%)

12.5.2 UK - Market size and forecast 2025-2030

Chart on UK - Market size and forecast 2025-2030 ($ million)
Data Table on UK - Market size and forecast 2025-2030 ($ million)
Chart on UK - Year-over-year growth 2025-2030 (%)
Data Table on UK - Year-over-year growth 2025-2030 (%)

12.5.3 France - Market size and forecast 2025-2030

Chart on France - Market size and forecast 2025-2030 ($ million)
Data Table on France - Market size and forecast 2025-2030 ($ million)
Chart on France - Year-over-year growth 2025-2030 (%)
Data Table on France - Year-over-year growth 2025-2030 (%)

12.5.4 Italy - Market size and forecast 2025-2030

Chart on Italy - Market size and forecast 2025-2030 ($ million)
Data Table on Italy - Market size and forecast 2025-2030 ($ million)
Chart on Italy - Year-over-year growth 2025-2030 (%)
Data Table on Italy - Year-over-year growth 2025-2030 (%)

12.5.5 Spain - Market size and forecast 2025-2030

Chart on Spain - Market size and forecast 2025-2030 ($ million)
Data Table on Spain - Market size and forecast 2025-2030 ($ million)
Chart on Spain - Year-over-year growth 2025-2030 (%)
Data Table on Spain - Year-over-year growth 2025-2030 (%)

12.5.6 The Netherlands - Market size and forecast 2025-2030

Chart on The Netherlands - Market size and forecast 2025-2030 ($ million)
Data Table on The Netherlands - Market size and forecast 2025-2030 ($ million)
Chart on The Netherlands - Year-over-year growth 2025-2030 (%)
Data Table on The Netherlands - Year-over-year growth 2025-2030 (%)

12.6 South America - Market size and forecast 2025-2030

Chart on South America - Market size and forecast 2025-2030 ($ million)
Data Table on South America - Market size and forecast 2025-2030 ($ million)
Chart on South America - Year-over-year growth 2025-2030 (%)
Data Table on South America - Year-over-year growth 2025-2030 (%)
Chart on Regional Comparison - South America
Data Table on Regional Comparison - South America

12.6.1 Brazil - Market size and forecast 2025-2030

Chart on Brazil - Market size and forecast 2025-2030 ($ million)
Data Table on Brazil - Market size and forecast 2025-2030 ($ million)
Chart on Brazil - Year-over-year growth 2025-2030 (%)
Data Table on Brazil - Year-over-year growth 2025-2030 (%)

12.6.2 Argentina - Market size and forecast 2025-2030

Chart on Argentina - Market size and forecast 2025-2030 ($ million)
Data Table on Argentina - Market size and forecast 2025-2030 ($ million)
Chart on Argentina - Year-over-year growth 2025-2030 (%)
Data Table on Argentina - Year-over-year growth 2025-2030 (%)

12.6.3 Colombia - Market size and forecast 2025-2030

Chart on Colombia - Market size and forecast 2025-2030 ($ million)
Data Table on Colombia - Market size and forecast 2025-2030 ($ million)
Chart on Colombia - Year-over-year growth 2025-2030 (%)
Data Table on Colombia - Year-over-year growth 2025-2030 (%)

12.7 Middle East and Africa - Market size and forecast 2025-2030

Chart on Middle East and Africa - Market size and forecast 2025-2030 ($ million)
Data Table on Middle East and Africa - Market size and forecast 2025-2030 ($ million)
Chart on Middle East and Africa - Year-over-year growth 2025-2030 (%)
Data Table on Middle East and Africa - Year-over-year growth 2025-2030 (%)
Chart on Regional Comparison - Middle East and Africa
Data Table on Regional Comparison - Middle East and Africa

12.7.1 UAE - Market size and forecast 2025-2030

Chart on UAE - Market size and forecast 2025-2030 ($ million)
Data Table on UAE - Market size and forecast 2025-2030 ($ million)
Chart on UAE - Year-over-year growth 2025-2030 (%)
Data Table on UAE - Year-over-year growth 2025-2030 (%)

12.7.2 Saudi Arabia - Market size and forecast 2025-2030

Chart on Saudi Arabia - Market size and forecast 2025-2030 ($ million)
Data Table on Saudi Arabia - Market size and forecast 2025-2030 ($ million)
Chart on Saudi Arabia - Year-over-year growth 2025-2030 (%)
Data Table on Saudi Arabia - Year-over-year growth 2025-2030 (%)

12.7.3 South Africa - Market size and forecast 2025-2030

Chart on South Africa - Market size and forecast 2025-2030 ($ million)
Data Table on South Africa - Market size and forecast 2025-2030 ($ million)
Chart on South Africa - Year-over-year growth 2025-2030 (%)
Data Table on South Africa - Year-over-year growth 2025-2030 (%)

12.7.4 Israel - Market size and forecast 2025-2030

Chart on Israel - Market size and forecast 2025-2030 ($ million)
Data Table on Israel - Market size and forecast 2025-2030 ($ million)
Chart on Israel - Year-over-year growth 2025-2030 (%)
Data Table on Israel - Year-over-year growth 2025-2030 (%)

12.7.5 Turkey - Market size and forecast 2025-2030

Chart on Turkey - Market size and forecast 2025-2030 ($ million)
Data Table on Turkey - Market size and forecast 2025-2030 ($ million)
Chart on Turkey - Year-over-year growth 2025-2030 (%)
Data Table on Turkey - Year-over-year growth 2025-2030 (%)

12.8 Market opportunity by geography

Market opportunity by geography ($ million)
Data Tables on Market opportunity by geography ($ million)

13. Drivers, Challenges, and Opportunity

13.1 Market drivers

Escalating demand for enhanced customer experience and personalization
Proliferation of emotion AI in automotive sector for advanced safety and in-cabin systems
Expanding applications in healthcare and mental wellness monitoring

13.2 Market challenges

Addressing data privacy concerns inherent to technology
Deficiencies in algorithmic accuracy and contextual generalizability
Navigating regulatory fragmentation and void of industry standards

13.3 Impact of drivers and challenges

Impact of drivers and challenges in 2025 and 2030

13.4 Market opportunities

Emergence of multimodal emotion AI
Increasing focus on explainable and ethical AI
Shift toward on-device and edge processing

14. Competitive Landscape

14.1 Overview

14.2

Overview on criticality of inputs and factors of differentiation

14.3 Landscape disruption

Overview on factors of disruption

14.4 Industry risks

Impact of key risks on business

15. Competitive Analysis

15.1 Companies profiled

Companies covered

15.2 Company ranking index

15.3 Market positioning of companies

Matrix on companies position and classification

15.4 Amazon Web Services Inc.

Amazon Web Services Inc. - Overview
Amazon Web Services Inc. - Product / Service
Amazon Web Services Inc. - Key offerings
SWOT

15.5 audEERING GmbH

audEERING GmbH - Overview
audEERING GmbH - Product / Service
audEERING GmbH - Key offerings
SWOT

15.6 Behavioral Signal

Behavioral Signal - Overview
Behavioral Signal - Product / Service
Behavioral Signal - Key offerings
SWOT

15.7 Entropik Technologies Pvt. Ltd

Entropik Technologies Pvt. Ltd - Overview
Entropik Technologies Pvt. Ltd - Product / Service
Entropik Technologies Pvt. Ltd - Key offerings
SWOT

15.8 Google LLC

Google LLC - Overview
Google LLC - Product / Service
Google LLC - Key offerings
SWOT

15.9 IBM Corp.

IBM Corp. - Overview
IBM Corp. - Business segments
IBM Corp. - Key news
IBM Corp. - Key offerings
IBM Corp. - Segment focus
SWOT

15.10 Microsoft Corp.

Microsoft Corp. - Overview
Microsoft Corp. - Business segments
Microsoft Corp. - Key news
Microsoft Corp. - Key offerings
Microsoft Corp. - Segment focus
SWOT

15.11 Morphcast Inc.

Morphcast Inc. - Overview
Morphcast Inc. - Product / Service
Morphcast Inc. - Key offerings
SWOT

15.12 Noldus Information Technology

Noldus Information Technology - Overview
Noldus Information Technology - Product / Service
Noldus Information Technology - Key offerings
SWOT

15.13 Opsis Pte. Ltd.

Opsis Pte. Ltd. - Overview
Opsis Pte. Ltd. - Product / Service
Opsis Pte. Ltd. - Key offerings
SWOT

15.14 Realeyes

Realeyes - Overview
Realeyes - Product / Service
Realeyes - Key offerings
SWOT

15.15 Superceed

Superceed - Overview
Superceed - Product / Service
Superceed - Key offerings
SWOT

15.16 Symanto

Symanto - Overview
Symanto - Product / Service
Symanto - Key offerings
SWOT

15.17 Uniphore Technologies Inc.

Uniphore Technologies Inc. - Overview
Uniphore Technologies Inc. - Product / Service
Uniphore Technologies Inc. - Key offerings
SWOT

15.18 VIER GmbH.

VIER GmbH. - Overview
VIER GmbH. - Product / Service
VIER GmbH. - Key offerings
SWOT

16. Appendix

16.1 Scope of the report

Market definition
Objectives
Notes and caveats

16.2 Inclusions and exclusions checklist

Inclusions checklist
Exclusions checklist

16.3 Currency conversion rates for US$

16.4 Research methodology

16.5 Data procurement

Information sources

16.6 Data validation

16.7 Validation techniques employed for market sizing

16.8 Data synthesis

16.9 360 degree market analysis

16.10 List of abbreviations

Research Methodology

Technavio presents a detailed picture of the market by way of study, synthesis, and summation of data from multiple sources. The analysts have presented the various facets of the market with a particular focus on identifying the key industry influencers. The data thus presented is comprehensive, reliable, and the result of extensive research, both primary and secondary.

INFORMATION SOURCES

Primary sources

  • Manufacturers and suppliers
  • Channel partners
  • Industry experts
  • Strategic decision makers

Secondary sources

  • Industry journals and periodicals
  • Government data
  • Financial reports of key industry players
  • Historical data
  • Press releases

DATA ANALYSIS

Data Synthesis

  • Collation of data
  • Estimation of key figures
  • Analysis of derived insights

Data Validation

  • Triangulation with data models
  • Reference against proprietary databases
  • Corroboration with industry experts

REPORT WRITING

Qualitative

  • Market drivers
  • Market challenges
  • Market trends
  • Five forces analysis

Quantitative

  • Market size and forecast
  • Market segmentation
  • Geographical insights
  • Competitive landscape

Interested in this report?

Get your sample now to see our research methodology and insights!

Download Now

Frequently Asked Questions

Emotion AI market growth will increase by USD 17378.2 million during 2026-2030.

The Emotion AI market is expected to grow at a CAGR of 27.8% during 2026-2030.

Emotion AI market is segmented by Type (Video, Voice-focused, Multimodal, Text-focused) Technology (Machine learning, Natural language processing, Others) Component (Software, Services)

Amazon Web Services Inc., audEERING GmbH, Behavioral Signal, Cipia Vision Ltd., Cogito Corp, Entropik Technologies Pvt. Ltd, Google LLC, Hume AI Inc., IBM Corp., Microsoft Corp., Morphcast Inc., Noldus Information Technology, Opsis Pte. Ltd., Realeyes, Siena, Superceed, Symanto, Uniphore Technologies Inc., VIER GmbH., Voicesense are a few of the key vendors in the Emotion AI market.

APAC will register the highest growth rate of 39% among the other regions. Therefore, the Emotion AI market in APAC is expected to garner significant business opportunities for the vendors during the forecast period.

China, Japan, South Korea, India, Australia, Indonesia, US, Canada, Mexico, Germany, UK, France, Italy, Spain, The Netherlands, Brazil, Argentina, Colombia, UAE, Saudi Arabia, South Africa, Israel, Turkey

  • Escalating demand for enhanced customer experience and personalization is the driving factor this market.

The Emotion AI market vendors should focus on grabbing business opportunities from the Type segment as it accounted for the largest market share in the base year.
RIA - Research AI Assistant
Ask RIA