Digital Substation Market Analysis APAC, North America, Europe, South America, Middle East and Africa - China, US, UK, Japan, Germany - Size and Forecast 2024-2028

Digital Substation Market Analysis APAC, North America, Europe, South America, Middle East and Africa - China, US, UK, Japan, Germany - Size and Forecast 2024-2028

Published: Jul 2024 167 Pages SKU: IRTNTR75010

Market Overview at a Glance

$3.23 B
Market Opportunity
7.22%
CAGR
6.82
YoY growth 2023-2024(%)

Digital Substation Market Size 2024-2028

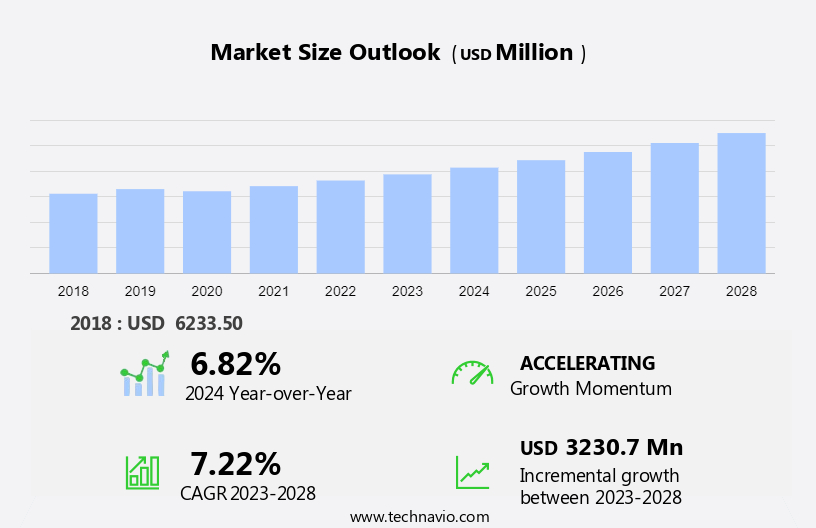
The digital substation market size is forecast to increase by USD 3.23 billion at a CAGR of 7.22% between 2023 and 2028.

  • The market is experiencing significant growth due to the increasing demand for advanced power monitoring and control software in various industries, including coal-fired power generation and renewable energy. The integration of analytics and industrial automation in digital substations is enabling predictive maintenance and improving overall efficiency. Additionally, the adoption of battery energy storage systems and digital transformation are driving the market forward. Industrial automation solutions are becoming more digital, with SCADA systems and smart energy displays moving towards server-based architecture and Industry 4.0 technologies. However, concerns over cyber threats and insulation requirements remain challenges for market growth. Keywords: power monitoring and control software, coal-fired power generation, analytics, industrial automation, battery, digital transformation, automation solutions, coal, smart energy, digital, display, software, renewable energy, predictive analytics, automation, insulation, digital substation, advanced energy, industry 4.0.
  • The market is witnessing a shift towards compact automation solutions and expanding capabilities of micro PLCs to meet the demands of the power grid. Cybersecurity threats and insulation requirements remain challenges, but the benefits of increased efficiency and predictive maintenance are driving market growth.
  • What will be the Size of the Digital Substation Market During the Forecast Period?

    Digital Substation Market Size

     Request Free Sample

  • The market encompasses the integration of advanced technologies, such as SCADA systems, fiber-optic communication networks, and secure technologies, into electrical transmission and distribution systems. This digitization trend is transforming the electrical utility industry landscape by enhancing the adaptability and reliability of voltage segments in transmission and distribution systems. The market's growth is driven by industrial development and the increasing need for secure, real-time monitoring and control of electrical networks. Technological platforms, including digital protection relays, smart transformers, and automation systems, are facilitating the adoption of digital substations. As the industry continues to evolve, fiber-optic communication networks are expected to play a pivotal role in enabling seamless data exchange between various components of the electrical grid.
  • Overall, the market is experiencing significant growth, offering numerous opportunities for innovation and improvement in electrical generation, transmission, and distribution systems.
  • How is this Digital Substation Industry segmented and which is the largest segment?

    The digital substation industry research report provides comprehensive data (region-wise segment analysis), with forecasts and estimates in "USD million" for the period 2024-2028, as well as historical data from 2018-2022 for the following segments.
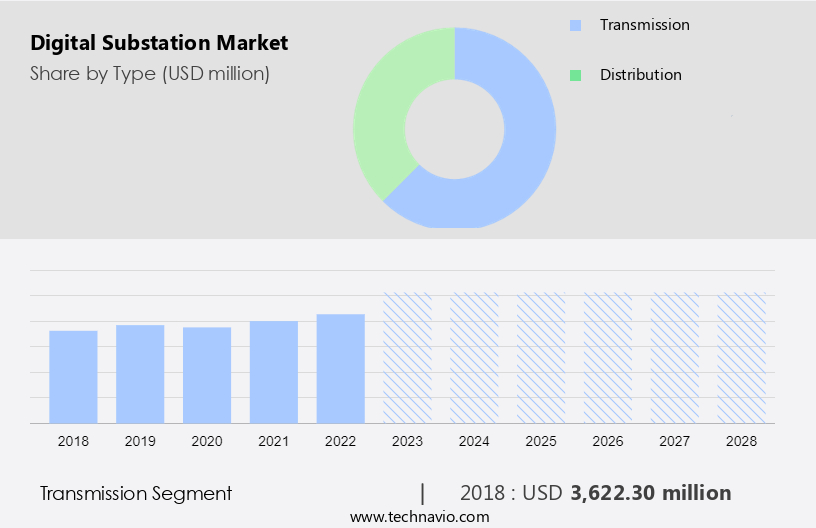
    • Type
      • Transmission
      • Distribution
    • Component
      • Hardware
      • Fiber-optic communication networks
      • SCADA systems
    • Geography
      • APAC
        • China
        • Japan
      • North America
        • US
      • Europe
        • Germany
        • UK
      • South America
        • Middle East and Africa

        By Type Insights

        The transmission segment is estimated to witness significant growth during the forecast period. In the power industry, digital substations play a crucial role in automating power system operations through advanced devices such as Programmable Logic Controllers (PLCs). These substations are increasingly being adopted in transformer substations to enhance transmission system monitoring and detect anomalies. The power transmission sector is witnessing a significant push towards reducing transmission and distribution (T&D) losses, leading to increased demand for digital substations. These systems improve signal connectivity, server management, and data acquisition, thereby enhancing overall efficiency. The decline in nuclear and coal-fired power generation is being offset by the surge in renewable energy investments. Digital substations are essential for integrating renewable energy sources into the grid infrastructure and ensuring affordable and uninterrupted electricity supply.

        The power industry landscape is undergoing rapid digitalization, driven by technological advancements, regulatory reforms, and industry strategies. Major economies are investing heavily in capital expenditure projects to modernize distribution networks, install smart meters, and build smart grids. The ongoing projects aim to improve service quality, resilience, and future energy distribution through technological solutions like battery technology and industrial development. The industry's focus on automation, communication technology, feedback capabilities, and timely failure corrections is shaping the future of power distribution. Cybersecurity concerns and restrictions on movement due to social distancing measures are influencing the adoption of secure and adaptable technologies. Regulatory mandates, smart grid components, and power distribution reforms are further catalyzing the growth of the market.

        Digital Substation Market Size

        Get a glance at the market report of various segments Request Free Sample

        The Transmission segment was valued at USD 3.62 billion in 2018 and showed a gradual increase during the forecast period.

        Regional Analysis

        APAC is estimated to contribute 34% to the growth of the global market during the forecast period. Technavio’s analysts have elaborately explained the regional trends and drivers that shape the market during the forecast period.

        Digital Substation Market Share by Geography

        For more insights on the market size of various regions, Request Free Sample

        The market in Asia Pacific (APAC) is poised for substantial expansion over the forecast period. Key contributors to this growth include China, Japan, India, Vietnam, South Korea, Malaysia, and Australia. These countries' robust industrial sectors, increasing demand for medium-voltage and low-voltage motors, and substantial investments in power, water and wastewater treatment, food and beverage, and automotive industries are major factors driving the market. Additionally, government initiatives for digitalization, rising standards of living, and a strong industrial base are fueling the adoption of digital substations In the automotive industry in APAC. The region's growing demand for affordable and uninterrupted electricity, coupled with power distribution reforms and industrial strategies, is further boosting market growth.

        Technological advancements in communication technology, feedback capabilities, timely failure corrections, fault detection, and smart grid components are also contributing to the market's expansion. Despite budget constraints and ongoing projects, continuous investments in distribution networks, smart meters, smart grids, and aging infrastructure are essential for ensuring high-quality services and improving energy efficiency in developing economies. Key players In the market include Efacec, ABB, and others, who are focusing on providing efficient products and services, improving platforms, and complying with regulatory mandates to meet the evolving needs of utilities and technology providers. The market landscape is characterized by continuous investments, seamless integration, and revenue generation opportunities in major economies, making it an attractive area for investments.

        The adoption of energy-efficient technologies, such as battery technology and industrial development, is also driving the market's growth.

        Market Dynamics

        Our researchers analyzed the data with 2023 as the base year, along with the key drivers, trends, and challenges. A holistic analysis of drivers will help companies refine their marketing strategies to gain a competitive advantage.

        What are the key market drivers leading to the rise In the adoption of Digital Substation Industry?

        • Increasing demand for compact automation solutions is the key driver of the market.The market is witnessing significant growth due to the increasing adoption of SCADA systems in electrical generation, transmission, and distribution systems by electric utilities. The market is driven by technological advancements in voltage segments, the renewable energy sector, and cybersecurity. Sulfur hexafluoride (SF6) and secure technologies are key areas of focus for industry players. Adaptable technologies, regulatory reforms, and investments in grid infrastructure are shaping the industry landscape. R&D spendings and technological platforms are facilitating product adoption, while regulatory mandates and power distribution reforms are influencing industrial strategies. The market is also witnessing continuous investments in distribution networks, smart meters, and smart grids to ensure affordable electricity and uninterrupted power supply.

          Despite budget constraints and economic impact, capital expenditure projects are prioritized for efficient products and seamless integration of smart grid components. The market is expected to grow rapidly, with major economies investing in energy-efficient technologies and improving service quality. Efacec's prototype Transformer Station and ABB's Fiber optic cable are notable technological solutions In the market. The market is also witnessing ongoing projects and regulatory bodies' initiatives to promote digitization and smart energy infrastructure. Battery technology and industrial development are key areas of focus for future energy distribution.

        What are the market trends shaping the Digital Substation market?

        • Increasing focus on expanding capabilities of micro PLCs is the upcoming market trend.Micro PLCs have gained significant traction in industrial automation due to their compact size, cost-effectiveness, and advanced features. Initially designed for controlling small machinery with basic serial communication, these devices now offer high-speed communication capabilities, large program memory, and support for multiple communication protocols. This expansion in functionality enables micro PLCs to manage larger machines and complex systems, making them a versatile solution for various industries. The electrical generation, transmission, and distribution systems sectors, including electric utilities, have embraced micro PLCs for SCADA systems and voltage segment control due to their adaptability and secure technologies. The renewable energy sector's growth has further fueled the demand for micro PLCs, as they facilitate the integration of renewable energy sources into the grid infrastructure.

          Cybersecurity concerns have led to the adoption of advanced technologies in micro PLCs, ensuring secure and reliable electrical transactions between supply and demand at load centers. The industry landscape is witnessing continuous investments in R&D spendings and technological platforms to improve product adoption and meet regulatory reforms. The future of micro PLCs lies In their ability to seamlessly integrate with smart energy infrastructure, including smart grids and distribution networks, to provide affordable and uninterrupted electricity. This strategic approach to digitalization and technological advancements is crucial for addressing the challenges of aging infrastructure, improving service quality, and catering to the needs of developing economies.

          Despite budget constraints and ongoing projects, investment decisions in capital expenditure projects remain a priority for industrial growth and revenue generation in major economies. The future of micro PLCs is bright, as they offer energy-efficient technologies, continuous improvements, and the ability to adapt to changing market dynamics and regulatory mandates.

        What challenges does the Digital Substation Industry face during its growth?

        • Concerns over cyber threats is a key challenge affecting the industry growth.The market is experiencing significant growth due to the increasing demand for secure and adaptable technologies in electrical generation, transmission, and distribution systems used by electric utilities. SCADA systems are a crucial component of digital substations, enabling voltage segment management, communication between grid infrastructure, and real-time fault detection and correction. The renewable energy sector's expansion is also driving market growth, as digital substations are essential for integrating renewable energy sources into the grid infrastructure. However, cybersecurity concerns are a major challenge for the market. With the rise of connected devices and web-based communication, networks are becoming increasingly vulnerable to cyberattacks.

          Hackers are constantly evolving their tactics, using ransomware and distributed denial of service (DDoS) attacks to gain unauthorized access to critical information. Despite efforts to improve the security of power monitoring and control software, the evolving nature of cyber threats poses a risk to the market. R&D spendings and technological platforms are key areas of focus for industry players, with a strategic approach to product adoption and regulatory reforms playing a significant role in shaping the industry landscape. The implementation of smart energy infrastructure, including smart meters and smart grids, is also driving growth In the market. However, aging infrastructure, budget constraints, and restrictions on movement due to social distancing measures may impact investment decisions and capital expenditure projects.

          In conclusion, the market is witnessing rapid digitalization and technological advancements, driven by the need for efficient products and services, uninterrupted electricity, and affordable electricity in major economies. Regulatory mandates and smart grid components are also playing a crucial role in market growth. Despite the challenges posed by cybersecurity threats, the market is expected to continue growing, driven by the ongoing development of industrial strategies and the integration of energy-efficient technologies.

        Exclusive Customer Landscape

        The digital substation market forecasting report includes the adoption lifecycle of the market, covering from the innovator’s stage to the laggard’s stage. It focuses on adoption rates in different regions based on penetration. Furthermore, the digital substation market report also includes key purchase criteria and drivers of price sensitivity to help companies evaluate and develop their market growth analysis strategies.
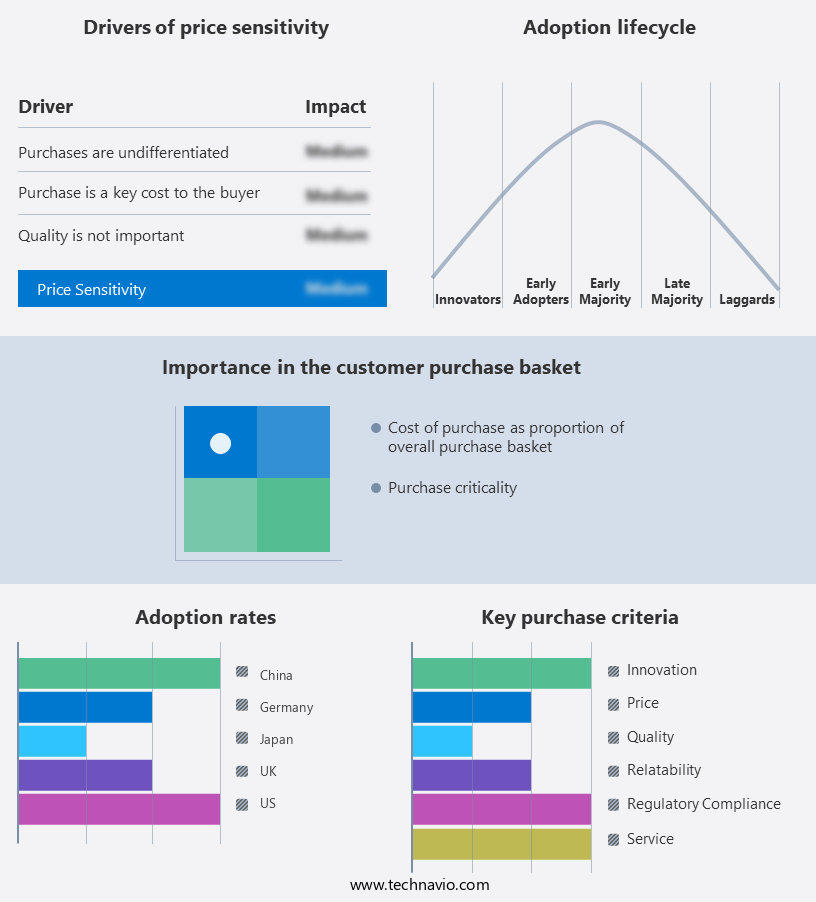
        Digital Substation Market Share by Geography

         Customer Landscape

        Key Companies & Market Insights

        Companies are implementing various strategies, such as strategic alliances, digital substation market forecast, partnerships, mergers and acquisitions, geographical expansion, and product/service launches, to enhance their presence In the industry.

        ABB - The market encompasses advanced technologies such as Smart Substation Control and Protection (SSC) systems. These solutions enhance electrical grid efficiency and reliability through real-time monitoring, automated fault detection, and improved communication between grid components. The SSC600, an example of digital substation technology, offers enhanced functionality and performance, contributing to the overall growth and modernization of the power transmission and distribution sector.

        The industry research and growth report includes detailed analyses of the competitive landscape of the market and information about key companies, including:

        • ABB
        • Cadillac Automation and Controls
        • Cisco Systems Inc.
        • Eaton Corp. Plc
        • Efacec
        • Emerson Electric Co.
        • General Electric Co.
        • Honeywell International Inc.
        • iGrid T and D
        • Larsen and Toubro Ltd.
        • Locamation
        • Netcontrol Group
        • NovaTech LLC
        • NR Electric Co. Ltd.
        • Open Systems International Inc.
        • Schneider Electric SE
        • Siemens AG
        • Tekvel
        • Tesco Automation Inc.
        • Texas Instruments Inc.

        Qualitative and quantitative analysis of companies has been conducted to help clients understand the wider business environment as well as the strengths and weaknesses of key industry players. Data is qualitatively analyzed to categorize companies as pure play, category-focused, industry-focused, and diversified; it is quantitatively analyzed to categorize companies as dominant, leading, strong, tentative, and weak.

        Research Analyst Overview

        The market is experiencing significant growth as electrical generation and transmission systems evolve to meet the demands of modern electricity grids. The integration of communication technology and feedback capabilities in substation units has led to the development of SCADA systems, which enable utilities to monitor and control their electrical distribution networks in real-time. The renewable energy sector is a major driver of this digitalization trend, as the adoption of renewable energy sources requires more adaptable and secure technological platforms to ensure the reliable integration of these intermittent resources into the grid. Cybersecurity is a critical concern in this context, as the increasing digitization of electrical infrastructure makes it more vulnerable to cyberattacks.

        R&D spendings In the industry landscape have been focused on developing efficient products and improving the resilience of substation units. Technological advancements in areas such as battery technology and automation have enabled the creation of smart energy infrastructure, which offers numerous benefits, including seamless integration of renewable energy sources, improved service quality, and revenue generation opportunities. Regulatory reforms and policies have played a significant role in driving the digitalization of electrical infrastructure. For instance, major economies have implemented power distribution reforms to encourage the adoption of smart grids and smart meters. These reforms have been instrumental in enabling utilities to provide affordable electricity and uninterrupted power supply to their customers.

        The industrial sector has also been investing heavily in capital expenditure projects to digitize their electrical infrastructure. Continuous investments in distribution networks, transmission systems, and transformers have led to the deployment of advanced technologies such as fiber optic cables and secure communication systems. Despite the numerous benefits of digital substations, there are challenges that must be addressed. Restrictions on movement and social distancing measures have disrupted ongoing projects, leading to delays and increased costs. Economic impact and budget constraints have also influenced investment decisions, with utilities prioritizing projects based on their potential return on investment. The aging infrastructure in developing economies presents another challenge, as many substations require upgrades to meet modern standards.

        Utilities In these regions are adopting a strategic approach to digitization, focusing on the implementation of affordable and efficient technological solutions. In conclusion, the market is experiencing rapid digitalization, driven by technological advancements, regulatory mandates, and the need for more resilient and adaptable electrical infrastructure. Utilities are investing in smart grid components, communication technology, and cybersecurity solutions to ensure the reliable and efficient distribution of electricity. Despite challenges such as economic constraints and aging infrastructure, the future of electrical infrastructure is digital, with a focus on providing high-quality services and integrating renewable energy sources into the grid.

        Market Scope

        Report Coverage

        Details

        Page number

        167

        Base year

        2023

        Historic period

        2018-2022

        Forecast period

        2024-2028

        Growth momentum & CAGR

        Accelerate at a CAGR of 7.22%

        Market growth 2024-2028

        USD 3230.7 million

        Market structure

        Fragmented

        YoY growth 2023-2024(%)

        6.82

        Key countries

        China, US, UK, Japan, and Germany

        Competitive landscape

        Leading Companies, Market Positioning of Companies, Competitive Strategies, and Industry Risks

        Request Free Sample

        What are the Key Data Covered in this Digital Substation Market Research and Growth Report?

        • CAGR of the Digital Substation industry during the forecast period
        • Detailed information on factors that will drive the growth and forecasting between 2024 and 2028
        • Precise estimation of the size of the market and its contribution of the industry in focus to the parent market
        • Accurate predictions about upcoming growth and trends and changes in consumer behaviour
        • Growth of the market across APAC, North America, Europe, South America, and Middle East and Africa
        • Thorough analysis of the market’s competitive landscape and detailed information about companies
        • Comprehensive analysis of factors that will challenge the digital substation market growth of industry companies

        We can help! Our analysts can customize this digital substation market research report to meet your requirements.

        Get in touch


        1 Executive Summary

        • 1.1 Market overview
          • Executive Summary - Chart on Market Overview
          • Executive Summary - Data Table on Market Overview
          • Executive Summary - Chart on Global Market Characteristics
          • Executive Summary - Chart on Market by Geography
          • Executive Summary - Chart on Market Segmentation by Type
          • Executive Summary - Chart on Market Segmentation by Component
          • Executive Summary - Chart on Incremental Growth
          • Executive Summary - Data Table on Incremental Growth
          • Executive Summary - Chart on Company Market Positioning

        2 Market Landscape

        • 2.1 Market ecosystem
          • Parent Market
          • Data Table on - Parent Market
        • 2.2 Market characteristics
          • Market characteristics analysis
        • 2.3 Value chain analysis
          • Value Chain Analysis

        3 Market Sizing

        • 3.1 Market definition
          • Offerings of companies included in the market definition
        • 3.2 Market segment analysis
          • Market segments
        • 3.3 Market size 2023
          • 3.4 Market outlook: Forecast for 2023-2028
            • Chart on Global - Market size and forecast 2023-2028 ($ million)
            • Data Table on Global - Market size and forecast 2023-2028 ($ million)
            • Chart on Global Market: Year-over-year growth 2023-2028 (%)
            • Data Table on Global Market: Year-over-year growth 2023-2028 (%)

          4 Historic Market Size

          • 4.1 Global Digital Substation Market 2018 - 2022
            • Historic Market Size - Data Table on Global Digital Substation Market 2018 - 2022 ($ million)
          • 4.2 Type segment analysis 2018 - 2022
            • Historic Market Size - Type Segment 2018 - 2022 ($ million)
          • 4.3 Component segment analysis 2018 - 2022
            • Historic Market Size - Component Segment 2018 - 2022 ($ million)
          • 4.4 Geography segment analysis 2018 - 2022
            • Historic Market Size - Geography Segment 2018 - 2022 ($ million)
          • 4.5 Country segment analysis 2018 - 2022
            • Historic Market Size - Country Segment 2018 - 2022 ($ million)

          5 Five Forces Analysis

          • 5.1 Five forces summary
            • Five forces analysis - Comparison between 2023 and 2028
          • 5.2 Bargaining power of buyers
            • Bargaining power of buyers - Impact of key factors 2023 and 2028
          • 5.3 Bargaining power of suppliers
            • Bargaining power of suppliers - Impact of key factors in 2023 and 2028
          • 5.4 Threat of new entrants
            • Threat of new entrants - Impact of key factors in 2023 and 2028
          • 5.5 Threat of substitutes
            • Threat of substitutes - Impact of key factors in 2023 and 2028
          • 5.6 Threat of rivalry
            • Threat of rivalry - Impact of key factors in 2023 and 2028
          • 5.7 Market condition
            • Chart on Market condition - Five forces 2023 and 2028

          6 Market Segmentation by Type

          • 6.1 Market segments
            • Chart on Type - Market share 2023-2028 (%)
            • Data Table on Type - Market share 2023-2028 (%)
          • 6.2 Comparison by Type
            • Chart on Comparison by Type
            • Data Table on Comparison by Type
          • 6.3 Transmission - Market size and forecast 2023-2028
            • Chart on Transmission - Market size and forecast 2023-2028 ($ million)
            • Data Table on Transmission - Market size and forecast 2023-2028 ($ million)
            • Chart on Transmission - Year-over-year growth 2023-2028 (%)
            • Data Table on Transmission - Year-over-year growth 2023-2028 (%)
          • 6.4 Distribution - Market size and forecast 2023-2028
            • Chart on Distribution - Market size and forecast 2023-2028 ($ million)
            • Data Table on Distribution - Market size and forecast 2023-2028 ($ million)
            • Chart on Distribution - Year-over-year growth 2023-2028 (%)
            • Data Table on Distribution - Year-over-year growth 2023-2028 (%)
          • 6.5 Market opportunity by Type
            • Market opportunity by Type ($ million)
            • Data Table on Market opportunity by Type ($ million)

          7 Market Segmentation by Component

          • 7.1 Market segments
            • Chart on Component - Market share 2023-2028 (%)
            • Data Table on Component - Market share 2023-2028 (%)
          • 7.2 Comparison by Component
            • Chart on Comparison by Component
            • Data Table on Comparison by Component
          • 7.3 Hardware - Market size and forecast 2023-2028
            • Chart on Hardware - Market size and forecast 2023-2028 ($ million)
            • Data Table on Hardware - Market size and forecast 2023-2028 ($ million)
            • Chart on Hardware - Year-over-year growth 2023-2028 (%)
            • Data Table on Hardware - Year-over-year growth 2023-2028 (%)
          • 7.4 Fiber-optic communication networks - Market size and forecast 2023-2028
            • Chart on Fiber-optic communication networks - Market size and forecast 2023-2028 ($ million)
            • Data Table on Fiber-optic communication networks - Market size and forecast 2023-2028 ($ million)
            • Chart on Fiber-optic communication networks - Year-over-year growth 2023-2028 (%)
            • Data Table on Fiber-optic communication networks - Year-over-year growth 2023-2028 (%)
          • 7.5 SCADA systems - Market size and forecast 2023-2028
            • Chart on SCADA systems - Market size and forecast 2023-2028 ($ million)
            • Data Table on SCADA systems - Market size and forecast 2023-2028 ($ million)
            • Chart on SCADA systems - Year-over-year growth 2023-2028 (%)
            • Data Table on SCADA systems - Year-over-year growth 2023-2028 (%)
          • 7.6 Market opportunity by Component
            • Market opportunity by Component ($ million)
            • Data Table on Market opportunity by Component ($ million)

          8 Customer Landscape

          • 8.1 Customer landscape overview
            • Analysis of price sensitivity, lifecycle, customer purchase basket, adoption rates, and purchase criteria

          9 Geographic Landscape

          • 9.1 Geographic segmentation
            • Chart on Market share by geography 2023-2028 (%)
            • Data Table on Market share by geography 2023-2028 (%)
          • 9.2 Geographic comparison
            • Chart on Geographic comparison
            • Data Table on Geographic comparison
          • 9.3 APAC - Market size and forecast 2023-2028
            • Chart on APAC - Market size and forecast 2023-2028 ($ million)
            • Data Table on APAC - Market size and forecast 2023-2028 ($ million)
            • Chart on APAC - Year-over-year growth 2023-2028 (%)
            • Data Table on APAC - Year-over-year growth 2023-2028 (%)
          • 9.4 North America - Market size and forecast 2023-2028
            • Chart on North America - Market size and forecast 2023-2028 ($ million)
            • Data Table on North America - Market size and forecast 2023-2028 ($ million)
            • Chart on North America - Year-over-year growth 2023-2028 (%)
            • Data Table on North America - Year-over-year growth 2023-2028 (%)
          • 9.5 Europe - Market size and forecast 2023-2028
            • Chart on Europe - Market size and forecast 2023-2028 ($ million)
            • Data Table on Europe - Market size and forecast 2023-2028 ($ million)
            • Chart on Europe - Year-over-year growth 2023-2028 (%)
            • Data Table on Europe - Year-over-year growth 2023-2028 (%)
          • 9.6 South America - Market size and forecast 2023-2028
            • Chart on South America - Market size and forecast 2023-2028 ($ million)
            • Data Table on South America - Market size and forecast 2023-2028 ($ million)
            • Chart on South America - Year-over-year growth 2023-2028 (%)
            • Data Table on South America - Year-over-year growth 2023-2028 (%)
          • 9.7 Middle East and Africa - Market size and forecast 2023-2028
            • Chart on Middle East and Africa - Market size and forecast 2023-2028 ($ million)
            • Data Table on Middle East and Africa - Market size and forecast 2023-2028 ($ million)
            • Chart on Middle East and Africa - Year-over-year growth 2023-2028 (%)
            • Data Table on Middle East and Africa - Year-over-year growth 2023-2028 (%)
          • 9.8 China - Market size and forecast 2023-2028
            • Chart on China - Market size and forecast 2023-2028 ($ million)
            • Data Table on China - Market size and forecast 2023-2028 ($ million)
            • Chart on China - Year-over-year growth 2023-2028 (%)
            • Data Table on China - Year-over-year growth 2023-2028 (%)
          • 9.9 US - Market size and forecast 2023-2028
            • Chart on US - Market size and forecast 2023-2028 ($ million)
            • Data Table on US - Market size and forecast 2023-2028 ($ million)
            • Chart on US - Year-over-year growth 2023-2028 (%)
            • Data Table on US - Year-over-year growth 2023-2028 (%)
          • 9.10 UK - Market size and forecast 2023-2028
            • Chart on UK - Market size and forecast 2023-2028 ($ million)
            • Data Table on UK - Market size and forecast 2023-2028 ($ million)
            • Chart on UK - Year-over-year growth 2023-2028 (%)
            • Data Table on UK - Year-over-year growth 2023-2028 (%)
          • 9.11 Japan - Market size and forecast 2023-2028
            • Chart on Japan - Market size and forecast 2023-2028 ($ million)
            • Data Table on Japan - Market size and forecast 2023-2028 ($ million)
            • Chart on Japan - Year-over-year growth 2023-2028 (%)
            • Data Table on Japan - Year-over-year growth 2023-2028 (%)
          • 9.12 Germany - Market size and forecast 2023-2028
            • Chart on Germany - Market size and forecast 2023-2028 ($ million)
            • Data Table on Germany - Market size and forecast 2023-2028 ($ million)
            • Chart on Germany - Year-over-year growth 2023-2028 (%)
            • Data Table on Germany - Year-over-year growth 2023-2028 (%)
          • 9.13 Market opportunity by geography
            • Market opportunity by geography ($ million)
            • Data Tables on Market opportunity by geography ($ million)

          10 Drivers, Challenges, and Opportunity/Restraints

          • 10.1 Market drivers
            • 10.2 Market challenges
              • 10.3 Impact of drivers and challenges
                • Impact of drivers and challenges in 2023 and 2028
              • 10.4 Market opportunities/restraints

                11 Competitive Landscape

                • 11.1 Overview
                  • 11.2 Competitive Landscape
                    • Overview on criticality of inputs and factors of differentiation
                  • 11.3 Landscape disruption
                    • Overview on factors of disruption
                  • 11.4 Industry risks
                    • Impact of key risks on business

                  12 Competitive Analysis

                  • 12.1 Companies profiled
                    • Companies covered
                  • 12.2 Market positioning of companies
                    • Matrix on companies position and classification
                  • 12.3 ABB
                    • ABB - Overview
                    • ABB - Product / Service
                    • ABB - Key news
                    • ABB - Key offerings
                  • 12.4 Cadillac Automation and Controls
                    • Cadillac Automation and Controls - Overview
                    • Cadillac Automation and Controls - Product / Service
                    • Cadillac Automation and Controls - Key offerings
                  • 12.5 Cisco Systems Inc.
                    • Cisco Systems Inc. - Overview
                    • Cisco Systems Inc. - Business segments
                    • Cisco Systems Inc. - Key news
                    • Cisco Systems Inc. - Key offerings
                    • Cisco Systems Inc. - Segment focus
                  • 12.6 Eaton Corp. Plc
                    • Eaton Corp. Plc - Overview
                    • Eaton Corp. Plc - Business segments
                    • Eaton Corp. Plc - Key news
                    • Eaton Corp. Plc - Key offerings
                    • Eaton Corp. Plc - Segment focus
                  • 12.7 Emerson Electric Co.
                    • Emerson Electric Co. - Overview
                    • Emerson Electric Co. - Business segments
                    • Emerson Electric Co. - Key news
                    • Emerson Electric Co. - Key offerings
                    • Emerson Electric Co. - Segment focus
                  • 12.8 General Electric Co.
                    • General Electric Co. - Overview
                    • General Electric Co. - Business segments
                    • General Electric Co. - Key news
                    • General Electric Co. - Key offerings
                    • General Electric Co. - Segment focus
                  • 12.9 Honeywell International Inc.
                    • Honeywell International Inc. - Overview
                    • Honeywell International Inc. - Business segments
                    • Honeywell International Inc. - Key news
                    • Honeywell International Inc. - Key offerings
                    • Honeywell International Inc. - Segment focus
                  • 12.10 iGrid T and D
                    • iGrid T and D - Overview
                    • iGrid T and D - Product / Service
                    • iGrid T and D - Key offerings
                  • 12.11 Larsen and Toubro Ltd.
                    • Larsen and Toubro Ltd. - Overview
                    • Larsen and Toubro Ltd. - Business segments
                    • Larsen and Toubro Ltd. - Key news
                    • Larsen and Toubro Ltd. - Key offerings
                    • Larsen and Toubro Ltd. - Segment focus
                  • 12.12 NovaTech LLC
                    • NovaTech LLC - Overview
                    • NovaTech LLC - Product / Service
                    • NovaTech LLC - Key offerings
                  • 12.13 NR Electric Co. Ltd.
                    • NR Electric Co. Ltd. - Overview
                    • NR Electric Co. Ltd. - Product / Service
                    • NR Electric Co. Ltd. - Key offerings
                  • 12.14 Open Systems International Inc.
                    • Open Systems International Inc. - Overview
                    • Open Systems International Inc. - Product / Service
                    • Open Systems International Inc. - Key offerings
                  • 12.15 Schneider Electric SE
                    • Schneider Electric SE - Overview
                    • Schneider Electric SE - Business segments
                    • Schneider Electric SE - Key news
                    • Schneider Electric SE - Key offerings
                    • Schneider Electric SE - Segment focus
                  • 12.16 Siemens AG
                    • Siemens AG - Overview
                    • Siemens AG - Business segments
                    • Siemens AG - Key news
                    • Siemens AG - Key offerings
                    • Siemens AG - Segment focus
                  • 12.17 Tekvel
                    • Tekvel - Overview
                    • Tekvel - Product / Service
                    • Tekvel - Key offerings

                  13 Appendix

                  • 13.1 Scope of the report
                    • 13.2 Inclusions and exclusions checklist
                      • Inclusions checklist
                      • Exclusions checklist
                    • 13.3 Currency conversion rates for US$
                      • Currency conversion rates for US$
                    • 13.4 Research methodology
                      • Research methodology
                    • 13.5 Data procurement
                      • Information sources
                    • 13.6 Data validation
                      • Data validation
                    • 13.7 Validation techniques employed for market sizing
                      • Validation techniques employed for market sizing
                    • 13.8 Data synthesis
                      • Data synthesis
                    • 13.9 360 degree market analysis
                      • 360 degree market analysis
                    • 13.10 List of abbreviations
                      • List of abbreviations

                    Research Methodology

                    Technavio presents a detailed picture of the market by way of study, synthesis, and summation of data from multiple sources. The analysts have presented the various facets of the market with a particular focus on identifying the key industry influencers. The data thus presented is comprehensive, reliable, and the result of extensive research, both primary and secondary.

                    INFORMATION SOURCES

                    Primary sources

                    • Manufacturers and suppliers
                    • Channel partners
                    • Industry experts
                    • Strategic decision makers

                    Secondary sources

                    • Industry journals and periodicals
                    • Government data
                    • Financial reports of key industry players
                    • Historical data
                    • Press releases

                    DATA ANALYSIS

                    Data Synthesis

                    • Collation of data
                    • Estimation of key figures
                    • Analysis of derived insights

                    Data Validation

                    • Triangulation with data models
                    • Reference against proprietary databases
                    • Corroboration with industry experts

                    REPORT WRITING

                    Qualitative

                    • Market drivers
                    • Market challenges
                    • Market trends
                    • Five forces analysis

                    Quantitative

                    • Market size and forecast
                    • Market segmentation
                    • Geographical insights
                    • Competitive landscape

                    Interested in this report?

                    Get your sample now to see our research methodology and insights!

                    Download Now

                    Frequently Asked Questions

                    Digital Substation market growth will increase by $ 3230.7 mn during 2024-2028 .

                    The Digital Substation market is expected to grow at a CAGR of 7.22% during 2024-2028 .

                    Digital Substation market is segmented by Type( Transmission, Distribution) Component( Hardware, Fiber-optic communication networks, SCADA systems)

                    ABB, Cadillac Automation and Controls, Cisco Systems Inc., Eaton Corp. Plc, Efacec, Emerson Electric Co., General Electric Co., Honeywell International Inc., iGrid T and D, Larsen and Toubro Ltd., Locamation, Netcontrol Group, NovaTech LLC, NR Electric Co. Ltd., Open Systems International Inc., Schneider Electric SE, Siemens AG, Tekvel, Tesco Automation Inc., Texas Instruments Inc. are a few of the key vendors in the Digital Substation market.

                    APAC will register the highest growth rate of 34% among the other regions. Therefore, the Digital Substation market in APAC is expected to garner significant business opportunities for the vendors during the forecast period.

                    China, US, UK, Japan, Germany

                    • Increasing demand for compact automation solutionsWith the advent of the Industrial Internet of Things (IIoT) is the driving factor this market.
                    • which is also called Industry 4.0 in the context of automation is the driving factor this market.
                    • challenges related to designing at the control level have increased significantly. IIoT provides various benefits is the driving factor this market.
                    • such as real-time communication capability and higher reliability. It also increases the efficiency of industrial automation control systems. The use of IIoT for manufacturing and factory automation enables smart maintenance is the driving factor this market.
                    • distributed intelligence systems is the driving factor this market.
                    • and predictive analytics. However is the driving factor this market.
                    • the rising adoption of IoT-enabled devices is leading to design challenges related to the reduction of prices and gaining the benefits of factory automation for manufacturers and system integrators.Factory automation processes can be divided into three levels of control is the driving factor this market.
                    • which are the field level is the driving factor this market.
                    • the control level is the driving factor this market.
                    • and the operator level. The field level includes I/O modules is the driving factor this market.
                    • sensors is the driving factor this market.
                    • and actuators; the control level includes PLCs is the driving factor this market.
                    • SCADA is the driving factor this market.
                    • motor drives is the driving factor this market.
                    • as well as controllers and DCS; the operator level includes HMI. Most large industrial manufacturing companies that have access to substantial financial resources have already automated their manufacturing processes completely. However is the driving factor this market.
                    • moving to automated processes is a major challenge for small and medium-sized enterprises (SMEs) due to budget constraints. Hence is the driving factor this market.
                    • most SMEs look for small form factors that can provide the same functionalities and features as large devices while consuming less power. The availability of PLCs enables SMEs to utilize control-level automation at a lower cost without compromising productivity. Some vendors have developed PLCs that can stack multiple PLCs and handle a large number of I/O points with a maximum number of analog I/O. Vendors are also swiftly upgrading the features of their products based on end-user requirements. All these factors enable a seamless transition from traditional automation to Industry 4.0 in the manufacturing industry. Therefore is the driving factor this market.
                    • the increasing demand for compact automation solutions is expected to drive the growth of the global digital substation market during the forecast period. is the driving factor this market.

                    The Digital Substation market vendors should focus on grabbing business opportunities from the Transmission segment as it accounted for the largest market share in the base year.