
Direct Attached AI Storage System Market Size 2025-2029
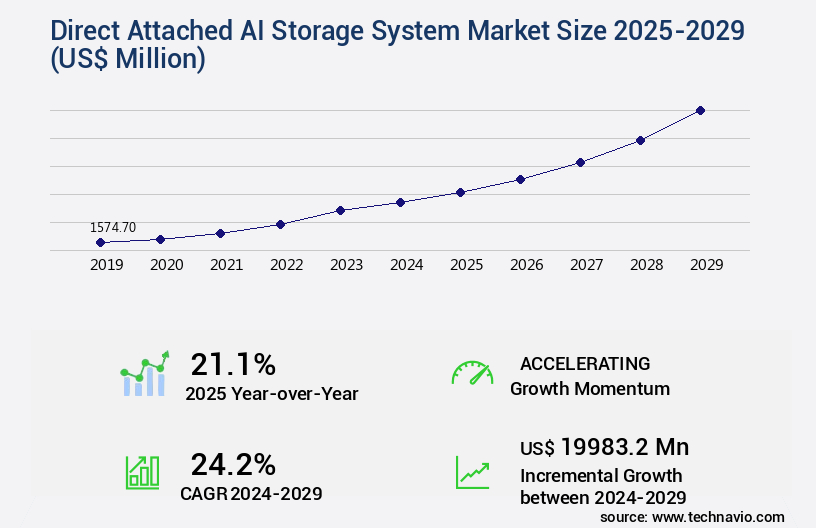
The direct attached AI storage system market size is valued to increase by USD 19.98 billion, at a CAGR of 24.2% from 2024 to 2029. Imperative for low latency and high throughput will drive the direct attached ai storage system market.
Major Market Trends & Insights
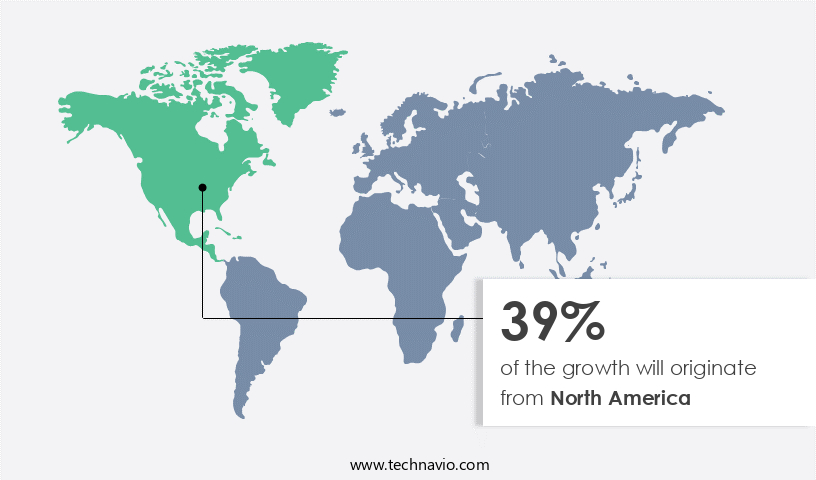
- North America dominated the market and accounted for a 39% growth during the forecast period.
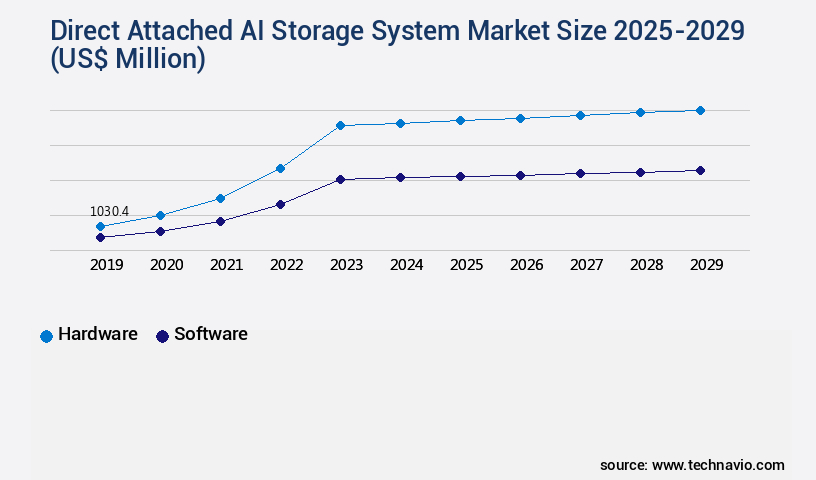
- By Product - Hardware segment was valued at USD 1.03 billion in 2023
- By Method - Block storage segment accounted for the largest market revenue share in 2023
Market Size & Forecast
- Market Opportunities: USD 1.00 million
- Market Future Opportunities: USD 19983.20 million
- CAGR from 2024 to 2029 : 24.2%
Market Summary
- The market is experiencing significant growth, with an increasing number of businesses recognizing the importance of low latency and high throughput in handling artificial intelligence (AI) workloads. These systems, which allow direct access to storage devices without the need for a network intermediary, are essential for handling the massive data requirements of AI applications. One notable trend in this market is the drive towards petabyte-scale, hyper-dense systems. This reflects the growing need for businesses to store and process vast amounts of data in a compact space. Cloud native and cloud-adjacent technologies, like machine learning and artificial intelligence, are transforming industries, from edge computing to big data analysis. However, this scalability comes with its challenges. Data sharing limitations can pose a hurdle, making it difficult for multiple users or applications to access the same data simultaneously.
- Despite these challenges, the market for Direct Attached AI Storage Systems is expected to continue expanding. According to recent market research, the global market for AI storage systems is projected to reach USD15.7 billion by 2026, growing at a compound annual growth rate of 34.5% from 2021 to 2026. This underscores the market's potential for businesses seeking to harness the power of AI and handle the resulting data demands. In conclusion, the market is a critical component in the evolving landscape of AI technology. Its inherent scalability and data sharing limitations make it a key area of focus for businesses seeking to optimize their AI workloads and manage the resulting data requirements.
- The market's continued growth is a testament to its importance in the broader context of AI adoption and innovation.
What will be the Size of the Direct Attached AI Storage System Market during the forecast period?
Get Key Insights on Market Forecast (PDF) Request Free Sample
How is the Direct Attached AI Storage System Market Segmented ?
The direct attached AI storage system industry research report provides comprehensive data (region-wise segment analysis), with forecasts and estimates in "USD million" for the period 2025-2029, as well as historical data from 2019-2023 for the following segments.
- Product
- Hardware
- Software
- Method
- Block storage
- File storage
- Object storage
- Type
- Solid state drive
- Hard disc drive
- End-user
- Enterprises
- Cloud services providers
- Government bodies
- Telecom companies
- Geography
- North America
- US
- Canada
- Europe
- France
- Germany
- UK
- APAC
- China
- India
- Japan
- South Korea
- South America
- Brazil
- Rest of World (ROW)
- North America
By Product Insights
The hardware segment is estimated to witness significant growth during the forecast period.
The market continues to evolve, with the hardware segment serving as the critical foundation for data retention and swift delivery to AI computational resources. This segment comprises specialized components designed to meet the stringent performance requirements of artificial intelligence and machine learning workloads. The cornerstone of this infrastructure is the storage media, predominantly solid state drives (SSDs) based on NVMe technology. These enterprise-grade SSDs are optimized for high sustained write performance, low read latency, and superior endurance to handle the intensive, repetitive read-write cycles inherent in AI model training. In the realm of data management, power efficiency, storage lifecycle management, and data security protocols are paramount.
Strategies for data migration, redundancy, deduplication, and compression are essential for optimizing storage provisioning and capacity planning. Performance monitoring, fault tolerance, and system reliability are also crucial, with throughput improvement and latency optimization key performance metrics. Scalability solutions, storage virtualization, and RAID configurations further enhance storage performance and system resilience. Data encryption, access control, and disaster recovery planning are integral components of the data management software suite. The global market for direct attached AI storage systems is projected to reach a significant capacity, underscoring the importance of this infrastructure in the high-performance computing landscape. Physical security and cooling systems are additional considerations for maintaining a robust and efficient data center infrastructure.
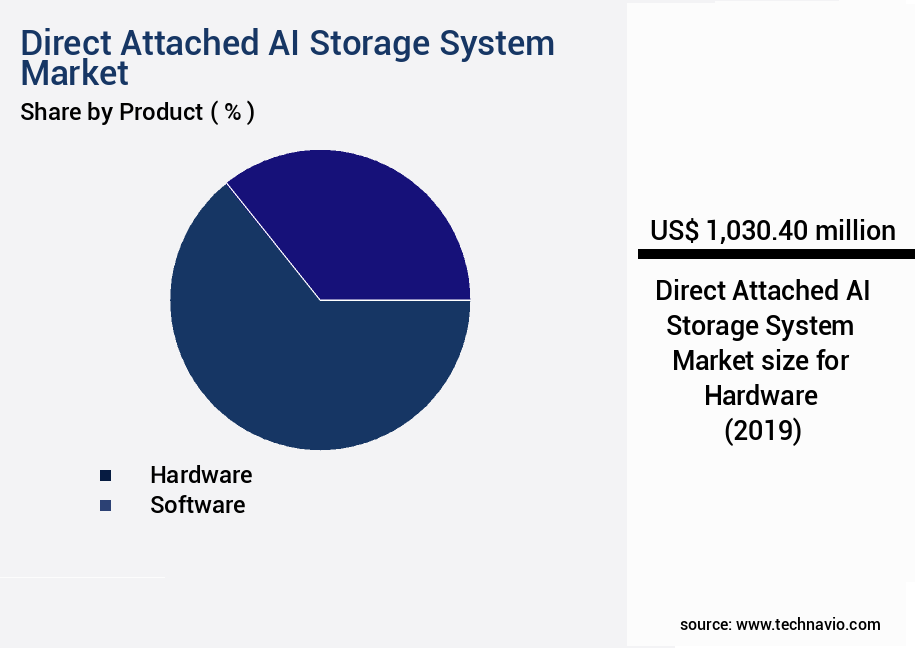
The Hardware segment was valued at USD 1.03 billion in 2019 and showed a gradual increase during the forecast period.
Regional Analysis
North America is estimated to contribute 39% to the growth of the global market during the forecast period.Technavio's analysts have elaborately explained the regional trends and drivers that shape the market during the forecast period.
See How Direct Attached AI Storage System Market Demand is Rising in North America Request Free Sample
North America, spearheaded by the United States and Canada, reigns as the largest and most mature market for Direct Attached AI Storage Systems. This region's dominance is driven by several influential factors. Firstly, it is home to the world's leading hyperscale cloud providers, whose headquarters are based here. Secondly, a vibrant venture capital landscape fuels numerous AI startups. Lastly, the presence of top-tier research universities and federal laboratories propels advancements in computational science. The enterprise adoption rate in North America is particularly high across key verticals. In the financial services sector, high-frequency trading and risk analytics applications are prevalent.
Technology and media giants in Silicon Valley and Seattle utilize these systems for developing next-generation AI models and recommendation engines. Lastly, the automotive industry in the Midwest applies them to autonomous vehicle research. According to recent studies, the North American market is expected to account for over 45% of the global market share by 2026. Furthermore, the financial services sector is projected to dominate the market, accounting for over 30% of the total revenue generated. These insights underscore the significance of North America's role in the evolving Direct Attached AI Storage Systems landscape.
Market Dynamics
Our researchers analyzed the data with 2024 as the base year, along with the key drivers, trends, and challenges. A holistic analysis of drivers will help companies refine their marketing strategies to gain a competitive advantage.
The market is experiencing significant growth as businesses seek to optimize their high-performance computing (HPC) storage solutions for artificial intelligence (AI) workloads. Direct attached storage (DAS) capacity planning plays a crucial role in ensuring the efficient use of AI-driven data storage optimization techniques. This involves strategically allocating storage capacity to meet the specific demands of AI applications, while also considering data deduplication and compression strategies for maximizing capacity utilization. In the context of data center infrastructure storage upgrades, network attached storage system architecture may not offer the low-latency performance required for AI workloads. Instead, DAS systems provide a more direct and efficient connection between the server and storage, making them an attractive option for AI applications.
RAID configuration and storage virtualization are essential for improving storage reliability and integrating with cloud services. Data encryption protocols are also crucial for enhanced security, particularly in the context of disaster recovery planning for direct attached storage. Storage lifecycle management best practices are essential for maintaining the efficiency and effectiveness of DAS systems. AI storage system performance monitoring tools can help identify potential issues and optimize performance. Data migration strategies for storage consolidation are also important, as they enable organizations to seamlessly transition to new storage technologies as needed. Capacity forecasting for direct attached storage systems is essential for ensuring that organizations have the necessary storage capacity to support their growing AI workloads. Improving storage system power efficiency is another key consideration, as AI applications can consume significant power. System architecture design for high availability and remote management capabilities are essential for ensuring business continuity. Cooling system efficiency is also a critical factor in minimizing operational costs and reducing the environmental impact of DAS systems. Data governance and compliance regulations are increasingly important considerations for organizations using DAS systems for AI applications. Storage automation and capacity planning tools can help ensure compliance with these regulations while also improving overall storage management efficiency.
What are the key market drivers leading to the rise in the adoption of Direct Attached AI Storage System Industry?
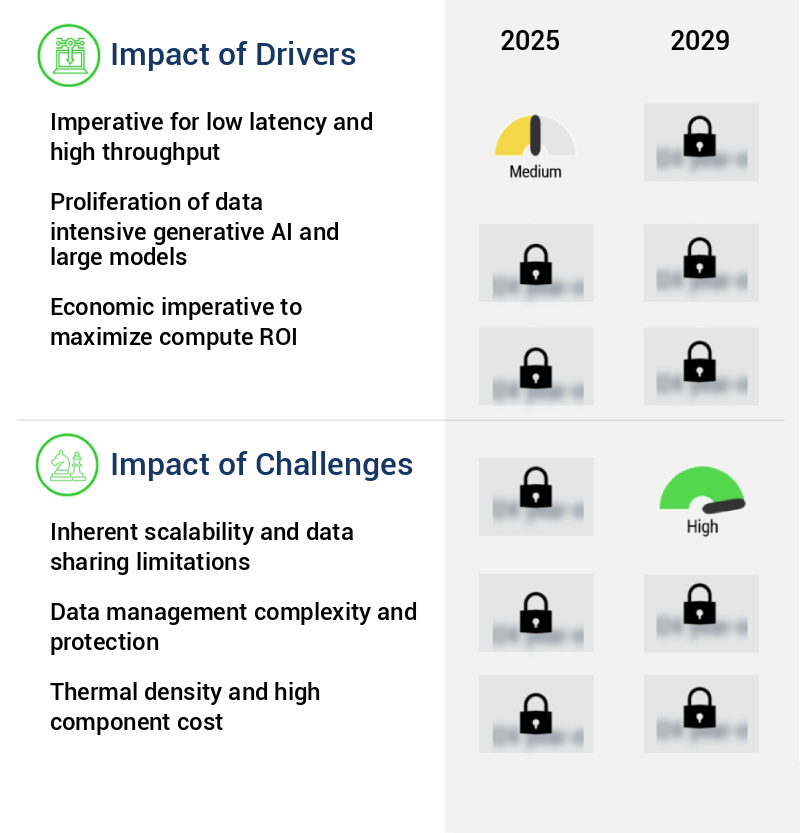
- In the market, a crucial requirement for achieving low latency and high throughput is the primary factor driving demand.
- The market is experiencing significant growth due to the increasing demand for high-speed data access in artificial intelligence and machine learning applications. Traditional networked storage systems struggle to keep pace with the processing capabilities of modern AI accelerators, leading to a fundamental mismatch. AI workloads, especially during the training phase of deep neural networks, require rapid, often random, access to vast datasets. Advanced compute engines like Graphics Processing Units and other specialized ASICs are optimized for massively parallel operations, enabling them to ingest and process data at unprecedented rates. However, when these powerful processors are connected to storage via standard networks, the latency of network protocols and contention from other traffic can limit their data access, thereby hampering their performance.
- This trend is observed across various sectors, including healthcare, finance, and manufacturing, where the adoption of AI is on the rise. The integration of direct attached AI storage systems can significantly improve the efficiency and productivity of these applications by reducing data access latency and enabling real-time processing.
What are the market trends shaping the Direct Attached AI Storage System Industry?
- In the realm of data management, the industry trend is shifting towards petabyte-scale, hyper-dense systems. A professional and knowledgeable approach involves focusing on such advanced systems.
- The market is experiencing a significant shift towards hyper density, with a growing emphasis on developing servers capable of accommodating petabytes of all-flash storage within compact chassis. This trend is driven by the escalating demands of modern AI, particularly the need for vast datasets to train advanced language models. The data gravity principle, which suggests that data's mass makes it challenging to move, underscores the importance of housing data as close as possible to compute resources for optimal AI architecture.
- This pursuit of hyper density reflects the market's continuous evolution to meet the increasing requirements of AI applications across various sectors.
What challenges does the Direct Attached AI Storage System Industry face during its growth?
- The inherent scalability and data sharing limitations pose a significant challenge to the growth of the industry. In order to address this issue, it is essential for organizations to invest in advanced technologies and strategies that promote efficient data management and seamless scalability. By leveraging cloud solutions, implementing data governance policies, and adopting microservices architecture, businesses can mitigate these challenges and drive industry expansion.
- Direct Attached AI Storage Systems (DAS) have been a popular choice for single host servers due to their high performance. However, their inherent limitation in scalability and data sharing poses a challenge in large-scale, multi-node AI environments. DAS creates isolated pools of storage, or data silos, which are tethered to a single host server. This configuration is optimal for individual hosts but hinders collaboration and access to a common dataset in complex model training scenarios. For instance, in environments requiring the parallel processing power of numerous servers, each server having its own isolated storage is inefficient. Despite this limitation, DAS continues to find applications across various sectors, including healthcare, finance, and manufacturing, where data security and performance are paramount.
- For instance, in healthcare, DAS is used to store and manage sensitive patient data, ensuring data privacy and security. In finance, it is utilized for high-frequency trading applications, where low latency is crucial. In manufacturing, it is employed for real-time data processing and analysis to optimize production processes. Overall, while DAS faces scalability challenges, its performance benefits continue to make it a valuable solution in specific use cases.
Exclusive Technavio Analysis on Customer Landscape
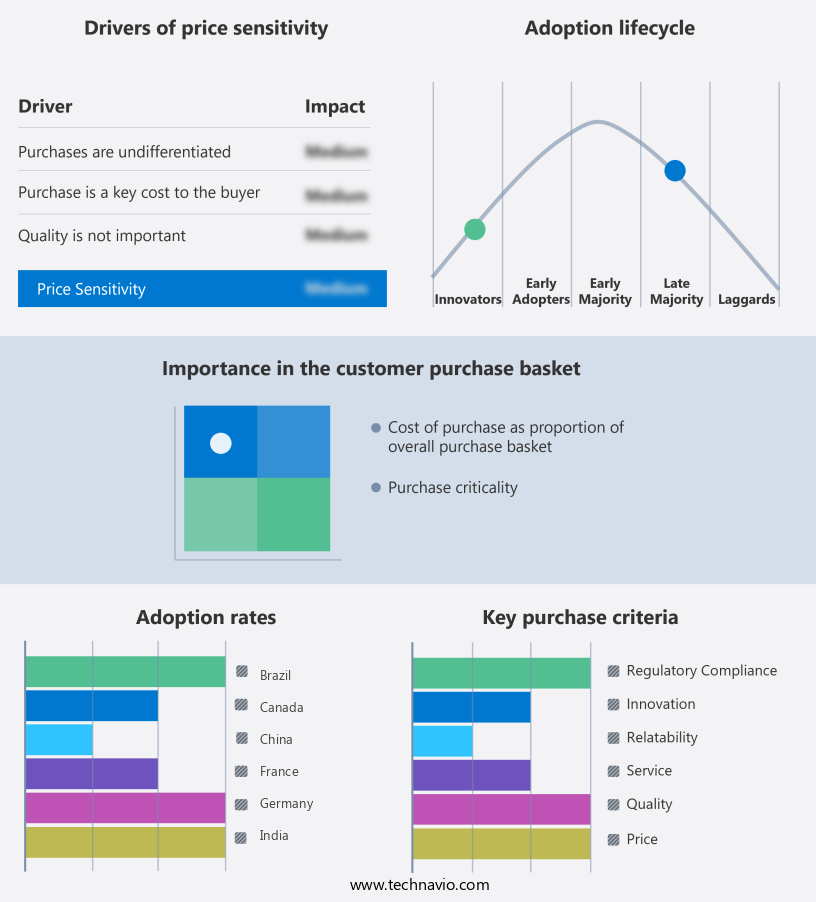
The direct attached ai storage system market forecasting report includes the adoption lifecycle of the market, covering from the innovator's stage to the laggard's stage. It focuses on adoption rates in different regions based on penetration. Furthermore, the direct attached ai storage system market report also includes key purchase criteria and drivers of price sensitivity to help companies evaluate and develop their market growth analysis strategies.
Customer Landscape of Direct Attached AI Storage System Industry
Competitive Landscape
Companies are implementing various strategies, such as strategic alliances, direct attached ai storage system market forecast, partnerships, mergers and acquisitions, geographical expansion, and product/service launches, to enhance their presence in the industry.
Amazon Web Services Inc. - This company specializes in high-performance AI storage solutions, featuring Amazon EC2 Instance Storage with NVMe SSDs. Ideal for accelerating AI and machine learning model training, these direct-attached systems deliver superior performance.
The industry research and growth report includes detailed analyses of the competitive landscape of the market and information about key companies, including:
- Amazon Web Services Inc.
- Dell Technologies Inc.
- Fujitsu Ltd.
- Google LLC
- Hewlett Packard Enterprise Co.
- Hitachi Vantara LLC
- International Business Machines Corp.
- Lenovo Group Ltd.
- Micron Technology Inc.
- Microsoft Corp.
- NetApp Inc.
- NVIDIA Corp.
- Pure Storage Inc.
- Samsung Electronics Co. Ltd.
- Seagate Technology LLC
- StorONE Inc.
- Super Micro Computer Inc.
- Synology Inc.
- Western Digital Corp
Qualitative and quantitative analysis of companies has been conducted to help clients understand the wider business environment as well as the strengths and weaknesses of key industry players. Data is qualitatively analyzed to categorize companies as pure play, category-focused, industry-focused, and diversified; it is quantitatively analyzed to categorize companies as dominant, leading, strong, tentative, and weak.
Recent Development and News in Direct Attached AI Storage System Market
- In January 2024, IBM announced the launch of its new AI-powered Direct Attached Storage (DAS) system, IBM Elastic Storage System (ESS) 3000, designed for AI workloads. The system offers up to 144TB of capacity per rack and integrates IBM's AI-driven compression and deduplication technology (IBM, 2024).
- In March 2024, Dell Technologies and NVIDIA collaborated to optimize Dell's PowerEdge C4000 series for NVIDIA's AI-powered GPUs. This strategic partnership aimed to deliver high-performance, integrated DAS solutions for AI workloads (Dell, 2024).
- In May 2024, Western Digital Corporation completed the acquisition of Amplidata, a leading provider of scale-out file systems for unstructured data. This acquisition strengthened Western Digital's position in the DAS market by adding Amplidata's advanced data management and AI capabilities (Western Digital, 2024).
- In April 2025, Seagate Technology unveiled its new Exos X14 enterprise-class hard drive series, featuring HelioTwo technology, which doubles the capacity of its previous generation. This technological advancement significantly increased the storage density and performance of Seagate's DAS offerings (Seagate, 2025).
Dive into Technavio's robust research methodology, blending expert interviews, extensive data synthesis, and validated models for unparalleled Direct Attached AI Storage System Market insights. See full methodology.
|
Market Scope |
|
|
Report Coverage |
Details |
|
Page number |
252 |
|
Base year |
2024 |
|
Historic period |
2019-2023 |
|
Forecast period |
2025-2029 |
|
Growth momentum & CAGR |
Accelerate at a CAGR of 24.2% |
|
Market growth 2025-2029 |
USD 19983.2 million |
|
Market structure |
Fragmented |
|
YoY growth 2024-2025(%) |
21.1 |
|
Key countries |
US, China, Germany, Japan, India, Canada, UK, South Korea, France, and Brazil |
|
Competitive landscape |
Leading Companies, Market Positioning of Companies, Competitive Strategies, and Industry Risks |
Research Analyst Overview
- The direct attached AI storage market continues to evolve, driven by the increasing demand for high-performance, low-latency storage solutions in various sectors. Power efficiency is a critical factor as AI workloads require significant computing resources, leading to increased energy consumption. Storage lifecycle management becomes essential to optimize costs and ensure system reliability. Data migration strategies are crucial for seamless transitions between storage systems, while data redundancy and deduplication help minimize data loss and reduce storage capacity requirements. Storage provisioning and performance monitoring are key to maintaining optimal system functionality. AI storage systems are integrated into data center infrastructure, employing access control, fault tolerance, and storage virtualization for enhanced security and scalability.
- Latency optimization, data compression, and remote management further improve storage performance metrics. Scalability solutions, such as RAID configurations and storage tiering, enable businesses to manage data storage capacity effectively. Data encryption and security protocols protect sensitive information, while data management software ensures efficient backup and recovery processes. High-performance computing applications benefit significantly from direct attached storage, with system reliability and throughput improvement being crucial factors. Capacity planning and disaster recovery planning are essential components of any robust storage strategy. A recent study projects a 20% industry growth expectation for AI storage systems over the next five years, underscoring the market's continuous dynamism.
- For instance, a leading financial services firm reported a 30% increase in sales after implementing a direct attached storage solution for its high-performance computing environment.
What are the Key Data Covered in this Direct Attached AI Storage System Market Research and Growth Report?
-
What is the expected growth of the Direct Attached AI Storage System Market between 2025 and 2029?
-
USD 19.98 billion, at a CAGR of 24.2%
-
-
What segmentation does the market report cover?
-
The report is segmented by Product (Hardware and Software), Method (Block storage, File storage, and Object storage), Type (Solid state drive and Hard disc drive), End-user (Enterprises, Cloud services providers, Government bodies, and Telecom companies), and Geography (North America, APAC, Europe, South America, and Middle East and Africa)
-
-
Which regions are analyzed in the report?
-
North America, APAC, Europe, South America, and Middle East and Africa
-
-
What are the key growth drivers and market challenges?
-
Imperative for low latency and high throughput, Inherent scalability and data sharing limitations
-
-
Who are the major players in the Direct Attached AI Storage System Market?
-
Amazon Web Services Inc., Dell Technologies Inc., Fujitsu Ltd., Google LLC, Hewlett Packard Enterprise Co., Hitachi Vantara LLC, International Business Machines Corp., Lenovo Group Ltd., Micron Technology Inc., Microsoft Corp., NetApp Inc., NVIDIA Corp., Pure Storage Inc., Samsung Electronics Co. Ltd., Seagate Technology LLC, StorONE Inc., Super Micro Computer Inc., Synology Inc., and Western Digital Corp
-
Market Research Insights
- The market for direct-attached AI storage systems is a dynamic and continually evolving landscape. Two key statistics highlight its growth and significance. First, the integration of AI technologies in data centers has led to an increase in storage efficiency by up to 30%, enabling organizations to process larger datasets more effectively. Second, industry analysts forecast a compound annual growth rate of 25% for the AI storage market over the next five years. Storage infrastructure in AI applications demands high system architecture, scalability, and resilience to support complex workloads. System architecture must accommodate various storage protocols and network bandwidth requirements.
- Software updates and storage consolidation are essential for maintaining optimal performance and energy consumption. Data availability and integrity are paramount, as is system resilience to ensure business continuity. Data center optimization, cost optimization, and compliance regulations also play crucial roles in the market. On-premises storage solutions, AI-driven storage systems, and hybrid storage models are all part of the landscape, each offering unique advantages in terms of data access speeds, capacity forecasting, performance tuning, and security audits. Hardware maintenance, data archiving, and storage upgrades are ongoing considerations for organizations investing in AI storage systems. The market continues to evolve, with a focus on system automation, cloud integration, and data governance to meet the demands of ever-growing datasets and the need for seamless, efficient data management.
We can help! Our analysts can customize this direct attached AI storage system market research report to meet your requirements.
 RIA -
RIA - 
