Direct Carrier Billing Market Analysis, Size, and Forecast 2025-2029: North America (US and Canada), Europe (France, Germany, Spain, and UK), APAC (China, India, Japan, and South Korea), and Rest of World (ROW)

Direct Carrier Billing Market Analysis, Size, and Forecast 2025-2029:
North America (US and Canada), Europe (France, Germany, Spain, and UK), APAC (China, India, Japan, and South Korea), and Rest of World (ROW)

Published: Jun 2025 229 Pages SKU: IRTNTR73245

Market Overview at a Glance

$28.90 B
Market Opportunity
10.4%
CAGR
9.3
YoY growth 2024-2025(%)

Direct Carrier Billing Market Size 2025-2029

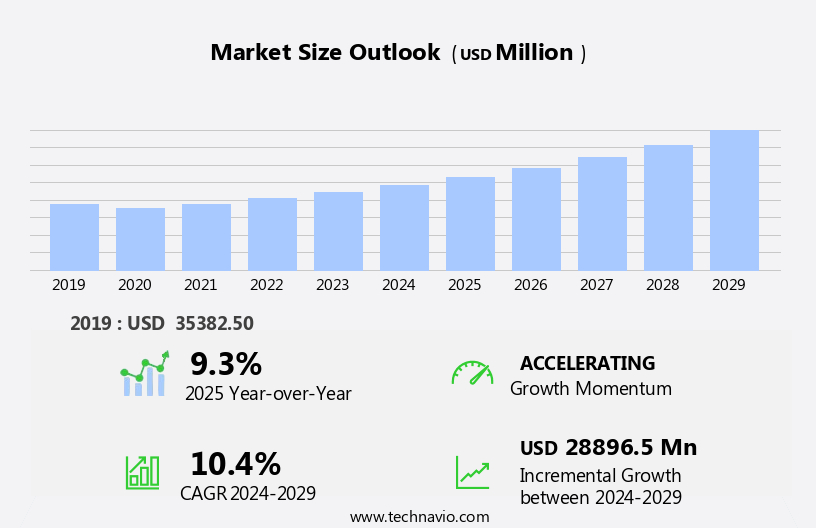
The direct carrier billing market size is forecast to increase by USD 28.9 billion at a CAGR of 10.4% between 2024 and 2029.

  • The market is experiencing significant growth due to the increasing consumer demand for digital content. This trend is driven by the convenience and ease of use offered by carrier billing, allowing customers to charge mobile transactions directly to their phone bills. Furthermore, the popularity of cryptocurrencies is adding momentum to the market, as some carriers have started to accept digital currencies as payment methods for carrier billing. However, the market faces intense competition from alternative payment technologies, such as mobile wallets and online payment platforms.
  • Companies must navigate these challenges by focusing on enhancing their security measures, offering competitive pricing, and providing seamless user experiences to attract and retain customers. By capitalizing on these opportunities and addressing the competition, market players can effectively position themselves in the evolving digital payment landscape. With the rise in smartphone usage and mobile internet penetration, DCB has emerged as a convenient and secure payment method for digital goods and services.

What will be the Size of the Direct Carrier Billing Market during the forecast period?

Direct Carrier Billing Market Size

 Explore in-depth regional segment analysis with market size data - historical 2019-2023 and forecasts 2025-2029 - in the full report.  
Request Free Sample

The market is witnessing significant activity and trends as businesses seek alternative payment methods to credit card processing. In this dynamic landscape, payment gateway selection and integration with e-wallets, debit cards, and cryptocurrencies are crucial for multi-currency support and global expansion. Premium services, such as content monetization, affiliate marketing, and loyalty programs, are driving revenue growth. However, security risks, including data breaches and fraud, necessitate advanced technology innovation, such as AI-powered fraud detection and blockchain technology. Operating costs, scalability issues, and integration challenges persist, requiring strategic partnerships and compliance with regulatory standards.

Predictive analytics, discount codes, and promotional offers help businesses optimize revenue and customer onboarding. Meanwhile, international payments, chargeback management, and dispute resolution demand efficient solutions to minimize maintenance costs and maintain privacy protection. Risk management and regulatory compliance are essential for cross-border transactions, ensuring a seamless customer experience. Additionally, the popularity of cryptocurrencies has introduced new opportunities for DCB, as carriers explore partnerships with blockchain platforms to offer cryptocurrency billing.

How is this Direct Carrier Billing Industry segmented?

The direct carrier billing industry research report provides comprehensive data (region-wise segment analysis), with forecasts and estimates in "USD million" for the period 2025-2029, as well as historical data from 2019-2023 for the following segments.

  • Platform
    • Android
    • Web-based platforms
    • iOS
  • Type
    • Pure DCB
    • OTP-based DCB
    • PIN-based DCB
    • Limited DCB
    • Hybrid DCB
  • End-user
    • Apps and games
    • Online media
    • Others
  • Geography
    • North America
      • US
      • Canada
    • Europe
      • France
      • Germany
      • Spain
      • UK
    • APAC
      • China
      • India
      • Japan
      • South Korea
    • Rest of World (ROW)

By Platform Insights

The Android segment is estimated to witness significant growth during the forecast period. The Direct Carrier Billing (DCB) market is witnessing significant growth, particularly in regions with low credit card penetration and high mobile usage. Android, as the dominant mobile operating system, plays a crucial role in driving digital monetization through DCB. Its vast user base and open ecosystem enable seamless integration of DCB across a multitude of devices and app stores. This accessibility empowers users to make purchases for digital content, such as games, streaming services, and in-app features, by charging payments to their mobile phone bills. Telecom operators and digital merchants favor Android for DCB deployments due to its flexibility and compatibility with various billing platforms, third-party payment processors, and wallet integrations.

Security protocols and fraud prevention measures are prioritized to ensure secure transactions. Real-time processing and customer support are essential components of DCB, enabling user-friendly experiences and efficient account management. Business models range from revenue sharing to flat fees, while technical support and integration partners facilitate seamless implementation. DCB also supports various pricing models, including subscription management and in-app purchases. The market's evolution includes the integration of marketing automation, reporting tools, and mobile marketing to enhance user engagement and acquisition. DCB's penetration rate continues to grow, driving the expansion of mobile commerce, digital content delivery, and other industries.

Direct Carrier Billing Market Size

 Download Free Sample Report

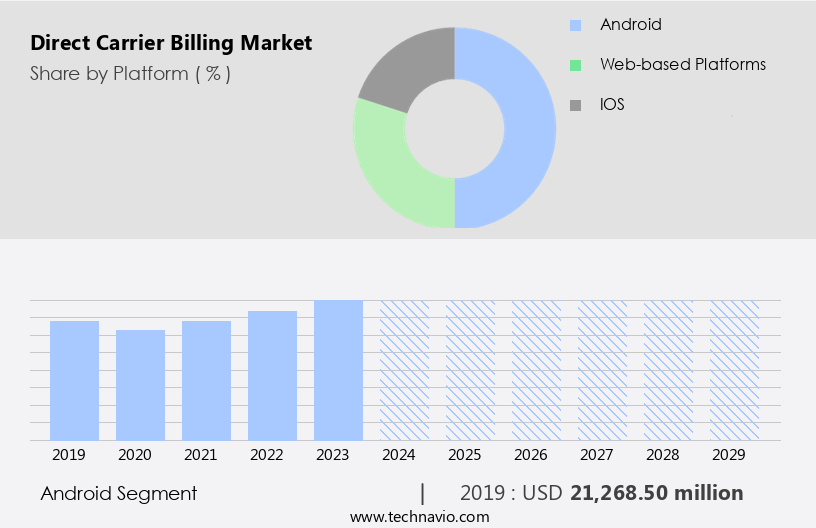
The Android segment was valued at USD 21.27 billion in 2019 and showed a gradual increase during the forecast period.

The Direct Carrier Billing (DCB) Market is growing rapidly, fueled by innovations in rewards programs and personalized mobile advertising that enhance user engagement. As digital transactions diversify, support for debit card processing, ewallet integration, and cryptocurrency payments broadens DCB's appeal. Service providers are leveraging big data analytics to optimize user experiences while adhering to strict compliance standards and reinforcing data security. Accurate payment reconciliation ensures smooth financial operations, though integration costs remain a consideration for smaller players.

Regional Analysis

APAC is estimated to contribute 43% to the growth of the global market during the forecast period.Technavio's analysts have elaborately explained the regional trends and drivers that shape the market during the forecast period.

Direct Carrier Billing Market Share by Geography

View Free PDF Sample

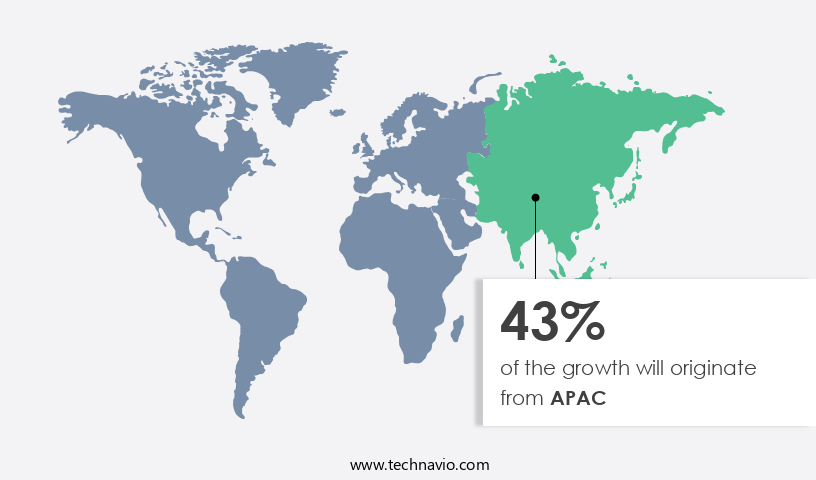
The global Direct Carrier Billing (DCB) market is experiencing significant growth, particularly in the Asia-Pacific (APAC) region. This expansion is attributed to the lower penetration of credit and debit cards in APAC compared to other regions, which includes several populous emerging economies. Consumer income growth and their increasing technological adoption fuel the market's expansion in APAC. The widespread use of mobile devices, especially smartphones with high-speed networks, and the digital world's growing appeal are key factors driving market focus towards expanding their customer base in this region. The DCB market's technology stack includes recurring billing, conversion optimization, customer support, global coverage, wallet integration, operator billing, payment gateways, security protocols, payment solutions, USSD billing, third-party payment processors, SMS billing, pricing models, in-app purchases, SDK integration, carrier billing platform, customer segmentation, account management, business models, technical support, and MMS billing.

The DCB platform's ability to offer real-time processing, security, and seamless integration with various partners and systems is crucial for its success. The market's focus on conversion optimization, fraud prevention, and customer segmentation helps businesses maximize revenue and minimize churn. The market's penetration rate is increasing as more businesses recognize the potential of DCB as a payment solution, especially for digital content delivery and mobile commerce. The market's future growth is expected to be driven by continued innovation, increased focus on user experience, and the integration of advanced technologies like AI and machine learning.

Market Dynamics

Our researchers analyzed the data with 2024 as the base year, along with the key drivers, trends, and challenges. A holistic analysis of drivers will help companies refine their marketing strategies to gain a competitive advantage.

What are the Direct Carrier Billing market drivers leading to the rise in the adoption of Industry?

  • The significant growth in consumer demand for digital content serves as the primary market catalyst. The global market for Direct Carrier Billing (DCB) is experiencing significant growth due to the increasing preference of consumers for digital content. DCB enables wireless subscribers of telecommunication networks to purchase digital goods online by charging the cost to their phone bills. This payment method offers several advantages, including convenience and reliability, making it an attractive option for consumers. The rise of digital media is a key driver for the DCB market. The availability of various digital formats and the increasing number of portable devices that promote digital media consumption have expanded consumers' choices. Additionally, the increasing speed of the Internet ensures that digital content can be accessed at any time and from anywhere.
  • The pricing models for DCB services vary, with some providers offering SDK integration and others utilizing carrier billing platforms. Businesses can also segment their customer base and offer account management services to enhance the user experience. Technical support and real-time processing are essential features of DCB services, ensuring a seamless transaction process. The penetration rate of DCB services is expected to increase as more consumers opt for digital content and telecommunication providers continue to invest in this payment method. Overall, the DCB market is poised for continued growth as it offers a convenient and reliable payment solution for digital goods and services. Platforms like Android and iOS support DCB, enabling in-app purchases and subscriptions for services like mobile gaming, music streaming, and video-on-demand.

What are the Direct Carrier Billing market trends shaping the Industry?

  • The rising prevalence of cryptocurrencies represents a significant market trend in the present day. This increasing popularity signifies a notable shift in the financial landscape. The Direct Carrier Billing (DCB) market is witnessing significant growth due to the increasing popularity of mobile commerce and digital content delivery. This market allows consumers to make payments for digital goods and services directly through their mobile phone bills. Security is a top priority in this market, with regular security audits ensuring the protection of sensitive customer data. Transaction fees are a crucial factor in the DCB market, with API integration enabling seamless and cost-effective payment processing. Customer acquisition cost is a significant challenge, but data analytics and A/B testing help optimize marketing strategies. Subscription management is essential for recurring billing, while user interface (UI) design is crucial for enhancing the customer experience.
  • Integration with partners is vital for expanding reach and increasing conversion rates. DCB is particularly beneficial for emerging economies where credit card usage is low, and mobile phones are the primary means of internet access. The market's dynamics are influenced by factors such as transaction fees, customer acquisition cost, and conversion rates. Overall, the DCB market offers immense potential for businesses looking to tap into the mobile payment trend. Billing, enables smartphone users to make online purchases and subscriptions for Over-The-Top (OTT) content, including games, music streaming, and video-on-demand services, by charging the amount directly to their mobile phone bills.

How does Direct Carrier Billing market faces challenges during its growth?

  • The intense competition posed by emerging alternative payment technologies represents a significant challenge to the industry's growth trajectory. The global Direct Carrier Billing (DCB) market faces competition from other payment technologies, such as payment wallet apps, credit cards, debit cards, and internet banking, posing a challenge to its growth. The online payment industry experiences continuous change, with disruptive and emerging technologies frequently altering consumer payment preferences. The market is concentrated, with major players offering similar services with varying checkout times. Alternate payment modes aim to accelerate transactions without compromising data protection. Batch processing, user experience (UX), marketing automation, reporting tools, and fraud prevention are crucial elements shaping the DCB market. Payment processing through a mobile payment gateway ensures seamless transactions, while payment aggregators simplify the payment process for merchants.
  • Mobile marketing and IVR billing offer convenience to consumers, enhancing the overall user experience. The churn rate is a significant concern for market participants, requiring robust fraud prevention measures to minimize revenue loss. The customer lifetime value is a crucial metric for businesses, emphasizing the importance of maintaining a positive user experience. Reporting tools enable businesses to monitor and analyze transaction data, enabling data-driven decision-making. The DCB market is dynamic, with various factors influencing its growth and development. The focus on enhancing the user experience, ensuring data protection, and maintaining a competitive edge in the market are essential for market success.

Exclusive Customer Landscape

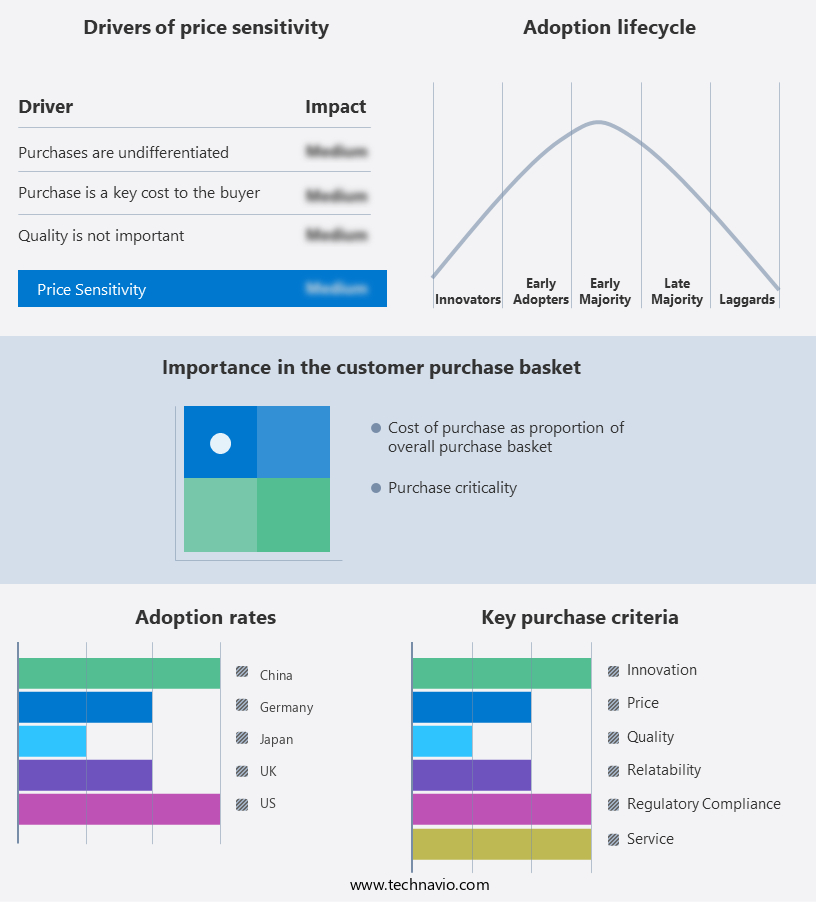
The direct carrier billing market forecasting report includes the adoption lifecycle of the market, covering from the innovator's stage to the laggard's stage. It focuses on adoption rates in different regions based on penetration. Furthermore, the direct carrier billing market report also includes key purchase criteria and drivers of price sensitivity to help companies evaluate and develop their market growth analysis strategies.

Direct Carrier Billing Market Share by Geography

 Customer Landscape

Key Companies & Market Insights

Companies are implementing various strategies, such as strategic alliances, direct carrier billing market forecast, partnerships, mergers and acquisitions, geographical expansion, and product/service launches, to enhance their presence in the industry.

Amdocs Ltd. - This company specializes in providing direct carrier billing solutions for app stores and digital content, enabling seamless integration into customers' mobile bills.

The industry research and growth report includes detailed analyses of the competitive landscape of the market and information about key companies, including:

  • Amdocs Ltd.
  • AT and T Inc.
  • Bango Plc
  • BCE Inc.
  • Boku Inc.
  • Centili Ltd.
  • Deutsche Telekom AG
  • Digital Virgo
  • DIMOCO Carrier Billing GmbH
  • LINK Mobility Group Holding ASA
  • Nippon Telegraph and Telephone Corp.
  • Orange SA
  • RGK Mobile
  • Singapore Telecommunications Ltd.
  • SLA Digital
  • Swisscom Ltd.
  • Telenor Group

Qualitative and quantitative analysis of companies has been conducted to help clients understand the wider business environment as well as the strengths and weaknesses of key industry players. Data is qualitatively analyzed to categorize companies as pure play, category-focused, industry-focused, and diversified; it is quantitatively analyzed to categorize companies as dominant, leading, strong, tentative, and weak.

Recent Development and News in Direct Carrier Billing Market

  • In January 2024, global telecommunications giant Vodafone Group announced the expansion of its Direct Carrier Billing (DCB) service to 15 new markets, including Indonesia, Mexico, and South Africa. This move aimed to increase the reach of its DCB offering and cater to the growing demand for convenient digital payments in these regions (Vodafone Group Press Release, 2024).
  • In March 2024, mobile payment platform, Mobikwik, partnered with leading mobile operator, Airtel Africa, to offer Direct Carrier Billing for its services across seven African countries. This collaboration aimed to provide Mobikwik users with a more convenient and accessible payment option, particularly in areas with limited banking infrastructure (Mobikwik Press Release, 2024).
  • In May 2024, fintech company, Paytm, raised a USD1 billion funding round led by Alibaba Group and Ant Financial. A significant portion of the funds was earmarked for expanding Paytm's Direct Carrier Billing services, which had already seen significant growth in India (Paytm Press Release, 2024).
  • In February 2025, the European Union's Revised Payment Services Directive (PSD2) came into effect, mandating that telecom operators provide third-party providers access to their billing systems for payment initiation services. This regulatory change opened up new opportunities for Direct Carrier Billing in Europe, particularly for digital content providers and mobile payment platforms (European Parliament and Council of the European Union, 2025).

Research Analyst Overview

The market continues to evolve, driven by the increasing demand for seamless and convenient payment solutions across various sectors. Recurring billing and conversion optimization are key focus areas, with telecommunication providers offering global coverage and wallet integration to enhance user experience (UX). Operator billing, payment gateways, and security protocols form the technology stack for these platforms, ensuring real-time processing and fraud prevention. Customer segmentation, account management, and business models are essential components of carrier billing platforms, enabling telecoms to cater to diverse customer needs. Technical support, pricing models, and in-app purchases are integrated to optimize customer acquisition cost and increase conversion rates.

Mobile commerce, digital content delivery, and mobile marketing are primary applications of carrier billing. SDK integration and API integration facilitate seamless partnerships with third-party payment processors, enabling a wide range of payment solutions. Penetration rate, transaction fees, and data analytics are critical performance indicators for carrier billing platforms. Telecommunication providers undergo security audits and offer technical support to ensure the highest levels of security and reliability. Churn rate, batch processing, and customer lifetime value are essential metrics for telecoms to monitor and manage. Usability, pricing, and marketing automation are key factors influencing customer satisfaction and loyalty.

Payment aggregators, SMS billing, USSD billing, MMS billing, and IVR billing are additional features that expand the reach and versatility of carrier billing platforms. Reporting tools provide valuable insights into platform performance and customer behavior, enabling continuous improvement and innovation. This method is increasingly popular, especially among smartphone users who consume OTT (Over-The-Top) content such as games, music streaming, and video-on-demand services.

Dive into Technavio's robust research methodology, blending expert interviews, extensive data synthesis, and validated models for unparalleled Direct Carrier Billing Market insights. See full methodology.

Market Scope

Report Coverage

Details

Page number

229

Base year

2024

Historic period

2019-2023

Forecast period

2025-2029

Growth momentum & CAGR

Accelerate at a CAGR of 10.4%

Market growth 2025-2029

USD 28.9 billion

Market structure

Fragmented

YoY growth 2024-2025(%)

9.3

Key countries

US, China, India, Japan, Germany, South Korea, UK, France, Spain, and Canada

Competitive landscape

Leading Companies, Market Positioning of Companies, Competitive Strategies, and Industry Risks

Request Free Sample

What are the Key Data Covered in this Direct Carrier Billing Market Research and Growth Report?

  • CAGR of the Direct Carrier Billing industry during the forecast period
  • Detailed information on factors that will drive the growth and forecasting between 2025 and 2029
  • Precise estimation of the size of the market and its contribution of the industry in focus to the parent market
  • Accurate predictions about upcoming growth and trends and changes in consumer behaviour
  • Growth of the market across APAC, Europe, North America, South America, and Middle East and Africa
  • Thorough analysis of the market's competitive landscape and detailed information about companies
  • Comprehensive analysis of factors that will challenge the direct carrier billing market growth of industry companies

We can help! Our analysts can customize this direct carrier billing market research report to meet your requirements.

Get in touch

1 Executive Summary

  • 1.1 Market overview
    • Executive Summary - Chart on Market Overview
    • Executive Summary - Data Table on Market Overview
    • Executive Summary - Chart on Global Market Characteristics
    • Executive Summary - Chart on Market by Geography
    • Executive Summary - Chart on Market Segmentation by Platform
    • Executive Summary - Chart on Market Segmentation by Type
    • Executive Summary - Chart on Market Segmentation by End-user
    • Executive Summary - Chart on Incremental Growth
    • Executive Summary - Data Table on Incremental Growth
    • Executive Summary - Chart on Company Market Positioning

2 Technavio Analysis

  • 2.1 Analysis of price sensitivity, lifecycle, customer purchase basket, adoption rates, and purchase criteria
    • Analysis of price sensitivity, lifecycle, customer purchase basket, adoption rates, and purchase criteria
  • 2.2 Criticality of inputs and Factors of differentiation
    • Overview on criticality of inputs and factors of differentiation
  • 2.3 Factors of disruption
    • Overview on factors of disruption
  • 2.4 Impact of drivers and challenges
    • Impact of drivers and challenges in 2024 and 2029

3 Market Landscape

  • 3.1 Market ecosystem
    • Parent Market
    • Data Table on - Parent Market
  • 3.2 Market characteristics
    • Market characteristics analysis
  • 3.3 Value chain analysis
    • Value chain analysis

4 Market Sizing

  • 4.1 Market definition
    • Offerings of companies included in the market definition
  • 4.2 Market segment analysis
    • Market segments
  • 4.3 Market size 2024
    • 4.4 Market outlook: Forecast for 2024-2029
      • Chart on Global - Market size and forecast 2024-2029 ($ million)
      • Data Table on Global - Market size and forecast 2024-2029 ($ million)
      • Chart on Global Market: Year-over-year growth 2024-2029 (%)
      • Data Table on Global Market: Year-over-year growth 2024-2029 (%)

    5 Historic Market Size

    • 5.1 Global Direct Carrier Billing Market 2019 - 2023
      • Historic Market Size - Data Table on Global Direct Carrier Billing Market 2019 - 2023 ($ million)
    • 5.2 Platform segment analysis 2019 - 2023
      • Historic Market Size - Platform Segment 2019 - 2023 ($ million)
    • 5.3 Type segment analysis 2019 - 2023
      • Historic Market Size - Type Segment 2019 - 2023 ($ million)
    • 5.4 End-user segment analysis 2019 - 2023
      • Historic Market Size - End-user Segment 2019 - 2023 ($ million)
    • 5.5 Geography segment analysis 2019 - 2023
      • Historic Market Size - Geography Segment 2019 - 2023 ($ million)
    • 5.6 Country segment analysis 2019 - 2023
      • Historic Market Size - Country Segment 2019 - 2023 ($ million)

    6 Qualitative Analysis

    • 6.1 The AI impact on Global Direct Carrier Billing Market

      7 Five Forces Analysis

      • 7.1 Five forces summary
        • Five forces analysis - Comparison between 2024 and 2029
      • 7.2 Bargaining power of buyers
        • Bargaining power of buyers - Impact of key factors 2024 and 2029
      • 7.3 Bargaining power of suppliers
        • Bargaining power of suppliers - Impact of key factors in 2024 and 2029
      • 7.4 Threat of new entrants
        • Threat of new entrants - Impact of key factors in 2024 and 2029
      • 7.5 Threat of substitutes
        • Threat of substitutes - Impact of key factors in 2024 and 2029
      • 7.6 Threat of rivalry
        • Threat of rivalry - Impact of key factors in 2024 and 2029
      • 7.7 Market condition
        • Chart on Market condition - Five forces 2024 and 2029

      8 Market Segmentation by Platform

      • 8.1 Market segments
        • Chart on Platform - Market share 2024-2029 (%)
        • Data Table on Platform - Market share 2024-2029 (%)
      • 8.2 Comparison by Platform
        • Chart on Comparison by Platform
        • Data Table on Comparison by Platform
      • 8.3 Android - Market size and forecast 2024-2029
        • Chart on Android - Market size and forecast 2024-2029 ($ million)
        • Data Table on Android - Market size and forecast 2024-2029 ($ million)
        • Chart on Android - Year-over-year growth 2024-2029 (%)
        • Data Table on Android - Year-over-year growth 2024-2029 (%)
      • 8.4 Web-based platforms - Market size and forecast 2024-2029
        • Chart on Web-based platforms - Market size and forecast 2024-2029 ($ million)
        • Data Table on Web-based platforms - Market size and forecast 2024-2029 ($ million)
        • Chart on Web-based platforms - Year-over-year growth 2024-2029 (%)
        • Data Table on Web-based platforms - Year-over-year growth 2024-2029 (%)
      • 8.5 iOS - Market size and forecast 2024-2029
        • Chart on iOS - Market size and forecast 2024-2029 ($ million)
        • Data Table on iOS - Market size and forecast 2024-2029 ($ million)
        • Chart on iOS - Year-over-year growth 2024-2029 (%)
        • Data Table on iOS - Year-over-year growth 2024-2029 (%)
      • 8.6 Market opportunity by Platform
        • Market opportunity by Platform ($ million)
        • Data Table on Market opportunity by Platform ($ million)

      9 Market Segmentation by Type

      • 9.1 Market segments
        • Chart on Type - Market share 2024-2029 (%)
        • Data Table on Type - Market share 2024-2029 (%)
      • 9.2 Comparison by Type
        • Chart on Comparison by Type
        • Data Table on Comparison by Type
      • 9.3 Pure DCB - Market size and forecast 2024-2029
        • Chart on Pure DCB - Market size and forecast 2024-2029 ($ million)
        • Data Table on Pure DCB - Market size and forecast 2024-2029 ($ million)
        • Chart on Pure DCB - Year-over-year growth 2024-2029 (%)
        • Data Table on Pure DCB - Year-over-year growth 2024-2029 (%)
      • 9.4 OTP-based DCB - Market size and forecast 2024-2029
        • Chart on OTP-based DCB - Market size and forecast 2024-2029 ($ million)
        • Data Table on OTP-based DCB - Market size and forecast 2024-2029 ($ million)
        • Chart on OTP-based DCB - Year-over-year growth 2024-2029 (%)
        • Data Table on OTP-based DCB - Year-over-year growth 2024-2029 (%)
      • 9.5 PIN-based DCB - Market size and forecast 2024-2029
        • Chart on PIN-based DCB - Market size and forecast 2024-2029 ($ million)
        • Data Table on PIN-based DCB - Market size and forecast 2024-2029 ($ million)
        • Chart on PIN-based DCB - Year-over-year growth 2024-2029 (%)
        • Data Table on PIN-based DCB - Year-over-year growth 2024-2029 (%)
      • 9.6 Limited DCB - Market size and forecast 2024-2029
        • Chart on Limited DCB - Market size and forecast 2024-2029 ($ million)
        • Data Table on Limited DCB - Market size and forecast 2024-2029 ($ million)
        • Chart on Limited DCB - Year-over-year growth 2024-2029 (%)
        • Data Table on Limited DCB - Year-over-year growth 2024-2029 (%)
      • 9.7 Hybrid DCB - Market size and forecast 2024-2029
        • Chart on Hybrid DCB - Market size and forecast 2024-2029 ($ million)
        • Data Table on Hybrid DCB - Market size and forecast 2024-2029 ($ million)
        • Chart on Hybrid DCB - Year-over-year growth 2024-2029 (%)
        • Data Table on Hybrid DCB - Year-over-year growth 2024-2029 (%)
      • 9.8 Market opportunity by Type
        • Market opportunity by Type ($ million)
        • Data Table on Market opportunity by Type ($ million)

      10 Market Segmentation by End-user

      • 10.1 Market segments
        • Chart on End-user - Market share 2024-2029 (%)
        • Data Table on End-user - Market share 2024-2029 (%)
      • 10.2 Comparison by End-user
        • Chart on Comparison by End-user
        • Data Table on Comparison by End-user
      • 10.3 Apps and games - Market size and forecast 2024-2029
        • Chart on Apps and games - Market size and forecast 2024-2029 ($ million)
        • Data Table on Apps and games - Market size and forecast 2024-2029 ($ million)
        • Chart on Apps and games - Year-over-year growth 2024-2029 (%)
        • Data Table on Apps and games - Year-over-year growth 2024-2029 (%)
      • 10.4 Online media - Market size and forecast 2024-2029
        • Chart on Online media - Market size and forecast 2024-2029 ($ million)
        • Data Table on Online media - Market size and forecast 2024-2029 ($ million)
        • Chart on Online media - Year-over-year growth 2024-2029 (%)
        • Data Table on Online media - Year-over-year growth 2024-2029 (%)
      • 10.5 Others - Market size and forecast 2024-2029
        • Chart on Others - Market size and forecast 2024-2029 ($ million)
        • Data Table on Others - Market size and forecast 2024-2029 ($ million)
        • Chart on Others - Year-over-year growth 2024-2029 (%)
        • Data Table on Others - Year-over-year growth 2024-2029 (%)
      • 10.6 Market opportunity by End-user
        • Market opportunity by End-user ($ million)
        • Data Table on Market opportunity by End-user ($ million)

      11 Customer Landscape

      • 11.1 Customer landscape overview
        • Analysis of price sensitivity, lifecycle, customer purchase basket, adoption rates, and purchase criteria

      12 Geographic Landscape

      • 12.1 Geographic segmentation
        • Chart on Market share by geography 2024-2029 (%)
        • Data Table on Market share by geography 2024-2029 (%)
      • 12.2 Geographic comparison
        • Chart on Geographic comparison
        • Data Table on Geographic comparison
      • 12.3 APAC - Market size and forecast 2024-2029
        • Chart on APAC - Market size and forecast 2024-2029 ($ million)
        • Data Table on APAC - Market size and forecast 2024-2029 ($ million)
        • Chart on APAC - Year-over-year growth 2024-2029 (%)
        • Data Table on APAC - Year-over-year growth 2024-2029 (%)
      • 12.4 Europe - Market size and forecast 2024-2029
        • Chart on Europe - Market size and forecast 2024-2029 ($ million)
        • Data Table on Europe - Market size and forecast 2024-2029 ($ million)
        • Chart on Europe - Year-over-year growth 2024-2029 (%)
        • Data Table on Europe - Year-over-year growth 2024-2029 (%)
      • 12.5 North America - Market size and forecast 2024-2029
        • Chart on North America - Market size and forecast 2024-2029 ($ million)
        • Data Table on North America - Market size and forecast 2024-2029 ($ million)
        • Chart on North America - Year-over-year growth 2024-2029 (%)
        • Data Table on North America - Year-over-year growth 2024-2029 (%)
      • 12.6 South America - Market size and forecast 2024-2029
        • Chart on South America - Market size and forecast 2024-2029 ($ million)
        • Data Table on South America - Market size and forecast 2024-2029 ($ million)
        • Chart on South America - Year-over-year growth 2024-2029 (%)
        • Data Table on South America - Year-over-year growth 2024-2029 (%)
      • 12.7 Middle East and Africa - Market size and forecast 2024-2029
        • Chart on Middle East and Africa - Market size and forecast 2024-2029 ($ million)
        • Data Table on Middle East and Africa - Market size and forecast 2024-2029 ($ million)
        • Chart on Middle East and Africa - Year-over-year growth 2024-2029 (%)
        • Data Table on Middle East and Africa - Year-over-year growth 2024-2029 (%)
      • 12.8 US - Market size and forecast 2024-2029
        • Chart on US - Market size and forecast 2024-2029 ($ million)
        • Data Table on US - Market size and forecast 2024-2029 ($ million)
        • Chart on US - Year-over-year growth 2024-2029 (%)
        • Data Table on US - Year-over-year growth 2024-2029 (%)
      • 12.9 China - Market size and forecast 2024-2029
        • Chart on China - Market size and forecast 2024-2029 ($ million)
        • Data Table on China - Market size and forecast 2024-2029 ($ million)
        • Chart on China - Year-over-year growth 2024-2029 (%)
        • Data Table on China - Year-over-year growth 2024-2029 (%)
      • 12.10 India - Market size and forecast 2024-2029
        • Chart on India - Market size and forecast 2024-2029 ($ million)
        • Data Table on India - Market size and forecast 2024-2029 ($ million)
        • Chart on India - Year-over-year growth 2024-2029 (%)
        • Data Table on India - Year-over-year growth 2024-2029 (%)
      • 12.11 Japan - Market size and forecast 2024-2029
        • Chart on Japan - Market size and forecast 2024-2029 ($ million)
        • Data Table on Japan - Market size and forecast 2024-2029 ($ million)
        • Chart on Japan - Year-over-year growth 2024-2029 (%)
        • Data Table on Japan - Year-over-year growth 2024-2029 (%)
      • 12.12 Germany - Market size and forecast 2024-2029
        • Chart on Germany - Market size and forecast 2024-2029 ($ million)
        • Data Table on Germany - Market size and forecast 2024-2029 ($ million)
        • Chart on Germany - Year-over-year growth 2024-2029 (%)
        • Data Table on Germany - Year-over-year growth 2024-2029 (%)
      • 12.13 UK - Market size and forecast 2024-2029
        • Chart on UK - Market size and forecast 2024-2029 ($ million)
        • Data Table on UK - Market size and forecast 2024-2029 ($ million)
        • Chart on UK - Year-over-year growth 2024-2029 (%)
        • Data Table on UK - Year-over-year growth 2024-2029 (%)
      • 12.14 South Korea - Market size and forecast 2024-2029
        • Chart on South Korea - Market size and forecast 2024-2029 ($ million)
        • Data Table on South Korea - Market size and forecast 2024-2029 ($ million)
        • Chart on South Korea - Year-over-year growth 2024-2029 (%)
        • Data Table on South Korea - Year-over-year growth 2024-2029 (%)
      • 12.15 France - Market size and forecast 2024-2029
        • Chart on France - Market size and forecast 2024-2029 ($ million)
        • Data Table on France - Market size and forecast 2024-2029 ($ million)
        • Chart on France - Year-over-year growth 2024-2029 (%)
        • Data Table on France - Year-over-year growth 2024-2029 (%)
      • 12.16 Canada - Market size and forecast 2024-2029
        • Chart on Canada - Market size and forecast 2024-2029 ($ million)
        • Data Table on Canada - Market size and forecast 2024-2029 ($ million)
        • Chart on Canada - Year-over-year growth 2024-2029 (%)
        • Data Table on Canada - Year-over-year growth 2024-2029 (%)
      • 12.17 Spain - Market size and forecast 2024-2029
        • Chart on Spain - Market size and forecast 2024-2029 ($ million)
        • Data Table on Spain - Market size and forecast 2024-2029 ($ million)
        • Chart on Spain - Year-over-year growth 2024-2029 (%)
        • Data Table on Spain - Year-over-year growth 2024-2029 (%)
      • 12.18 Market opportunity by geography
        • Market opportunity by geography ($ million)
        • Data Tables on Market opportunity by geography ($ million)

      13 Drivers, Challenges, and Opportunity/Restraints

      • 13.1 Market drivers
        • 13.2 Market challenges
          • 13.3 Impact of drivers and challenges
            • Impact of drivers and challenges in 2024 and 2029
          • 13.4 Market opportunities/restraints

            14 Competitive Landscape

            • 14.1 Overview
              • 14.2 Competitive Landscape
                • Overview on criticality of inputs and factors of differentiation
              • 14.3 Landscape disruption
                • Overview on factors of disruption
              • 14.4 Industry risks
                • Impact of key risks on business

              15 Competitive Analysis

              • 15.1 Companies profiled
                • Companies covered
              • 15.2 Company ranking index
                • Company ranking index
              • 15.3 Market positioning of companies
                • Matrix on companies position and classification
              • 15.4 AT and T Inc.
                • AT and T Inc. - Overview
                • AT and T Inc. - Business segments
                • AT and T Inc. - Key news
                • AT and T Inc. - Key offerings
                • AT and T Inc. - Segment focus
                • SWOT
              • 15.5 Bango Plc
                • Bango Plc - Overview
                • Bango Plc - Product / Service
                • Bango Plc - Key offerings
                • SWOT
              • 15.6 BCE Inc.
                • BCE Inc. - Overview
                • BCE Inc. - Product / Service
                • BCE Inc. - Key news
                • BCE Inc. - Key offerings
                • SWOT
              • 15.7 Boku Inc.
                • Boku Inc. - Overview
                • Boku Inc. - Product / Service
                • Boku Inc. - Key offerings
                • SWOT
              • 15.8 Centili Ltd.
                • Centili Ltd. - Overview
                • Centili Ltd. - Product / Service
                • Centili Ltd. - Key offerings
                • SWOT
              • 15.9 Deutsche Telekom AG
                • Deutsche Telekom AG - Overview
                • Deutsche Telekom AG - Business segments
                • Deutsche Telekom AG - Key offerings
                • Deutsche Telekom AG - Segment focus
                • SWOT
              • 15.10 Digital Virgo
                • Digital Virgo - Overview
                • Digital Virgo - Product / Service
                • Digital Virgo - Key offerings
                • SWOT
              • 15.11 DIMOCO Carrier Billing GmbH
                • DIMOCO Carrier Billing GmbH - Overview
                • DIMOCO Carrier Billing GmbH - Product / Service
                • DIMOCO Carrier Billing GmbH - Key offerings
                • SWOT
              • 15.12 LINK Mobility Group Holding ASA
                • LINK Mobility Group Holding ASA - Overview
                • LINK Mobility Group Holding ASA - Business segments
                • LINK Mobility Group Holding ASA - Key offerings
                • LINK Mobility Group Holding ASA - Segment focus
                • SWOT
              • 15.13 Nippon Telegraph and Telephone Corp.
                • Nippon Telegraph and Telephone Corp. - Overview
                • Nippon Telegraph and Telephone Corp. - Business segments
                • Nippon Telegraph and Telephone Corp. - Key offerings
                • Nippon Telegraph and Telephone Corp. - Segment focus
                • SWOT
              • 15.14 Orange SA
                • Orange SA - Overview
                • Orange SA - Product / Service
                • Orange SA - Key offerings
                • SWOT
              • 15.15 RGK Mobile
                • RGK Mobile - Overview
                • RGK Mobile - Product / Service
                • RGK Mobile - Key offerings
                • SWOT
              • 15.16 Singapore Telecommunications Ltd.
                • Singapore Telecommunications Ltd. - Overview
                • Singapore Telecommunications Ltd. - Business segments
                • Singapore Telecommunications Ltd. - Key offerings
                • Singapore Telecommunications Ltd. - Segment focus
                • SWOT
              • 15.17 SLA Digital
                • SLA Digital - Overview
                • SLA Digital - Product / Service
                • SLA Digital - Key offerings
                • SWOT
              • 15.18 Swisscom Ltd.
                • Swisscom Ltd. - Overview
                • Swisscom Ltd. - Product / Service
                • Swisscom Ltd. - Key offerings
                • SWOT

              16 Appendix

              • 16.1 Scope of the report
                • 16.2 Inclusions and exclusions checklist
                  • Inclusions checklist
                  • Exclusions checklist
                • 16.3 Currency conversion rates for US$
                  • Currency conversion rates for US$
                • 16.4 Research methodology
                  • Research methodology
                • 16.5 Data procurement
                  • Information sources
                • 16.6 Data validation
                  • Data validation
                • 16.7 Validation techniques employed for market sizing
                  • Validation techniques employed for market sizing
                • 16.8 Data synthesis
                  • Data synthesis
                • 16.9 360 degree market analysis
                  • 360 degree market analysis
                • 16.10 List of abbreviations
                  • List of abbreviations

                Research Methodology

                Technavio presents a detailed picture of the market by way of study, synthesis, and summation of data from multiple sources. The analysts have presented the various facets of the market with a particular focus on identifying the key industry influencers. The data thus presented is comprehensive, reliable, and the result of extensive research, both primary and secondary.

                INFORMATION SOURCES

                Primary sources

                • Manufacturers and suppliers
                • Channel partners
                • Industry experts
                • Strategic decision makers

                Secondary sources

                • Industry journals and periodicals
                • Government data
                • Financial reports of key industry players
                • Historical data
                • Press releases

                DATA ANALYSIS

                Data Synthesis

                • Collation of data
                • Estimation of key figures
                • Analysis of derived insights

                Data Validation

                • Triangulation with data models
                • Reference against proprietary databases
                • Corroboration with industry experts

                REPORT WRITING

                Qualitative

                • Market drivers
                • Market challenges
                • Market trends
                • Five forces analysis

                Quantitative

                • Market size and forecast
                • Market segmentation
                • Geographical insights
                • Competitive landscape

                Interested in this report?

                Get your sample now to see our research methodology and insights!

                Download Now

                Frequently Asked Questions

                Direct Carrier Billing market growth will increase by $ 28896.5 mn during 2025-2029 .

                The Direct Carrier Billing market is expected to grow at a CAGR of 10.4% during 2025-2029 .

                Direct Carrier Billing market is segmented by Platform( Android, Web-based platforms, iOS) Type( Pure DCB, OTP-based DCB, PIN-based DCB, Limited DCB, Hybrid DCB) End-user( Apps and games, Online media, Others)

                Amdocs Ltd., AT and T Inc., Bango Plc, BCE Inc., Boku Inc., Centili Ltd., Deutsche Telekom AG, Digital Virgo, DIMOCO Carrier Billing GmbH, LINK Mobility Group Holding ASA, Nippon Telegraph and Telephone Corp., Orange SA, RGK Mobile, Singapore Telecommunications Ltd., SLA Digital, Swisscom Ltd., Telenor Group are a few of the key vendors in the Direct Carrier Billing market.

                APAC will register the highest growth rate of 43% among the other regions. Therefore, the Direct Carrier Billing market in APAC is expected to garner significant business opportunities for the vendors during the forecast period.

                US, China, India, Japan, Germany, South Korea, UK, France, Spain, Canada

                • Increasing consumers for digital contentThe global DCB market is influenced by the increasing number of consumers preferring digital content. DCB permits wireless subscribers of telecommunication networks to consume digital content through the Internet is the driving factor this market.
                • thereby creating a convenient mode of payment by placing the cost of consumption on phone bills. DCB services also provide other benefits is the driving factor this market.
                • which deliver reliable experience of buying digital goods. Therefore is the driving factor this market.
                • the growth of the market is driven by the increasing number of digital consumers. The increased preference of consumers for online media is due to the presence of several digital formats. The rise in the number of portable devices that promote digital media and the increasing speed of the Internet offer consumers several choices to access digital content like news is the driving factor this market.
                • entertainment is the driving factor this market.
                • and social networking at their convenience.Digitalization and Internet penetration results in the rising rate of digital consumption. For instance is the driving factor this market.
                • the growth of digital media players such as Amazon Prime Video is the driving factor this market.
                • Netflix is the driving factor this market.
                • Apple TV is the driving factor this market.
                • Hulu is the driving factor this market.
                • Roku is the driving factor this market.
                • and Boxee are increasingly preferred to television as the primary entertainment source. Also is the driving factor this market.
                • the console gaming market has an increased number of online gamers than offline gamers. Major players in the global DCB market are increasingly focused on associating with multiple developers and producers of online content to provide hassle-free payment services to users. Thus is the driving factor this market.
                • the globally rising number of consumers for digital goods is expected to significantly drive the growth of the global DCB market during the forecast period. is the driving factor this market.

                The Direct Carrier Billing market vendors should focus on grabbing business opportunities from the Android segment as it accounted for the largest market share in the base year.