Dried Grapes Market Analysis North America, APAC, Europe, South America, Middle East and Africa - US, China, Germany, UK, Japan, Canada, India, France, Australia, Brazil - Size and Forecast 2024-2028

Dried Grapes Market Analysis North America, APAC, Europe, South America, Middle East and Africa - US, China, Germany, UK, Japan, Canada, India, France, Australia, Brazil - Size and Forecast 2024-2028

Published: Nov 2024 175 Pages SKU: IRTNTR74118

Market Overview at a Glance

$429.1 Mn
Market Opportunity
5.2%
CAGR
4.8
YoY growth 2023-2024(%)

Dried Grapes Market Size and Trends

The dried grapes market size is forecast to increase by USD 429.1 million, at a CAGR of 5.2% between 2023 and 2028. The market is experiencing significant growth due to various factors. The rise of functional foods and superfoods has led to increased demand for dried grapes as they are rich in essential nutrients and antioxidants. Energy bites and smoothies, which are popular functional food options, frequently include dried grapes as an ingredient. Additionally, the trend toward healthy confectionery and organic food has fueled the market's growth. Consumers' preferences for convenience have also influenced the market, with the popularity of bagged and canned dried grapes increasing. The organized retail sector's expansion and the growing effectiveness of online shopping have made it easier for consumers to access these products. However, the market faces challenges such as climate change, which can negatively impact grape yields and, consequently, the availability and price of dried grapes. In conclusion, the market is witnessing growth due to the increasing popularity of functional foods and superfoods, the trend towards healthy eating, and the convenience offered by packaged products. However, the market is also facing challenges such as the impact of climate change on grape production.

Dried Grapes Market Size

 Request Free Sample

The market encompasses various types of dried grapes, including raisins, currants, and sultanas. These dried fruits are widely used in the food processing industry for producing baked goods, cereals, natural sweeteners, and snack bars. Dried grapes offer numerous health benefits, making them a popular choice among health-conscious consumers. Domestic production of dried grapes in the US contributes significantly to the market, but imports also play a crucial role in meeting the demand. The primary imported dried grapes include raisins, currants, and sultanas, mostly from countries like Turkey, Greece, and Iran. Dried grapes undergo different processes such as sun-drying, air-drying, and dehydration using a dehydrator. These processes preserve the fruit and enhance their shelf life. However, some dried grapes are treated with sulphur dioxide and vegetable oil or sugar content to prevent discoloration and extend their shelf life.

Organic raisins, currants, and sultanas are gaining popularity due to the increasing demand for ethically sourced and environmentally friendly food products. These organic dried grapes are free from synthetic additives and are produced using sustainable farming practices. Antioxidants, fiber, and essential nutrients are some of the key health benefits associated with dried grapes. These nutrients contribute to the overall health of consumers and make dried grapes a popular ingredient in the health food market. The food processing industry is a significant consumer of dried grapes, using them in various applications such as baked goods, cereals, and snack bars. Chocolate-covered raisins are a popular snack, while raisins and sultanas are commonly used in breakfast cereals. In conclusion, the market is driven by the increasing demand for healthier food options and the versatility of dried grapes in various food applications. The market is expected to grow steadily, offering opportunities for businesses in the food processing industry.

Market Segmentation

The market research report provides comprehensive data (region-wise segment analysis), with forecasts and estimates in "USD million" for the period 2024-2028, as well as historical data from 2018 - 2022 for the following segments.

  • Packaging
    • Bagged
    • Canned
  • Type
    • Raisins
    • Sultanas
    • Currants
  • Geography
    • North America
      • Canada
      • US
    • APAC
      • China
      • India
      • Japan
    • Europe
      • Germany
      • UK
      • France
    • South America
      • Brazil
    • Middle East and Africa

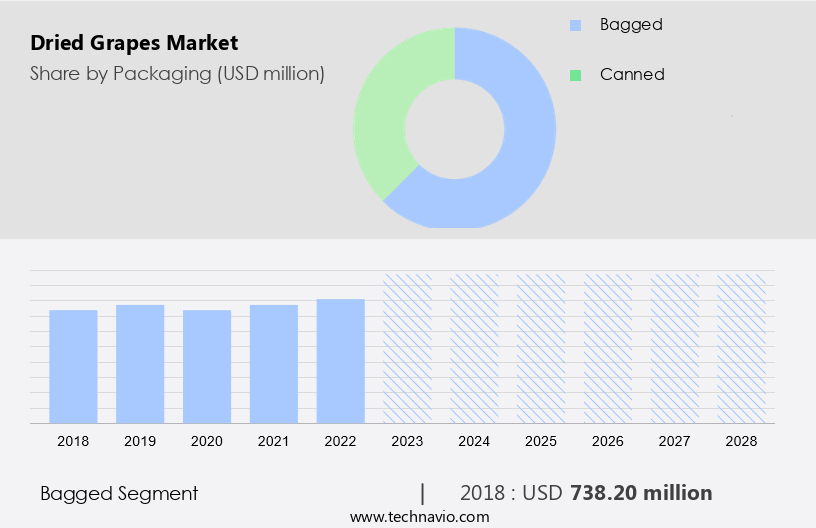
By Packaging Insights

The bagged segment is estimated to witness significant growth during the forecast period. Dried grapes are a popular snack and ingredient in various baked goods and cereals. Proper processing and packaging are crucial to maintain their quality and extend their shelf life. The drying process involves either sun-drying or air-drying, followed by cooling and immediate packaging. Warm grapes can cause sweating, which may lead to mold growth.

Dried Grapes Market Size

Get a glance at the market share of various segment Download the PDF Sample


The bagged segment was valued at USD 738.20 million in 2018.  Packaging should be in dry, clean, and insect-proof containers, ensuring a tight fit without crushing. The choice of packaging depends on the type of dried grapes. Bags and plastic boxes are common options, with bags providing better breathability for some varieties. Effective packaging preserves the nutrients and sugar content, ensuring the best possible product for consumers in physiotherapy clinics and other markets. In the US, dried grapes are used extensively in various industries, including food manufacturing and healthcare.

Regional Analysis

Dried Grapes Market Share by Geography

For more insights on the market share of various regions Download PDF Sample now!

APAC is estimated to contribute 32% to the growth of the global market during the forecast period. Technavio's analysts have elaborately explained the regional trends and drivers that shape the market during the forecast period. The North American market is a significant player in the global market, with key contributors being the United States, Canada, and Mexico. In 2023, North America accounted for a substantial share in global grape exports, with the US exporting approximately USD 768.4 million worth of grapes. California, Washington, and New York are major grape-producing states in the US. The increasing consumer preference for health-conscious, packaged, and ready-to-eat products in North America is fueling the growth of the market. These grapes offer numerous health benefits, such as reducing the risk of blood clots and lowering LDL cholesterol levels. The market is fragmented, with various vendors operating. In the health food market, clean-label products and nutritional labeling are essential. Social media and food bloggers play a crucial role in promoting dried grapes as a healthy snack option. Dried grapes are rich in antioxidants, fiber, and essential nutrients, making them a popular choice among health-conscious consumers.

Our researchers analyzed the data with 2023 as the base year, along with the key drivers, trends, and challenges. A holistic analysis of drivers will help companies refine their marketing strategies to gain a competitive advantage.

Dried Grapes Market Driver

The growth of the organized retail sector is notably driving market growth. Dried grapes are widely used in food processing, particularly in the production of snack bars and breakfast cereals. These natural sweeteners offer numerous nutritional benefits and are increasingly preferred as ethically sourced, plant-based snack options. Sustainable snacking is a growing trend, and dried grapes align perfectly with this movement due to their environmentally friendly production methods. The rise of organized retailing in these channels simplifies the purchasing process for consumers and provides a diverse selection of dried grape options. Private-label dried grapes from these retailers are gaining popularity, contributing to the market's growth. Consumers are increasingly drawn to the convenience and cost savings offered by these products. Additionally, the demand for natural, plant-based snacks continues to rise, making dried grapes an attractive choice for both retailers and consumers.

To cater to the growing demand, companies need to focus on sustainable and ethical sourcing practices. This not only appeals to consumers' values but also ensures a steady supply of high-quality dried grapes. By prioritizing these factors, businesses can position themselves as industry leaders and maintain a competitive edge in the market. In conclusion, the dried grapes market is poised for growth, driven by increasing consumer demand for natural, plant-based snacks and the convenience offered by organized retailers. Companies that prioritize sustainable and ethical sourcing practices will be well-positioned to capitalize on this trend and meet the evolving needs of health-conscious consumers. Thus, such factors are driving the growth of the market during the forecast period.

Dried Grapes Market Trends

The growing prominence of online shopping is the key trend in the market. The market has experienced substantial growth over the past decade, with online distribution channels, or e-commerce, playing a pivotal role in its expansion. E-commerce platforms provide consumers with access to a wide range of dried grape brands from various regions and countries. The proliferation of e-commerce vendors worldwide is driven by the rising penetration of smartphones.

Major online retailers of dried grapes include Amazon.com, Alibaba Inc., and eBay Inc. These platforms offer personalized shopping experiences and recommendations, making online shopping a convenient option for consumers. The convenience and benefits of online shopping have contributed to the market's growth, making it an essential sector for businesses and consumers alike. Thus, such trends will shape the growth of the market during the forecast period.

Dried Grapes Market Challenge

The effect of climate change on grape yield is the major challenge that affects the growth of the market. The market faces a significant challenge due to the impact of climate change on grape cultivation. Extreme temperatures and water scarcity can adversely affect grape production, leading to lower yields. For instance, increasing heat, insufficient water, and solar radiation have been observed to negatively influence grape harvests. Moreover, climate change can lead to an increase in pests and diseases in grape plants, further reducing yields. These factors can significantly impact the supply of dried grapes in the market.

As functional foods and superfoods gain popularity, the demand for dried grapes as ingredients in energy bites, smoothies, and healthy confectionery continues to rise. Organic dried grapes are also in high demand in the organic food sector. In market, dried grapes are available in various forms, including bagged and canned. Hence, the above factors will impede the growth of the market during the forecast period.

Exclusive Customer Landscape

The market forecasting report includes the adoption lifecycle of the market, covering from the innovator's stage to the laggard's stage. It focuses on adoption rates in different regions based on penetration. Furthermore, the report also includes key purchase criteria and drivers of price sensitivity to help companies evaluate and develop their market growth analysis strategies.

Dried Grapes Market Share by Geography

 Customer Landscape

Key Companies & Market Insights

Companies are implementing various strategies, such as strategic alliances, partnerships, mergers and acquisitions, geographical expansion, and product/service launches, to enhance their presence in the market.

Aarav Agro Industries - The company offers dried grapes that include golden raisins, black raisins, malayer raisins, dark brown raisins.

The market research and growth report also includes detailed analyses of the competitive landscape of the market and information about key companies, including:

  • Del Monte Foods Inc.
  • Dole Packaged Foods LLC
  • Gauri Farm
  • HBS Foods Ltd.
  • Lakshmi Narasimha Agencies
  • Mariana Co
  • National Raisin Co.
  • Newmans Own Inc.
  • River Ranch Sales Ltd.
  • Shivam Cashew Industry
  • Sun Maid Growers of California
  • SUN VALLEY RAISINS
  • Sunbeam Foods
  • Tabletop Grapes
  • Traina Dried Fruit Inc.
  • TRV Cashews
  • UAB Arimex
  • Vishaka Raisins VeravalOnline Pvt. Ltd.

Qualitative and quantitative analysis of companies has been conducted to help clients understand the wider business environment as well as the strengths and weaknesses of key market players. Data is qualitatively analyzed to categorize companies as pure play, category-focused, industry-focused, and diversified; it is quantitatively analyzed to categorize companies as dominant, leading, strong, tentative, and weak.

 Dried grapes, also known as raisins, currants, and sultanas, are popular dried fruits enjoyed for their sweet taste and numerous health benefits. The dried grape market encompasses various types, including raisins, currants, and sultanas, which undergo sun-drying or air-drying processes. Dried grapes are used as snacks, in baked goods, cereals, and natural sweeteners. Domestic production and imports play a significant role in the dried fruit market. Dried grapes are often imported due to seasonality and perishability. Sulphur dioxide and vegetable oil may be used during the drying process to preserve the fruit and enhance its color. Health-conscious consumers are increasingly seeking out organic dried grapes, free from added sugars and preservatives. The natural sweetness of dried grapes makes them an attractive alternative to conventional snacking products, including chocolate-covered raisins and other sugary treats.

The dried grape market is influenced by trends in the health food market, with a focus on clean-label products, nutritional labeling, and ethically sourced and sustainable snacking options. Social media and food bloggers contribute to the market's growth by promoting the nutritional benefits of dried grapes, including their antioxidant properties, fiber content, and essential nutrients. Functional foods, superfoods, energy bites, and smoothies are popular applications for dried grapes in the health food market. The dried fruit's natural sweetness and nutritional benefits make it an attractive ingredient for snack bars, breakfast cereals, and healthy confectionery. The organic food market's growth is expected to drive the demand for organic dried grapes in the coming years.

Market Scope

Report Coverage

Details

Page number

175

Base year

2023

Historic period

2018 - 2022

Forecast period

2024-2028

Growth momentum & CAGR

Accelerate at a CAGR of 5.2%

Market Growth 2024-2028

USD 429.1 million

Market structure

Fragmented

YoY growth 2023-2024(%)

4.8

Regional analysis

North America, APAC, Europe, South America, and Middle East and Africa

Performing market contribution

APAC at 32%

Key countries

US, China, Germany, UK, Japan, Canada, India, France, Australia, and Brazil

Competitive landscape

Leading Companies, Market Positioning of Companies, Competitive Strategies, and Industry Risks

Key companies profiled

Aarav Agro Industries, Del Monte Foods Inc., Dole Packaged Foods LLC, Gauri Farm, HBS Foods Ltd., Lakshmi Narasimha Agencies, Mariana Co, National Raisin Co., Newmans Own Inc., River Ranch Sales Ltd., Shivam Cashew Industry, Sun Maid Growers of California, SUN VALLEY RAISINS, Sunbeam Foods, Tabletop Grapes, Traina Dried Fruit Inc., TRV Cashews, UAB Arimex, and Vishaka Raisins VeravalOnline Pvt. Ltd.

Market dynamics

Parent market analysis, Market growth inducers and obstacles, Fast-growing and slow-growing segment analysis, COVID-19 impact and recovery analysis and future consumer dynamics, Market condition analysis for market forecast period.

Customization purview

If our market report has not included the data that you are looking for, you can reach out to our analysts and get segments customized.

Download PDF Sample

What are the Key Data Covered in this Market Research Report?

  • CAGR of the market during the forecast period
  • Detailed information on factors that will drive the market growth and forecasting between 2024 and 2028
  • Precise estimation of the size of the market  and its contribution of the market in focus to the parent market
  • Accurate predictions about upcoming market growth and trends and changes in consumer behaviour
  • Growth of the market across North America, APAC, Europe, South America, and Middle East and Africa
  • Thorough analysis of the market's competitive landscape and detailed information about companies
  • Comprehensive analysis of factors that will challenge the growth of market companies

We can help! Our analysts can customize this market research report to meet your requirements. Get in touch

1 Executive Summary

  • 1.1 Market overview
    • Executive Summary - Chart on Market Overview
    • Executive Summary - Data Table on Market Overview
    • Executive Summary - Chart on Global Market Characteristics
    • Executive Summary - Chart on Market by Geography
    • Executive Summary - Chart on Market Segmentation by Packaging
    • Executive Summary - Chart on Market Segmentation by Type
    • Executive Summary - Chart on Incremental Growth
    • Executive Summary - Data Table on Incremental Growth
    • Executive Summary - Chart on Company Market Positioning

2 Technavio Analysis

  • 2.1 Analysis of price sensitivity, lifecycle, customer purchase basket, adoption rates, and purchase criteria
    • Analysis of price sensitivity, lifecycle, customer purchase basket, adoption rates, and purchase criteria
  • 2.2 Criticality of inputs and Factors of differentiation
    • Overview on criticality of inputs and factors of differentiation
  • 2.3 Factors of disruption
    • Overview on factors of disruption
  • 2.4 Impact of drivers and challenges
    • Impact of drivers and challenges in 2023 and 2028

3 Market Landscape

  • 3.1 Market ecosystem
    • Parent Market
    • Data Table on - Parent Market
  • 3.2 Market characteristics
    • Market characteristics analysis
  • 3.3 Value chain analysis
    • Value Chain Analysis

4 Market Sizing

  • 4.1 Market definition
    • Offerings of companies included in the market definition
  • 4.2 Market segment analysis
    • Market segments
  • 4.3 Market size 2023
    • 4.4 Market outlook: Forecast for 2023-2028
      • Chart on Global - Market size and forecast 2023-2028 ($ million)
      • Data Table on Global - Market size and forecast 2023-2028 ($ million)
      • Chart on Global Market: Year-over-year growth 2023-2028 (%)
      • Data Table on Global Market: Year-over-year growth 2023-2028 (%)

    5 Historic Market Size

    • 5.1 Global Dried Grapes Market 2018 - 2022
      • Historic Market Size - Data Table on Global Dried Grapes Market 2018 - 2022 ($ million)
    • 5.2 Packaging segment analysis 2018 - 2022
      • Historic Market Size - Packaging Segment 2018 - 2022 ($ million)
    • 5.3 Type segment analysis 2018 - 2022
      • Historic Market Size - Type Segment 2018 - 2022 ($ million)
    • 5.4 Geography segment analysis 2018 - 2022
      • Historic Market Size - Geography Segment 2018 - 2022 ($ million)
    • 5.5 Country segment analysis 2018 - 2022
      • Historic Market Size - Country Segment 2018 - 2022 ($ million)

    6 Qualitative Analysis

    • 6.1 The AI impact on Global Dried Grapes Market

      7 Five Forces Analysis

      • 7.1 Five forces summary
        • Five forces analysis - Comparison between 2023 and 2028
      • 7.2 Bargaining power of buyers
        • Bargaining power of buyers - Impact of key factors 2023 and 2028
      • 7.3 Bargaining power of suppliers
        • Bargaining power of suppliers - Impact of key factors in 2023 and 2028
      • 7.4 Threat of new entrants
        • Threat of new entrants - Impact of key factors in 2023 and 2028
      • 7.5 Threat of substitutes
        • Threat of substitutes - Impact of key factors in 2023 and 2028
      • 7.6 Threat of rivalry
        • Threat of rivalry - Impact of key factors in 2023 and 2028
      • 7.7 Market condition
        • Chart on Market condition - Five forces 2023 and 2028

      8 Market Segmentation by Packaging

      • 8.1 Market segments
        • Chart on Packaging - Market share 2023-2028 (%)
        • Data Table on Packaging - Market share 2023-2028 (%)
      • 8.2 Comparison by Packaging
        • Chart on Comparison by Packaging
        • Data Table on Comparison by Packaging
      • 8.3 Bagged - Market size and forecast 2023-2028
        • Chart on Bagged - Market size and forecast 2023-2028 ($ million)
        • Data Table on Bagged - Market size and forecast 2023-2028 ($ million)
        • Chart on Bagged - Year-over-year growth 2023-2028 (%)
        • Data Table on Bagged - Year-over-year growth 2023-2028 (%)
      • 8.4 Canned - Market size and forecast 2023-2028
        • Chart on Canned - Market size and forecast 2023-2028 ($ million)
        • Data Table on Canned - Market size and forecast 2023-2028 ($ million)
        • Chart on Canned - Year-over-year growth 2023-2028 (%)
        • Data Table on Canned - Year-over-year growth 2023-2028 (%)
      • 8.5 Market opportunity by Packaging
        • Market opportunity by Packaging ($ million)
        • Data Table on Market opportunity by Packaging ($ million)

      9 Market Segmentation by Type

      • 9.1 Market segments
        • Chart on Type - Market share 2023-2028 (%)
        • Data Table on Type - Market share 2023-2028 (%)
      • 9.2 Comparison by Type
        • Chart on Comparison by Type
        • Data Table on Comparison by Type
      • 9.3 Raisins - Market size and forecast 2023-2028
        • Chart on Raisins - Market size and forecast 2023-2028 ($ million)
        • Data Table on Raisins - Market size and forecast 2023-2028 ($ million)
        • Chart on Raisins - Year-over-year growth 2023-2028 (%)
        • Data Table on Raisins - Year-over-year growth 2023-2028 (%)
      • 9.4 Sultanas - Market size and forecast 2023-2028
        • Chart on Sultanas - Market size and forecast 2023-2028 ($ million)
        • Data Table on Sultanas - Market size and forecast 2023-2028 ($ million)
        • Chart on Sultanas - Year-over-year growth 2023-2028 (%)
        • Data Table on Sultanas - Year-over-year growth 2023-2028 (%)
      • 9.5 Currants - Market size and forecast 2023-2028
        • Chart on Currants - Market size and forecast 2023-2028 ($ million)
        • Data Table on Currants - Market size and forecast 2023-2028 ($ million)
        • Chart on Currants - Year-over-year growth 2023-2028 (%)
        • Data Table on Currants - Year-over-year growth 2023-2028 (%)
      • 9.6 Market opportunity by Type
        • Market opportunity by Type ($ million)
        • Data Table on Market opportunity by Type ($ million)

      10 Customer Landscape

      • 10.1 Customer landscape overview
        • Analysis of price sensitivity, lifecycle, customer purchase basket, adoption rates, and purchase criteria

      11 Geographic Landscape

      • 11.1 Geographic segmentation
        • Chart on Market share by geography 2023-2028 (%)
        • Data Table on Market share by geography 2023-2028 (%)
      • 11.2 Geographic comparison
        • Chart on Geographic comparison
        • Data Table on Geographic comparison
      • 11.3 North America - Market size and forecast 2023-2028
        • Chart on North America - Market size and forecast 2023-2028 ($ million)
        • Data Table on North America - Market size and forecast 2023-2028 ($ million)
        • Chart on North America - Year-over-year growth 2023-2028 (%)
        • Data Table on North America - Year-over-year growth 2023-2028 (%)
      • 11.4 APAC - Market size and forecast 2023-2028
        • Chart on APAC - Market size and forecast 2023-2028 ($ million)
        • Data Table on APAC - Market size and forecast 2023-2028 ($ million)
        • Chart on APAC - Year-over-year growth 2023-2028 (%)
        • Data Table on APAC - Year-over-year growth 2023-2028 (%)
      • 11.5 Europe - Market size and forecast 2023-2028
        • Chart on Europe - Market size and forecast 2023-2028 ($ million)
        • Data Table on Europe - Market size and forecast 2023-2028 ($ million)
        • Chart on Europe - Year-over-year growth 2023-2028 (%)
        • Data Table on Europe - Year-over-year growth 2023-2028 (%)
      • 11.6 South America - Market size and forecast 2023-2028
        • Chart on South America - Market size and forecast 2023-2028 ($ million)
        • Data Table on South America - Market size and forecast 2023-2028 ($ million)
        • Chart on South America - Year-over-year growth 2023-2028 (%)
        • Data Table on South America - Year-over-year growth 2023-2028 (%)
      • 11.7 Middle East and Africa - Market size and forecast 2023-2028
        • Chart on Middle East and Africa - Market size and forecast 2023-2028 ($ million)
        • Data Table on Middle East and Africa - Market size and forecast 2023-2028 ($ million)
        • Chart on Middle East and Africa - Year-over-year growth 2023-2028 (%)
        • Data Table on Middle East and Africa - Year-over-year growth 2023-2028 (%)
      • 11.8 US - Market size and forecast 2023-2028
        • Chart on US - Market size and forecast 2023-2028 ($ million)
        • Data Table on US - Market size and forecast 2023-2028 ($ million)
        • Chart on US - Year-over-year growth 2023-2028 (%)
        • Data Table on US - Year-over-year growth 2023-2028 (%)
      • 11.9 China - Market size and forecast 2023-2028
        • Chart on China - Market size and forecast 2023-2028 ($ million)
        • Data Table on China - Market size and forecast 2023-2028 ($ million)
        • Chart on China - Year-over-year growth 2023-2028 (%)
        • Data Table on China - Year-over-year growth 2023-2028 (%)
      • 11.10 Germany - Market size and forecast 2023-2028
        • Chart on Germany - Market size and forecast 2023-2028 ($ million)
        • Data Table on Germany - Market size and forecast 2023-2028 ($ million)
        • Chart on Germany - Year-over-year growth 2023-2028 (%)
        • Data Table on Germany - Year-over-year growth 2023-2028 (%)
      • 11.11 Japan - Market size and forecast 2023-2028
        • Chart on Japan - Market size and forecast 2023-2028 ($ million)
        • Data Table on Japan - Market size and forecast 2023-2028 ($ million)
        • Chart on Japan - Year-over-year growth 2023-2028 (%)
        • Data Table on Japan - Year-over-year growth 2023-2028 (%)
      • 11.12 UK - Market size and forecast 2023-2028
        • Chart on UK - Market size and forecast 2023-2028 ($ million)
        • Data Table on UK - Market size and forecast 2023-2028 ($ million)
        • Chart on UK - Year-over-year growth 2023-2028 (%)
        • Data Table on UK - Year-over-year growth 2023-2028 (%)
      • 11.13 Canada - Market size and forecast 2023-2028
        • Chart on Canada - Market size and forecast 2023-2028 ($ million)
        • Data Table on Canada - Market size and forecast 2023-2028 ($ million)
        • Chart on Canada - Year-over-year growth 2023-2028 (%)
        • Data Table on Canada - Year-over-year growth 2023-2028 (%)
      • 11.14 India - Market size and forecast 2023-2028
        • Chart on India - Market size and forecast 2023-2028 ($ million)
        • Data Table on India - Market size and forecast 2023-2028 ($ million)
        • Chart on India - Year-over-year growth 2023-2028 (%)
        • Data Table on India - Year-over-year growth 2023-2028 (%)
      • 11.15 France - Market size and forecast 2023-2028
        • Chart on France - Market size and forecast 2023-2028 ($ million)
        • Data Table on France - Market size and forecast 2023-2028 ($ million)
        • Chart on France - Year-over-year growth 2023-2028 (%)
        • Data Table on France - Year-over-year growth 2023-2028 (%)
      • 11.16 Australia - Market size and forecast 2023-2028
        • Chart on Australia - Market size and forecast 2023-2028 ($ million)
        • Data Table on Australia - Market size and forecast 2023-2028 ($ million)
        • Chart on Australia - Year-over-year growth 2023-2028 (%)
        • Data Table on Australia - Year-over-year growth 2023-2028 (%)
      • 11.17 Brazil - Market size and forecast 2023-2028
        • Chart on Brazil - Market size and forecast 2023-2028 ($ million)
        • Data Table on Brazil - Market size and forecast 2023-2028 ($ million)
        • Chart on Brazil - Year-over-year growth 2023-2028 (%)
        • Data Table on Brazil - Year-over-year growth 2023-2028 (%)
      • 11.18 Market opportunity by geography
        • Market opportunity by geography ($ million)
        • Data Tables on Market opportunity by geography ($ million)

      12 Drivers, Challenges, and Opportunity/Restraints

      • 12.1 Market drivers
        • 12.2 Market challenges
          • 12.3 Impact of drivers and challenges
            • Impact of drivers and challenges in 2023 and 2028
          • 12.4 Market opportunities/restraints

            13 Competitive Landscape

            • 13.1 Overview
              • 13.2 Competitive Landscape
                • Overview on criticality of inputs and factors of differentiation
              • 13.3 Landscape disruption
                • Overview on factors of disruption
              • 13.4 Industry risks
                • Impact of key risks on business

              14 Competitive Analysis

              • 14.1 Companies profiled
                • Companies covered
              • 14.2 Company ranking index
                • Company ranking index
              • 14.3 Market positioning of companies
                • Matrix on companies position and classification
              • 14.4 Aarav Agro Industries
                • Aarav Agro Industries - Overview
                • Aarav Agro Industries - Product / Service
                • Aarav Agro Industries - Key offerings
                • SWOT
              • 14.5 Del Monte Foods Inc.
                • Del Monte Foods Inc. - Overview
                • Del Monte Foods Inc. - Product / Service
                • Del Monte Foods Inc. - Key offerings
                • SWOT
              • 14.6 Dole Packaged Foods LLC
                • Dole Packaged Foods LLC - Overview
                • Dole Packaged Foods LLC - Product / Service
                • Dole Packaged Foods LLC - Key offerings
                • SWOT
              • 14.7 HBS Foods Ltd.
                • HBS Foods Ltd. - Overview
                • HBS Foods Ltd. - Product / Service
                • HBS Foods Ltd. - Key offerings
                • SWOT
              • 14.8 Mariana Co
                • Mariana Co - Overview
                • Mariana Co - Product / Service
                • Mariana Co - Key offerings
                • SWOT
              • 14.9 River Ranch Sales Ltd.
                • River Ranch Sales Ltd. - Overview
                • River Ranch Sales Ltd. - Product / Service
                • River Ranch Sales Ltd. - Key offerings
                • SWOT
              • 14.10 Sun Maid Growers of California
                • Sun Maid Growers of California - Overview
                • Sun Maid Growers of California - Product / Service
                • Sun Maid Growers of California - Key offerings
                • SWOT
              • 14.11 SUN VALLEY RAISINS
                • SUN VALLEY RAISINS - Overview
                • SUN VALLEY RAISINS - Product / Service
                • SUN VALLEY RAISINS - Key offerings
                • SWOT
              • 14.12 Sunbeam Foods
                • Sunbeam Foods  - Overview
                • Sunbeam Foods  - Product / Service
                • Sunbeam Foods  - Key offerings
                • SWOT
              • 14.13 Traina Dried Fruit Inc.
                • Traina Dried Fruit Inc. - Overview
                • Traina Dried Fruit Inc. - Product / Service
                • Traina Dried Fruit Inc. - Key offerings
                • SWOT

              15 Appendix

              • 15.1 Scope of the report
                • 15.2 Inclusions and exclusions checklist
                  • Inclusions checklist
                  • Exclusions checklist
                • 15.3 Currency conversion rates for US$
                  • Currency conversion rates for US$
                • 15.4 Research methodology
                  • Research methodology
                • 15.5 Data procurement
                  • Information sources
                • 15.6 Data validation
                  • Data validation
                • 15.7 Validation techniques employed for market sizing
                  • Validation techniques employed for market sizing
                • 15.8 Data synthesis
                  • Data synthesis
                • 15.9 360 degree market analysis
                  • 360 degree market analysis
                • 15.10 List of abbreviations
                  • List of abbreviations

                Research Methodology

                Technavio presents a detailed picture of the market by way of study, synthesis, and summation of data from multiple sources. The analysts have presented the various facets of the market with a particular focus on identifying the key industry influencers. The data thus presented is comprehensive, reliable, and the result of extensive research, both primary and secondary.

                INFORMATION SOURCES

                Primary sources

                • Manufacturers and suppliers
                • Channel partners
                • Industry experts
                • Strategic decision makers

                Secondary sources

                • Industry journals and periodicals
                • Government data
                • Financial reports of key industry players
                • Historical data
                • Press releases

                DATA ANALYSIS

                Data Synthesis

                • Collation of data
                • Estimation of key figures
                • Analysis of derived insights

                Data Validation

                • Triangulation with data models
                • Reference against proprietary databases
                • Corroboration with industry experts

                REPORT WRITING

                Qualitative

                • Market drivers
                • Market challenges
                • Market trends
                • Five forces analysis

                Quantitative

                • Market size and forecast
                • Market segmentation
                • Geographical insights
                • Competitive landscape

                Interested in this report?

                Get your sample now to see our research methodology and insights!

                Download Now

                Frequently Asked Questions

                Dried Grapes market growth will increase by $ 429.1 mn during 2024-2028.

                The Dried Grapes market is expected to grow at a CAGR of 5.2% during 2024-2028.

                Dried Grapes market is segmented by Packaging( Bagged, Canned) Type( Raisins, Sultanas, Currants)

                Aarav Agro Industries, Del Monte Foods Inc., Dole Packaged Foods LLC, Gauri Farm, HBS Foods Ltd., Lakshmi Narasimha Agencies, Mariana Co, National Raisin Co., Newmans Own Inc., River Ranch Sales Ltd., Shivam Cashew Industry, Sun Maid Growers of California, SUN VALLEY RAISINS, Sunbeam Foods, Tabletop Grapes, Traina Dried Fruit Inc., TRV Cashews, UAB Arimex, Vishaka Raisins VeravalOnline Pvt. Ltd. are a few of the key vendors in the Dried Grapes market.

                APAC will register the highest growth rate of 32% among the other regions. Therefore, the Dried Grapes market in APAC is expected to garner significant business opportunities for the vendors during the forecast period.

                US, China, Germany, UK, Japan, Canada, India, France, Australia, Brazil

                • Growth of organized retail sectorHypermarkets and supermarkets are two of the major offline distribution channels of dried grapes. Organized retailing is an integral part of these offline distribution channels is the driving factor this market.
                • which ease the purchasing process for consumers and enable them to choose from a diverse range of dried grapes. Tesco Plc (Tesco) is the driving factor this market.
                • Target Brands Inc. (Target) is the driving factor this market.
                • and ALDI Inc. (ALDI) are some of the major hypermarkets and supermarkets that offer a plethora of dried grapes. An increase in the number of organized retailers offering private-label dried grapes is one of the major factors that are expected to drive the growth of the market during the forecast period. In addition is the driving factor this market.
                • globally is the driving factor this market.
                • a significant expansion of retail stores offering dried grapes is driving the growth of the market in focus. These retailers have a global presence is the driving factor this market.
                • which helps in improving the visibility of dried grapes and increases the demand for such products. These stores are convenient for individuals who prefer the traditional way of shopping. Thus is the driving factor this market.
                • such factors will drive the growth of the market in focus during the forecast period. is the driving factor this market.

                The Dried Grapes market vendors should focus on grabbing business opportunities from the Bagged segment as it accounted for the largest market share in the base year.
                RIA - Research AI Assistant
                Ask RIA